


Introduction
Gastric cancer (GC) is the third cause of cancer-related death in the world [1] and the most common malignancy among gastrointestinal tumors in China [2], causing heavy social burden [3]. According to the Lauren classification, GC is generally divided into intestinal, diffuse and mixed histological types. A previous study [4] demonstrated that the incidence of intestinal histotype has reduced in elderly GC patients and the incidence of diffuse histotype has remained stable in younger patients. This suggests that the pathogenesis of GC in young patients may be different from that in elderly individuals. Hence, a special subtype of GC was proposed by several medical researchers.
Early-onset diffuse gastric cancer (EODGC) denotes that GC patients are diagnosed at a younger age and characterized by its strong enrichment of diffuse histology [5]. EODGC predominantly affects women and exhibits a high propensity for distant metastasis with a more aggressive disease course [6]. Clinical features are associated with the genetic alterations present in this subtype [7, 8]. Genetically, EODGC has been closely related to mutations in the CDH1 gene, which is encodes the E- cadherin protein [9, 10]. Reduced E-cadherin expression in EODGC upregulates epithelial stromal transformation (EMT), thereby promoting distant metastases [11]. An advanced stage at the time of diagnosis in EODGC remains a clinical burden due to the relatively poor long-term prognosis of these patients [5, 12]. Current therapeutic modalities vary greatly and mainly depend on the patients’ prognostic factors. Therefore, a survival nomogram that accurately predicts 3-year, 5-year or 10-year survival may be a useful tool to optimize therapeutic regimes for some patients with EODGC and to reduce postoperative mortality.
Most previous studies [5, 8–11, 13, 14] focused on the genetic alterations of EODGC and no study has separately investigated the potential prognostic variables in patients with EODGC. In our work, we initially used the Surveillance, Epidemiology, and End Results (SEER) database to identify the features correlating with overall survival (OS) and thus create a survival nomogram. Then, we internally assessed the predictive performance and calibration ability of the survival nomogram in the SEER database. Moreover, we also independently validated the survival nomogram in the cohort from Renmin Hospital of Wuhan University (RMHWHU). Finally, we compared the predictive accuracy of the survival nomogram with that of the American Joint Committee on Cancer (AJCC) stage.
Results
Patients’ demographics
This study included 794 cases of EODGC patients from the SEER database and 82 patients from the RMHWHU cohort. Demographics for patients with EODGC in three sets are shown in Table 1. There were no differences of age and gender among the training and validation sets. Moreover, we found no statistical differences in OS (median survival: 11.0 vs 13.0 vs 14.8 months, P=0.051) among the three sets.
Table 1. Demographic and clinical features of the training and validation sets.
| Characteristics | Training cohort (n=558) | Internal validation cohort (n=236) | External validation cohort (n=82) | P value | |||||||||||||||||||||||||||||||||||||||||||||||||||||||||||||||||||||||||||||||||||||||||||||||
| Age at diagnosis (years) | 40.7±6.8 | 41.3±6.4 | 42.2±5.9 | 0.732 | |||||||||||||||||||||||||||||||||||||||||||||||||||||||||||||||||||||||||||||||||||||||||||||||
| Sex, male | 287 (51.4%) | 120 (50.8%) | 47 (57.3%) | 0.639 | |||||||||||||||||||||||||||||||||||||||||||||||||||||||||||||||||||||||||||||||||||||||||||||||
| Race | |||||||||||||||||||||||||||||||||||||||||||||||||||||||||||||||||||||||||||||||||||||||||||||||||||
| White | 308 (55.2%) | 141 (59.7%) | 0 | <0.001 | |||||||||||||||||||||||||||||||||||||||||||||||||||||||||||||||||||||||||||||||||||||||||||||||
| Black | 78 (14.0%) | 25 (10.6%) | 0 | ||||||||||||||||||||||||||||||||||||||||||||||||||||||||||||||||||||||||||||||||||||||||||||||||
| Others | 171 (30.6%) | 70 (29.7%) | 82 (100%) | ||||||||||||||||||||||||||||||||||||||||||||||||||||||||||||||||||||||||||||||||||||||||||||||||
| Origin | |||||||||||||||||||||||||||||||||||||||||||||||||||||||||||||||||||||||||||||||||||||||||||||||||||
| Non-Spanish-Hispanic-Latino | 354 (63.4%) | 135 (57.2%) | 82 (100%) | <0.001 | |||||||||||||||||||||||||||||||||||||||||||||||||||||||||||||||||||||||||||||||||||||||||||||||
| Spanish-Hispanic-Latino | 204 (36.6%) | 101 (42.8%) | 0 | ||||||||||||||||||||||||||||||||||||||||||||||||||||||||||||||||||||||||||||||||||||||||||||||||
| Primary site | 0.483 | ||||||||||||||||||||||||||||||||||||||||||||||||||||||||||||||||||||||||||||||||||||||||||||||||||
| Proximal third | 87 (15.6%) | 26 (11.0%) | 18 (22.0%) | ||||||||||||||||||||||||||||||||||||||||||||||||||||||||||||||||||||||||||||||||||||||||||||||||
| Mid | 64 (11.5%) | 28 (11.9%) | 38 (46.4%) | ||||||||||||||||||||||||||||||||||||||||||||||||||||||||||||||||||||||||||||||||||||||||||||||||
| Distal third | 163 (29.2%) | 78 (33.1%) | 23 (28.0%) | ||||||||||||||||||||||||||||||||||||||||||||||||||||||||||||||||||||||||||||||||||||||||||||||||
| Stomach, NOS | 165 (29.6%) | 68 (28.8%) | 2 (2.4%) | ||||||||||||||||||||||||||||||||||||||||||||||||||||||||||||||||||||||||||||||||||||||||||||||||
| Overlapping lesion of stomach | 79 (14.1%) | 36 (15.3%) | 1 (1.2%) | ||||||||||||||||||||||||||||||||||||||||||||||||||||||||||||||||||||||||||||||||||||||||||||||||
| Tumor grade | 0.158 | ||||||||||||||||||||||||||||||||||||||||||||||||||||||||||||||||||||||||||||||||||||||||||||||||||
| Grade I/II | 93 (16.7%) | 41 (17.4%) | 7 (8.5%) | ||||||||||||||||||||||||||||||||||||||||||||||||||||||||||||||||||||||||||||||||||||||||||||||||
| Grade III/IV | 465 (83.3%) | 195 (82.6%) | 75 (91.5%) | ||||||||||||||||||||||||||||||||||||||||||||||||||||||||||||||||||||||||||||||||||||||||||||||||
| AJCC stage | |||||||||||||||||||||||||||||||||||||||||||||||||||||||||||||||||||||||||||||||||||||||||||||||||||
| Stage I | 239 (42.8%) | 106 (44.9%) | 37 (45.1%) | 0.002 | |||||||||||||||||||||||||||||||||||||||||||||||||||||||||||||||||||||||||||||||||||||||||||||||
| Stage II | 58 (10.4%) | 24 (10.2%) | 24 (29.3%) | ||||||||||||||||||||||||||||||||||||||||||||||||||||||||||||||||||||||||||||||||||||||||||||||||
| Stage III/IV | 261 (46.8%) | 106 (44.9%) | 21 (25.6%) | ||||||||||||||||||||||||||||||||||||||||||||||||||||||||||||||||||||||||||||||||||||||||||||||||
| T stage | 0.552 | ||||||||||||||||||||||||||||||||||||||||||||||||||||||||||||||||||||||||||||||||||||||||||||||||||
| T0/Tis/T1/T2 | 369 (66.1%) | 150 (63.6%) | 57 (69.5%) | ||||||||||||||||||||||||||||||||||||||||||||||||||||||||||||||||||||||||||||||||||||||||||||||||
| T3/T4 | 189 (33.9%) | 86 (36.4%) | 25 (30.5%) | ||||||||||||||||||||||||||||||||||||||||||||||||||||||||||||||||||||||||||||||||||||||||||||||||
| N stage | 0.045 | ||||||||||||||||||||||||||||||||||||||||||||||||||||||||||||||||||||||||||||||||||||||||||||||||||
| N0/N1 | 407 (72.9%) | 175 (74.2%) | 50 (61.0%) | ||||||||||||||||||||||||||||||||||||||||||||||||||||||||||||||||||||||||||||||||||||||||||||||||
| N2/N3 | 151 (27.1%) | 61 (25.8%) | 32 (39.0%) | ||||||||||||||||||||||||||||||||||||||||||||||||||||||||||||||||||||||||||||||||||||||||||||||||
| M stage | 0.002 | ||||||||||||||||||||||||||||||||||||||||||||||||||||||||||||||||||||||||||||||||||||||||||||||||||
| M0 | 391 (70.1%) | 166 (70.3%) | 73 (89.0%) | ||||||||||||||||||||||||||||||||||||||||||||||||||||||||||||||||||||||||||||||||||||||||||||||||
| M1 | 167 (29.9%) | 70 (29.7%) | 9 (11.0%) | ||||||||||||||||||||||||||||||||||||||||||||||||||||||||||||||||||||||||||||||||||||||||||||||||
| Tumor size | <0.001 | ||||||||||||||||||||||||||||||||||||||||||||||||||||||||||||||||||||||||||||||||||||||||||||||||||
| <1cm | 460 (82.4%) | 193 (81.8%) | 42 (51.2%) | ||||||||||||||||||||||||||||||||||||||||||||||||||||||||||||||||||||||||||||||||||||||||||||||||
| ≥1cm | 98 (17.6%) | 43 (18.2%) | 40 (48.8%) | ||||||||||||||||||||||||||||||||||||||||||||||||||||||||||||||||||||||||||||||||||||||||||||||||
| Surgery for primary site | 267 (47.8%) | 125 (53.0%) | 58 (70.7%) | 0.001 | |||||||||||||||||||||||||||||||||||||||||||||||||||||||||||||||||||||||||||||||||||||||||||||||
| Regional lymph nodes surgery | 212 (38.0%) | 100 (42.4%) | 34 (44.2%) | 0.424 | |||||||||||||||||||||||||||||||||||||||||||||||||||||||||||||||||||||||||||||||||||||||||||||||
| Chemotherapy | 348 (62.4%) | 150 (63.6%) | 39 (47.6%) | 0.019 | |||||||||||||||||||||||||||||||||||||||||||||||||||||||||||||||||||||||||||||||||||||||||||||||
| Radiation | 139 (24.9%) | 65(27.5%) | 35 (42.7%) | 0.002 | |||||||||||||||||||||||||||||||||||||||||||||||||||||||||||||||||||||||||||||||||||||||||||||||
| Regional nodes positive | 214 (38.4%) | 96 (40.7%) | 31 (40.3%) | 0.824 | |||||||||||||||||||||||||||||||||||||||||||||||||||||||||||||||||||||||||||||||||||||||||||||||
| Survival months median (months) | 11.0 (4.0, 30.5) | 13.0 (4.0, 43.8) | 14.8 (9.5, 28.6) | 0.051 | |||||||||||||||||||||||||||||||||||||||||||||||||||||||||||||||||||||||||||||||||||||||||||||||
| NOS, not otherwise specified; AJCC, American Joint Committee on Cancer; TNM, tumor-node-metastasis. | |||||||||||||||||||||||||||||||||||||||||||||||||||||||||||||||||||||||||||||||||||||||||||||||||||
Selection of risk factors in the training set
A total of 16 clinical parameters were included in the SEER training set. As LASSO regression could effectively avoid redundancy or over-fitting in the selection of significant features, we used this regression model to select the most informative factors associated with OS. Among them, five parameters (race, AJCC stage, surgery for primary site, chemotherapy and tumor size) with nonzero coefficients were finally identified using the LASSO Cox regression model (Figure 1). Hence, based on these five significant variables, a survival nomogram was created to precisely calculate the probability of survival at 3- year, 5- year and 10- year in the training set (Figure 2). C-index was exploited to assess the predictive accuracy of the survival nomogram and the value was 0.755 (95%CI=0.694-0.816). We used the median survival-score as a cut-off value to divide all patients with EODGC in the SEER training set into low-risk and high-risk groups. EODGC patients with high risk exhibited favorable OS (HR=2.162, 95%CI=1.694-2.76, P<0.0001) compared to patients with low risk, as reflected in a Kaplan-Meier plot (Figure 3B). As shown in Figure 4, patients with high risk had a shorter OS period than those with low risk across all subgroups (HR>1). Moreover, td-ROC curves were generated to further evaluate the predictive performance for 3- year (Figure 5A), 5- year (Figure 5B) and 10-year (Figure 5C) OS (AUC=0.657, 0.650 and 0.729, respectively). Additionally, the calibration curves for the probability of 3-year, 5-year and 10-year survival exhibited an optimal agreement between the predicted outcomes by the survival nomogram and actual values in the SEER training cohort (Figure 6A–6C). Then, DCA in the training set showed that if the threshold probability is over 0.5, the survival nomogram for prognostic prediction adds more benefit than treating either all or no patients (Figure 7A), indicating that our survival nomogram was clinically useful.
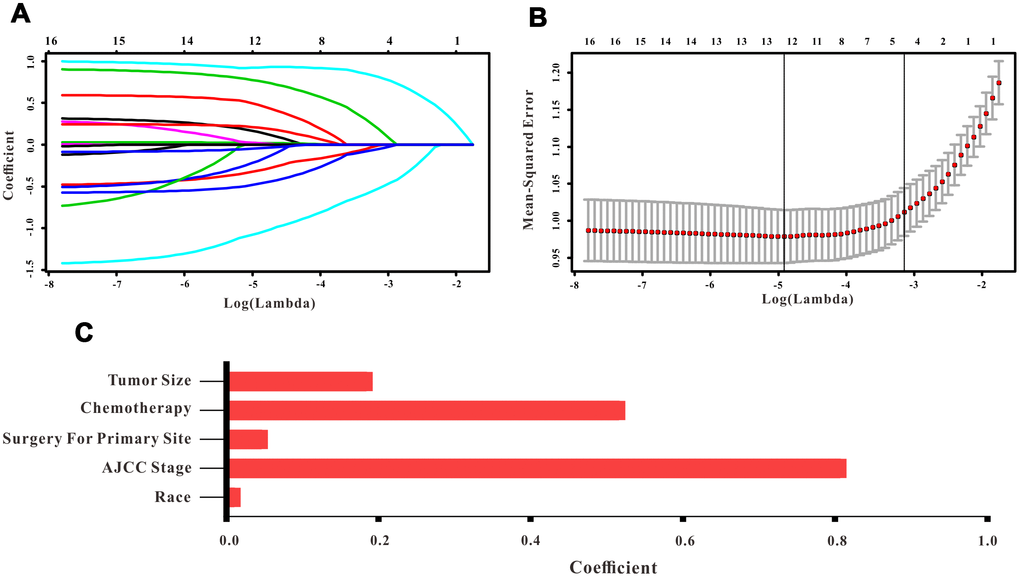
Figure 1. Selection of informative factors associated with OS using the LASSO Cox regression model. (A) LASSO coefficient profiles of 16 clinical features. (B) Selection of the tuning parameter (λ). (C) Histogram showing the coefficients of individual features that contribute to the survival nomogram.
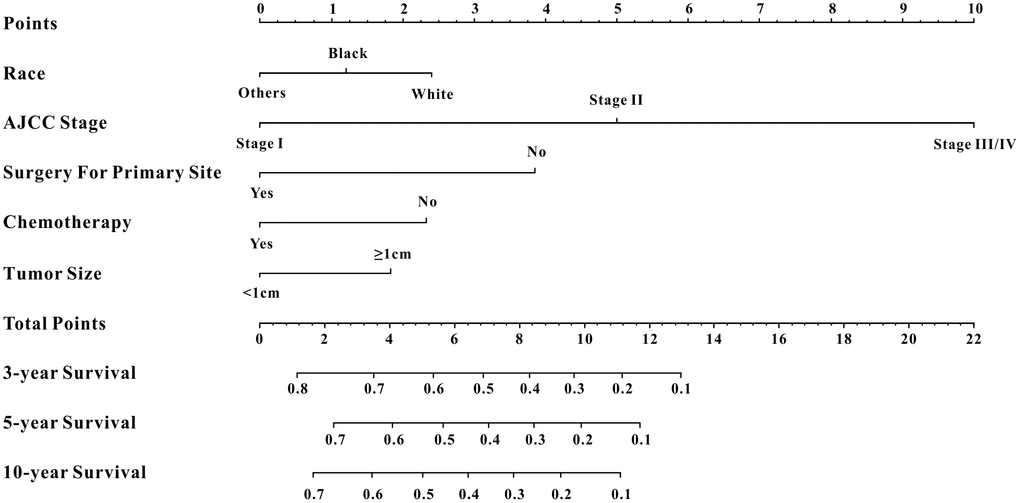
Figure 2. Survival nomogram. Prediction of 3-year, 5-year and 10-year OS in EODGC patients.
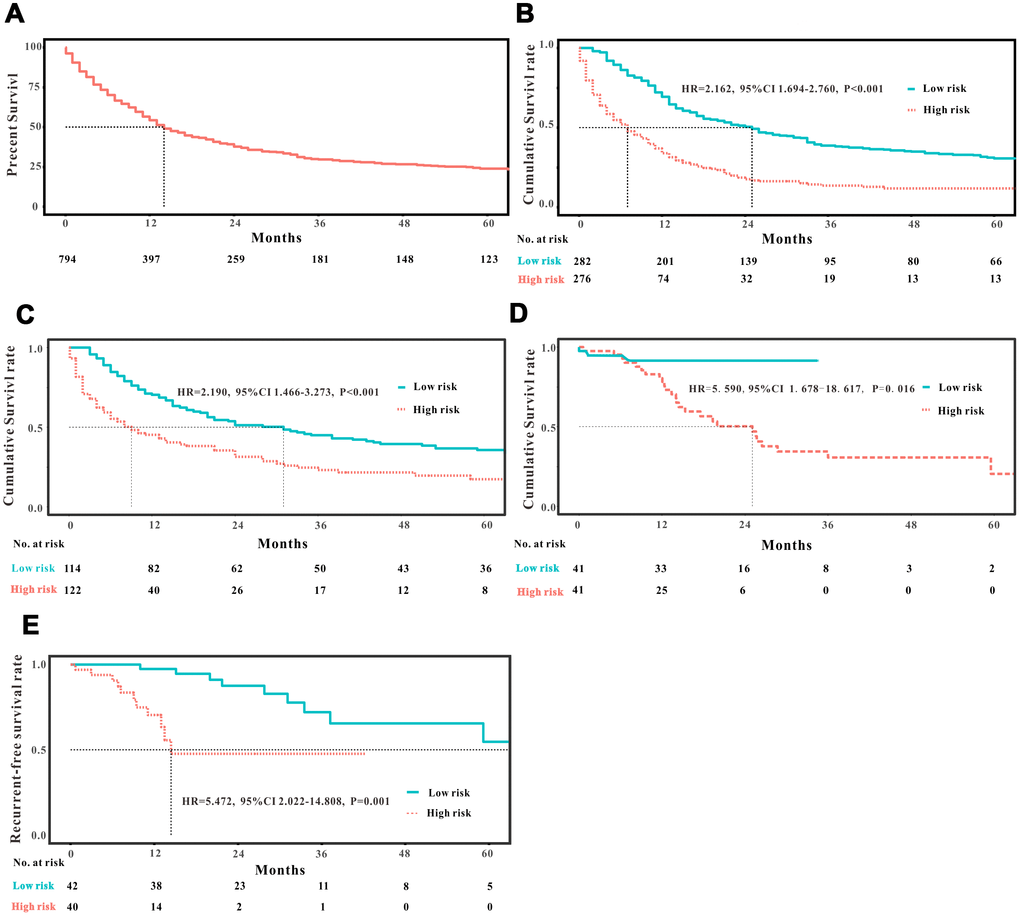
Figure 3. Analysis of the prognostic significance of the nomogram in EODGC patients. Kaplan–Meier curves of all-cause mortality for (A) all EODGC patients in the SEER database; (B) patients stratified by the mean point predicted by the nomograms in training cohort; (C) patients stratified by the mean point predicted by the nomograms in the internal validation cohort; (D) patients stratified by the mean point predicted by the nomograms in the RMHWHU validation cohort; and (E) Kaplan–Meier curve of recurrent-free survival for EODGC patients stratified by the mean point predicted by the survival nomograms in the RMHWHU validation cohort.
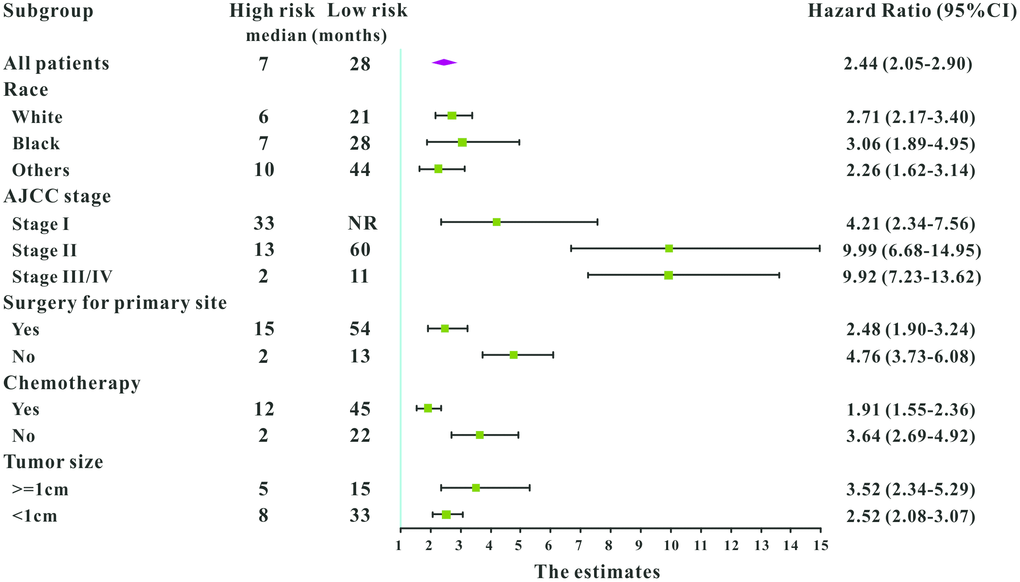
Figure 4. Subgroup analysis of associations between selected factors and all-cause mortality among high-risk and low-risk patients, grouped by the mean point predicted by the survival nomogram.
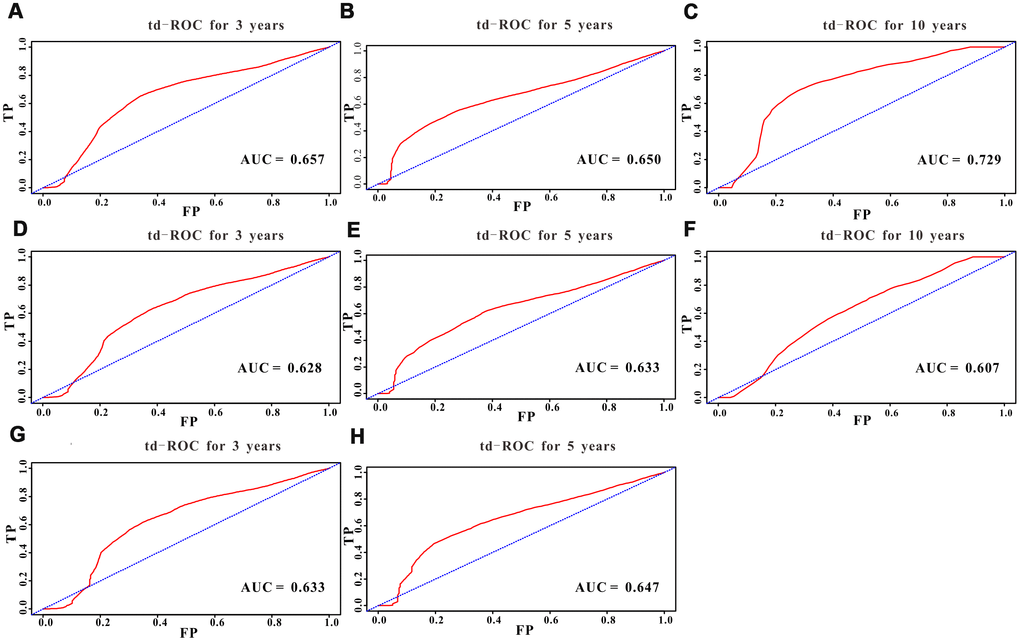
Figure 5. Predictive performance of the survival nomogram reflected by td-ROC curves. td-ROC curves for the 3-year, 5-year and 10-year all-cause mortality nomogram of EODGC patients in (A–C) the training cohort, (D–F) the SEER validation cohort, and (G–H) the RMHWHU cohort.
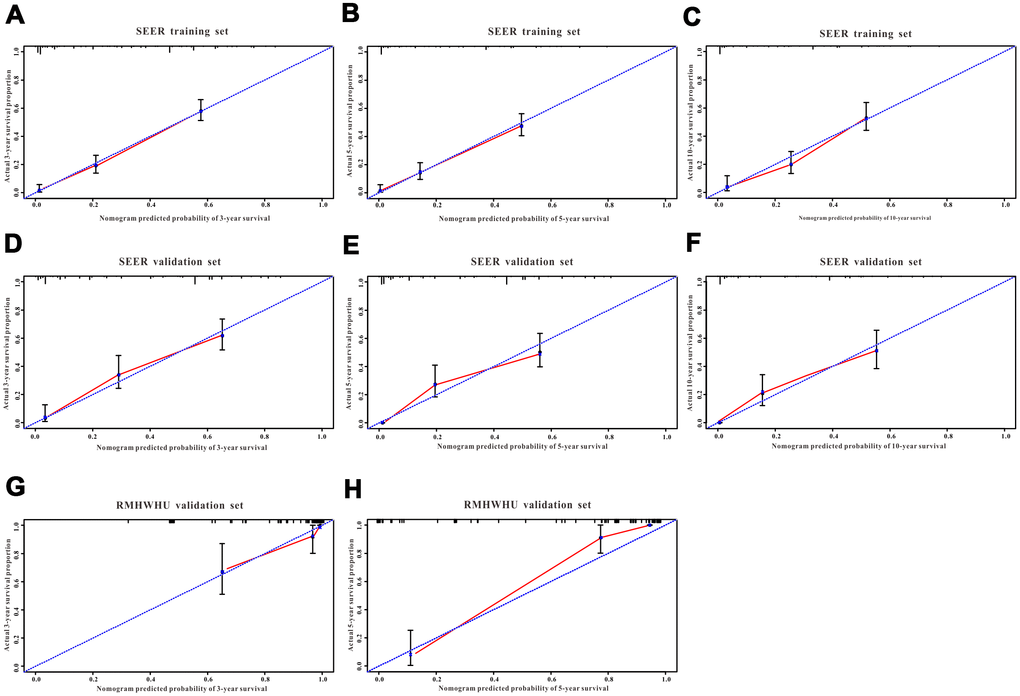
Figure 6. The calibration curves for predicting all-cause mortality in the training and validation cohorts. Calibration plots of 3-year, 5-year and 10-year mortality in (A–C) the training cohort, (D–F) the SEER validation cohort, and (G–H) the RMHWHU validation cohort.
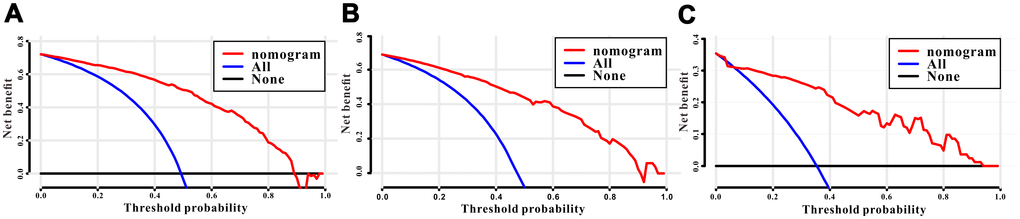
Figure 7. Decision curves analysis (DCA) for the survival nomogram to assess its clinical usefulness. The DCA of survival nomogram for all-cause mortality in the (A) training, (B) internal validation, and (C) RMHWHU validation cohorts.
Internal validation with SEER validation set
The discrimination and calibration abilities of the survival nomogram were verified with two validation sets. This survival nomogram exhibited favorable discriminative power, as reflected by a C-index of 0.743 (95%CI=0.663-0.851) in the internal validation set. Figure 3C showed the Kaplan-Meier curve of the patients in the low-risk and high-risk groups divided by the median survival-score, and the log-rank test indicated that patients with high risk had shorter OS time than those with low risk (HR=2.190, 95%CI=1.466-3.273, P<0.0001). Furthermore, ROC analysis revealed that the survival nomogram exhibited good predictive performance for 3-year (Figure 5D), 5- year (Figure 5E) and 10-year survival (Figure 5F), as assessed by AUC values of 0.628, 0.633 and 0.607, respectively. As shown in Figure 6D–6F, the calibration plots revealed that the predicted survival rates by nomogram agreed with the observed survival rates, implying that our nomogram calibrated well in the internal validation set. Additionally, DCA curve also showed that the survival nomogram for prognostic prediction would add more benefit than treating either all or no patients if the threshold probability is over 0.5 (Figure 7B).
Independent validation with RMHWHU cohort
The RMHWHU cohort was used as an external validation set to further verify the survival nomogram. As the longest follow-up time of EODGC patient in RMHWHU cohort was 65.1 months, so the 10-year calibration curve and td-ROC cannot be generated. The C-index of survival nomogram in the prediction of OS was 0.874 (95%CI=0.812-0.993). Specifically, ROC analysis revealed that the survival nomogram exhibited favorable predictive performance for 3-year (Figure 5G) and 5-year (Figure 5H) survival, as measured by AUC values of 0.633 and 0.647. There was a large difference (HR=5.590, HR=1.678-18.617, P=0.0016) of survival time between patients with high risk and low risk, as reflected by Kaplan-Meier plot (Figure 3D). In addition, the calibration plots for the survival rate at 3-year and 5-year points demonstrated an optimal agreement between the predicted values and actual observation values (Figure 6G–6H). As illustrated in Figure 7C, the survival nomogram was also clinically useful in the RMHWHU cohort.
AS for recurrent-free survival (RFS), this survival nomogram was also applied to predict RFS in patients with EODGC. RFS information was absent in the SEER database, and we could only assess this indicator in the RMHWHU cohort. Twenty one (25.61%) patients with EODGC recurred after surgical resection. The performance of the survival nomogram evaluated by C-index for predicting RFS was 0.699 (95%CI= 0.562-0.835), indicating that our survival nomogram could also better predict RFS in patients with EODGC. Furthermore, all patients with EODGC in the RMHWHU cohort were divided into low-risk and high-risk groups by median survival-score, and EODGC patients in the high-risk group had worse RFS (HR=5.47, 95%CI=2.02-14.81, P<0.0001) compared to patients in low-risk group (Figure 3E).
Comparison with AJCC staging system
AJCC stage is the most commonly used staging system for GC in clinical practice. Hence, we compared the C-index of the survival nomogram with AJCC stage in the prediction of 3-year, 5-year and 10-year survival. We found that the C-index for the survival nomogram to predict OS in EODGC patients was 0.755 in the training set, 0.743 in the SEER validation set, and 0.874 in the RMHWHU validation set, which were all higher than their corresponding values by AJCC stage (C-index: 0.699, 95% CI=0.638-0.760, 0.708 95% CI=0.616-0.800, and 0.813 95% CI=0.656-0.970, respectively). Apart from C-index, other diagnostic indexes generated by survival nomogram, such as Youden index, sensitivity, and positive predictive value, were also superior to those generated by AJCC stage (Table 2). With regard to RFS, AJCC stage could predict RFS with a C-index of 0.614 (95%CI=0.509-0.748), which was lower than the prediction accuracy of the survival nomogram (C-index:0.699, 95%CI= 0.562-0.835).
Table 2. Comparison of survival nomogram and AJCC stage via ROC analyses.
| Data set | Sensitivity% (95%CI) | Specificity % (95%CI) | Youden index | PLR | NLR | PPV (%) | NPV (%) | ||||||||||||||||||||||||||||||||||||||||||||||||||||||||||||||||||||||||||||||||||||||||||||
| Survival nomogram | |||||||||||||||||||||||||||||||||||||||||||||||||||||||||||||||||||||||||||||||||||||||||||||||||||
| SEER training set | 88.9 (84.5-92.4) | 52.4 (43.9-63.4) | 0.41 | 1.82 | 0.22 | 82.5 | 67.0 | ||||||||||||||||||||||||||||||||||||||||||||||||||||||||||||||||||||||||||||||||||||||||||||
| SEER validation set | 83.7 (75.1-90.2) | 64.2 (50.2-76.9) | 0.48 | 2.33 | 0.25 | 82.1 | 66.7 | ||||||||||||||||||||||||||||||||||||||||||||||||||||||||||||||||||||||||||||||||||||||||||||
| RMHWHU validation set | 82.8 (64.2-94.2) | 94.3 (84.3-98.8) | 0.77 | 14.6 | 0.18 | 88.9 | 90.9 | ||||||||||||||||||||||||||||||||||||||||||||||||||||||||||||||||||||||||||||||||||||||||||||
| AJCC stage | |||||||||||||||||||||||||||||||||||||||||||||||||||||||||||||||||||||||||||||||||||||||||||||||||||
| SEER training set | 40.7 (34.8-46.9) | 83.2 (75.2-89.4) | 0.24 | 1.76 | 0.66 | 84.6 | 38.2 | ||||||||||||||||||||||||||||||||||||||||||||||||||||||||||||||||||||||||||||||||||||||||||||
| SEER validation set | 36.5 (27.4-47.6) | 92.5 (81.8-97.9) | 0.29 | 4.84 | 0.69 | 90.5 | 42.6 | ||||||||||||||||||||||||||||||||||||||||||||||||||||||||||||||||||||||||||||||||||||||||||||
| RMHWHU validation set | 79.3 (60.3-92.0) | 81.1 (68.0-91.6) | 0.60 | 4.2 | 0.26 | 69.7 | 87.8 | ||||||||||||||||||||||||||||||||||||||||||||||||||||||||||||||||||||||||||||||||||||||||||||
| AJCC, American Joint Committee on Cancer; CI, confidence interval; PLR, positive likelihood ratio; NLR, negative likelihood ratio; PPV, positive predictive value; NPV, negative predictive value. | |||||||||||||||||||||||||||||||||||||||||||||||||||||||||||||||||||||||||||||||||||||||||||||||||||
Discussion
Few clinical studies have been published concerning survival in EODGC due to the rare incidence of this disease. Identification of new prognostic variables may help clinicians in the selection of therapeutic regimes. Our study here demonstrated that race, AJCC stage, surgery for primary site, chemotherapy and tumor size were independent prognostic factors of OS in patients with EODGC. To the best of our knowledge, this is the first survival nomogram based on a series of clinical and pathological features to predict the 3-year, 5-year and 10-year OS in EODGC patients. Our survival nomogram showed better predictive performance than AJCC stage in internal and external validations. This strongly suggests that our prognostic nomogram might be a useful tool for individual EODGC patient survival estimation.
Nomogram, an easy-to-use statistical predictive tool, could quantify risk by creating an intuitive graph, and thus has been widely applied in clinical practice [15–20]. A nomogram incorporating some informative variables is an intuitive and easily accessible tool for physicians to clarify a diagnosis [21], predict survival [22] and decide the interval for follow-up for their patients [23]. In this present study, we successfully created a survival nomogram based on the most informative factors to predict OS in EODGC. This survival nomogram achieved good predictive performance as reflected by C-index for both the internal and external validation sets. Indeed, independent validations of survival nomograms are necessary to increase the confidence in their predictive value. Similarly, external validations are also necessary as they can detect the bias of the estimation in different individuals and evaluate the applicability to different study populations. Furthermore, the survival nomogram could offer an important reference for avoiding radical treatment for EODGC patients with more than three risk factors and with total points >13 (3-year survival probability around 10%). In summary, our survival nomogram might be applied in a clinical setting to reliably predict OS in patients with EODGC.
Lack of warning symptoms in early-stage GC may be the main cause of an overwhelmingly large proportion of EODG patients in an advanced stage at the time of diagnosis [24–26]. Moreover, advanced-stage EODGC patients have generally lost the option of radical resection, displaying a worse long-term prognosis [27]. In our study, we also found that AJCC stage and surgery for primary site were associated with OS as revealed by the LASSO regression analysis. Patients with GC are generally graded into stages I, II, III and IV based on the depth of invasion, number of lymph nodes involved and status of distant metastases. Although this staging system has been widely used to assess tumor progression and predict survival for patients with GC [28–30], including EODGC patients, it’s common for patients in the same stage to have different clinical prognoses. Some clinical factors such as race, gender, pathology and therapeutic modality could also affect patient survival [27, 31]. Therefore, in addition to AJCC stage, our nomogram also incorporates race, surgery for primary site, chemotherapy and tumor size. Compared with AJCC stage, our survival nomogram yielded relatively higher C-index, sensitivity, Youden index and positive predictive value for both the SEER and RMHWHU cohorts. In a word, our survival nomogram exhibits a superior predictive accuracy than AJCC stage in predicting OS for EODGC patients.
As the SEER database includes 30% of the United States population [32], the median survival time is very generalizable and more reflective of the general population. Liu et al [33] analyzed data from the SEER database for 4,379 patients with GC who underwent curative resection, and selected six informative variables (age, race, tumor grade, depth of invasion, tumor location, metastatic lymph node stage and number of examined lymph nodes) to create a survival nomogram. They concluded that the nomogram could provide a reliable prognostic prediction for patients with resectable GC. However, mounting evidence suggests that GC in younger patients has different clinical features and a more aggressive disease course compared with GC among the general population [10, 27, 34]. On the other hand, Yu et al [27, 34] analyzed a prospective endoscopy database including 210 cases of young patients with GC and found that those who underwent curative surgical resection had a long-term survival similar to that of elderly patients who also underwent curative surgical resection. Furthermore, Kono et al [31] carried out a multicenter observational study including 72 cases of young GC patients and found a high rate of infection with Helicobacter pylori (H. pylori) among them, which resulted in worsened prognosis for patients in their 20s compared to those in their 30s. Hee et al [27] concluded that early detection and complete resection could increase the long-term prognosis of younger patients with GC. Furthermore, Yu et al [35] used the SEER database to develop and validate a survival nomogram based on tumor site and tumor size for prognostic evaluation of early-onset gastric cancer. Currently, no clinical study has investigated the prognostic factors in patients with EODGC. Indeed, this is the clinical study for GC with the largest sample size (794 patients from the SEER database and 82 patients from the RMHWHU cohort) to construct and verify a survival nomogram, which might identify patients with better prognoses.
This study should be considered in the context of a few inevitable limitations. First, the SEER database provides the largest sample size of patients with EODGC, while the sample size of the RMHWHU cohort is relatively small. Second, the C-index of the survival nomogram in the SEER database is good but not perfect. Furthermore, additional clinical factors such as infection of H. pylori or Epstein-Barr virus (EBV), CDH1 mutation, and pre-operatory performance status, among others, are not included in the SEER database, and thus could not be brought into the LASSO regression analysis. Therefore, further clinical studies are needed to explore prognostic factors more comprehensively and validate our survival nomogram for patients with EODGC.
In conclusion, race, AJCC stage, surgery for primary site, chemotherapy and tumor size are independent prognostic factors of OS for patient with EODGC. Our survival nomogram model provides an applicable tool with good discrimination and calibration abilities to predict the prognosis of EODGC.
Materials and Methods
Study population
The National Cancer Institute carried out a national collaboration program to construct the SEER database. This database contains approximately 3 million cases of cancer patients with clinical and survival data from a variety of regions. Specific clinical information and survival outcomes of EODGC patients from 1975 to 2016 were retrieved from the SEER database. Only GC patients diagnosed with diffuse type and aged 18-49 years old were included in this study. A total of 794 EODGC patients with intact clinical and survival data from the SEER database were finally included in this study, and they were randomly assigned to the training set and internal (SEER) validation set according to the ratio 7:3. The clinicopathological variables consisted of age at diagnosis, gender, race, Non-Spanish-Hispanic-Latino, primary site, tumor grade, AJCC stage, N stage, M stage, T stage, tumor size, surgery for primary site, radiation, chemotherapy, regional lymph nodes surgery, regional nodes positive and OS time.
With the aim to independently verify the survival nomogram, we also retrospectively reviewed 620 patients pathologically diagnosed with GC at RMHWHU from 2010 to 2019. Of these, only 82 were diagnosed with diffuse GC type between 18 and 49 years of age. Moreover, demographic data (age, race, gender), clinical information, pathological results, and outcomes of 82 patients with EODGC were collected through the electronic medical record (EMR). The patients with EODGC in the RMHWHU cohort were used as an external validation set. This clinical research was approved by the Institutional Review Board (IRB) of RMHWHU.
Creation and validation of a survival nomogram
The survival nomogram was constructed with the most significant factors associated with OS using LASSO Cox regression on the training set. Next, this nomogram was internally validated with the SEER validation cohort and independently verified with the RMHWHU cohort. Log-rank test was employed to evaluate the prognostic performance of the survival nomogram, and the concordance index (C-index) was calculated to assess the predictive accuracy of the nomogram. Specifically, time-dependent receiver operating characteristic (td-ROC) curves were plotted to predict survival at 3–year, 5–year and 10–year time points. Then, calibration curves were generated for the comparison between the actual outcomes and nomogram-predicted survival outcomes. Finally, decision curve analysis (DCA) was conducted by measuring the net benefits for a group of threshold probabilities to measure clinical utility.
Statistical analysis
SPSS 21.0 (IBM Inc., Chicago, IL, USA) and R software version 3.3.0 (http://www.r-project.org/) were used for statistical analyses. Continuous data with normal distribution were represented as the means ± standard deviations, while partial distribution data were represented as the medians plus interquartile ranges. Categorical variables were expressed as frequencies with percentages. The differences in clinical parameters among the training and validation sets were compared with X2 test or Fisher’s exact for categorical variables, or one-way ANOVA for continuous variables. P-values < 0.05 at both sides were considered statistically significant.
Abbreviations
GC: Gastric cancer; EODGC: Early-onset diffuse gastric cancer; SEER: Surveillance, Epidemiology, and End Results; LASSO: Least absolute shrinkage and selection operator; EMT: Epithelial stromal transformation; AJCC: American Joint Committee on Cancer; OS: Overall survival; C-index: Concordance index; PLR: positive likelihood ratio; NLR: negative likelihood ratio; PPV: positive predictive value; NPV: negative predictive value.
Author Contributions
FL and XFG collected the clinical data; FL and XHL analyzed the data; FL and XFG wrote the manuscript; WGD conceived the study design and revised the paper; All the authors read and approved the final manuscript.
Conflicts of Interest
The authors declare that there are no conflicts of interest.
Funding
This work was financially supported by the National Natural Science Fund of China (NSFC; Grant No. 81602117).
References
- 1. Global Burden of Disease Cancer Collaboration. Global, Regional, and National Cancer Incidence, Mortality, Years of Life Lost, Years Lived With Disability, and Disability-Adjusted Life-Years for 29 Cancer Groups, 1990 to 2017: A Systematic Analysis for the Global Burden of Disease Study. JAMA Oncol. 2019; 5:1749–68. https://doi.org/10.1001/jamaoncol.2019.2996 [PubMed]
- 2. Chen W, Zheng R, Baade PD, Zhang S, Zeng H, Bray F, Jemal A, Yu XQ, He J. Cancer statistics in China, 2015. CA Cancer J Clin. 2016; 66:115–32. https://doi.org/10.3322/caac.21338 [PubMed]
- 3. Ferlay J, Soerjomataram I, Dikshit R, Eser S, Mathers C, Rebelo M, Parkin DM, Forman D, Bray F. Cancer incidence and mortality worldwide: sources, methods and major patterns in GLOBOCAN 2012. Int J Cancer. 2015; 136:E359–86. https://doi.org/10.1002/ijc.29210 [PubMed]
- 4. World Health Organization. World cancer report 2003. Kleihues P, Stewart BW, Editors. IARC Publications, 2003. https://publications.iarc.fr/Non-Series-Publications/World-Cancer-Reports/World-Cancer-Report-2003.
- 5. Corso G, Pedrazzani C, Pinheiro H, Fernandes E, Marrelli D, Rinnovati A, Pascale V, Seruca R, Oliveira C, Roviello F. E-cadherin genetic screening and clinico-pathologic characteristics of early onset gastric cancer. Eur J Cancer. 2011; 47:631–39. https://doi.org/10.1016/j.ejca.2010.10.011 [PubMed]
- 6. Bautista MC, Jiang SF, Armstrong MA, Postlethwaite D, Li D. Impact of age on clinicopathological features and survival of patients with noncardia gastric adenocarcinoma. J Gastric Cancer. 2014; 14:238–45. https://doi.org/10.5230/jgc.2014.14.4.238 [PubMed]
- 7. Sugimoto S, Yamada H, Takahashi M, Morohoshi Y, Yamaguchi N, Tsunoda Y, Hayashi H, Sugimura H, Komatsu H. Early-onset diffuse gastric cancer associated with a de novo large genomic deletion of CDH1 gene. Gastric Cancer. 2014; 17:745–49. https://doi.org/10.1007/s10120-013-0278-2 [PubMed]
- 8. Yanjun X, Wenming C, Lisha Y, Qi X, Jianmin G, Xinbao W, Xiangdong C, Jieer Y. Detection of CDH1 gene variants in early-onset diffuse gastric cancer in chinese patients. Clin Lab. 2014; 60:1823–30. https://doi.org/10.7754/clin.lab.2014.131211 [PubMed]
- 9. Shah MA, Salo-Mullen E, Stadler Z, Ruggeri JM, Mirander M, Pristyazhnyuk Y, Zhang L. De novo CDH1 mutation in a family presenting with early-onset diffuse gastric cancer. Clin Genet. 2012; 82:283–87. https://doi.org/10.1111/j.1399-0004.2011.01744.x [PubMed]
- 10. Cho SY, Park JW, Liu Y, Park YS, Kim JH, Yang H, Um H, Ko WR, Lee BI, Kwon SY, Ryu SW, Kwon CH, Park DY, et al. Sporadic early-onset diffuse gastric cancers have high frequency of somatic CDH1 alterations, but low frequency of somatic RHOA mutations compared with late-onset cancers. Gastroenterology. 2017; 153:536–49.e26. https://doi.org/10.1053/j.gastro.2017.05.012 [PubMed]
- 11. Bustos-Carpinteyro AR, Oliveira C, Sousa A, Oliveira P, Pinheiro H, Carvalho J, Magaña-Torres MT, Flores-Miramontes MG, Aguilar-Lemarroy A, Jave-Suárez LF, Peregrina-Sandoval J, Cruz-Ramos JA, Sánchez-López JY. CDH1 somatic alterations in mexican patients with diffuse and mixed sporadic gastric cancer. BMC Cancer. 2019; 19:69. https://doi.org/10.1186/s12885-019-5294-0 [PubMed]
- 12. Lai JF, Kim S, Li C, Oh SJ, Hyung WJ, Choi WH, Choi SH, Wang LB, Noh SH. Clinicopathologic characteristics and prognosis for young gastric adenocarcinoma patients after curative resection. Ann Surg Oncol. 2008; 15:1464–69. https://doi.org/10.1245/s10434-008-9809-1 [PubMed]
- 13. Gullo I, Devezas V, Baptista M, Garrido L, Castedo S, Morais R, Wen X, Rios E, Pinheiro J, Pinto-Ribeiro I, Ferreira RM, Preto J, Santos-Antunes J, et al. Phenotypic heterogeneity of hereditary diffuse gastric cancer: report of a family with early-onset disease. Gastrointest Endosc. 2018; 87:1566–75. https://doi.org/10.1016/j.gie.2018.02.008 [PubMed]
- 14. Mun DG, Bhin J, Kim S, Kim H, Jung JH, Jung Y, Jang YE, Park JM, Kim H, Jung Y, Lee H, Bae J, Back S, et al. Proteogenomic characterization of human early-onset gastric cancer. Cancer Cell. 2019; 35:111–24.e10. https://doi.org/10.1016/j.ccell.2018.12.003 [PubMed]
- 15. Bianchi L, Borghesi M, Schiavina R, Castellucci P, Ercolino A, Bianchi FM, Barbaresi U, Polverari G, Brunocilla E, Fanti S, Ceci F. Predictive accuracy and clinical benefit of a nomogram aimed to predict 68Ga-PSMA PET/CT positivity in patients with prostate cancer recurrence and PSA < 1 ng/ml external validation on a single institution database. Eur J Nucl Med Mol Imaging. 2020. [Epub ahead of print]. https://doi.org/10.1007/s00259-020-04696-z [PubMed]
- 16. Li M, Zhang J, Dan Y, Yao Y, Dai W, Cai G, Yang G, Tong T. A clinical-radiomics nomogram for the preoperative prediction of lymph node metastasis in colorectal cancer. J Transl Med. 2020; 18:46. https://doi.org/10.1186/s12967-020-02215-0 [PubMed]
- 17. Gittleman H, Sloan AE, Barnholtz-Sloan JS. An independently validated survival nomogram for lower-grade glioma. Neuro Oncol. 2020; 22:665–74. https://doi.org/10.1093/neuonc/noz191 [PubMed]
- 18. Wu S, Zheng J, Li Y, Yu H, Shi S, Xie W, Liu H, Su Y, Huang J, Lin T. A Radiomics Nomogram for the Preoperative Prediction of Lymph Node Metastasis in Bladder Cancer. Clin Cancer Res. 2017; 23:6904–6911. https://doi.org/10.1158/1078-0432.CCR-17-1510 [PubMed]
- 19. Wang C, Yang C, Wang W, Xia B, Li K, Sun F, Hou Y. A prognostic nomogram for cervical cancer after surgery from SEER database. J Cancer. 2018; 9:3923–28. https://doi.org/10.7150/jca.26220 [PubMed]
- 20. Yang L, Yang J, Zhou X, Huang L, Zhao W, Wang T, Zhuang J, Tian J. Development of a radiomics nomogram based on the 2D and 3D CT features to predict the survival of non-small cell lung cancer patients. Eur Radiol. 2019; 29:2196–206. https://doi.org/10.1007/s00330-018-5770-y [PubMed]
- 21. He Y, Zhu Z, Chen Y, Chen F, Wang Y, Ouyang C, Yang H, Huang M, Zhuang X, Mao R, Ben-Horin S, Wu X, Ouyang Q, et al. Development and validation of a novel diagnostic nomogram to differentiate between intestinal tuberculosis and crohn’s disease: a 6-year prospective multicenter study. Am J Gastroenterol. 2019; 114:490–99. https://doi.org/10.14309/ajg.0000000000000064 [PubMed]
- 22. Jiang Y, Yuan Q, Lv W, Xi S, Huang W, Sun Z, Chen H, Zhao L, Liu W, Hu Y, Lu L, Ma J, Li T, et al. Radiomic signature of 18 F fluorodeoxyglucose PET/CT for prediction of gastric cancer survival and chemotherapeutic benefits. Theranostics. 2018; 8:5915–28. https://doi.org/10.7150/thno.28018 [PubMed]
- 23. Yang Z, Gao Y, Fan X, Zhao X, Zhu S, Guo M, Liu Z, Yang X, Han Y. A multivariate prediction model for high Malignancy potential gastric GI stromal tumors before endoscopic resection. Gastrointest Endosc. 2020; 91:813–22. https://doi.org/10.1016/j.gie.2019.09.032 [PubMed]
- 24. Zhang Y, Liu X, Fan Y, Ding J, Xu A, Zhou X, Hu X, Zhu M, Zhang X, Li S, Wu J, Cao H, Li J, Wang Y. Germline mutations and polymorphic variants in MMR, e-cadherin and MYH genes associated with familial gastric cancer in jiangsu of China. Int J Cancer. 2006; 119:2592–96. https://doi.org/10.1002/ijc.22206 [PubMed]
- 25. Shin DH, Kim GH, Lee BE, Lee JW, Ha DW, Jeon HK, Baek DH, Song GA, Ahn SJ, Park DY. Clinicopathologic features of early gastric carcinoma with lymphoid stroma and feasibility of endoscopic submucosal dissection. Surg Endosc. 2017; 31:4156–64. https://doi.org/10.1007/s00464-017-5470-8 [PubMed]
- 26. Giryes A, Oweira H, Mannhart M, Decker M, Abdel-Rahman O. Exploring the differences between early-onset gastric cancer and traditional-onset gastric cancer. J Gastrointest Oncol. 2018; 9:1157–63. https://doi.org/10.21037/jgo.2018.06.11 [PubMed]
- 27. Park HJ, Ahn JY, Jung HY, Lim H, Lee JH, Choi KS, Kim DH, Choi KD, Song HJ, Lee GH, Kim JH. Clinical characteristics and outcomes for gastric cancer patients aged 18-30 years. Gastric Cancer. 2014; 17:649–60. https://doi.org/10.1007/s10120-013-0331-1 [PubMed]
- 28. Zhao B, Zhang J, Zhang J, Luo R, Wang Z, Xu H, Huang B. Assessment of the 8th edition of TNM staging system for gastric cancer: the results from the SEER and a single-institution database. Future Oncol. 2018; 14:3023–35. https://doi.org/10.2217/fon-2018-0299 [PubMed]
- 29. Mahar AL, Zagorski B, Kagedan D, Dixon M, El-Sedfy A, Vasilevska-Ristovska J, Cortinovis D, Rowsell C, Law C, Helyer L, Paszat L, Coburn N. Evaluating TNM stage prognostic ability in a population-based cohort of gastric adenocarcinoma patients in a low-incidence country. Can J Public Health. 2018; 109:480–88. https://doi.org/10.17269/s41997-018-0102-1 [PubMed]
- 30. Zhou YY, Kang YT, Chen C, Xu FF, Wang HN, Jin R. Combination of TNM staging and pathway based risk score models in patients with gastric cancer. J Cell Biochem. 2018; 119:3608–17. https://doi.org/10.1002/jcb.26563 [PubMed]
- 31. Kono Y, Kanzaki H, Tsuzuki T, Takatani M, Nasu J, Kawai D, Takenaka R, Tanaka T, Iwamuro M, Kawano S, Kawahara Y, Fujiwara T, Okada H. A multicenter observational study on the clinicopathological features of gastric cancer in young patients. J Gastroenterol. 2019; 54:419–26. https://doi.org/10.1007/s00535-018-1525-4 [PubMed]
- 32. Martin AM, Cagney DN, Catalano PJ, Warren LE, Bellon JR, Punglia RS, Claus EB, Lee EQ, Wen PY, Haas-Kogan DA, Alexander BM, Lin NU, Aizer AA. Brain metastases in newly diagnosed breast cancer: a population-based study. JAMA Oncol. 2017; 3:1069–77. https://doi.org/10.1001/jamaoncol.2017.0001 [PubMed]
- 33. Liu J, Geng Q, Liu Z, Chen S, Guo J, Kong P, Chen Y, Li W, Zhou Z, Sun X, Zhan Y, Xu D. Development and external validation of a prognostic nomogram for gastric cancer using the national cancer registry. Oncotarget. 2016; 7:35853–64. https://doi.org/10.18632/oncotarget.8221 [PubMed]
- 34. Bai Y, Li ZS. Endoscopic, clinicopathological features and prognosis of very young patients with gastric cancer. J Gastroenterol Hepatol. 2011; 26:1626–29. https://doi.org/10.1111/j.1440-1746.2011.06759.x [PubMed]
- 35. Yu C, Zhang Y. Development and validation of prognostic nomogram for young patients with gastric cancer. Ann Transl Med. 2019; 7:641. https://doi.org/10.21037/atm.2019.10.77 [PubMed]