


Introduction
Gastric cancer (GC) is the sixth most common cancer and the second most common cause of cancer-related deaths worldwide [1]. Surgical resection is the only curative treatment for GC. The most frequent age of GC onset is between 50 and 70 years. The factors associated with gastric carcinogenesis include Helicobacter pylori infection, Epstein-Barr virus infection, genetic mutations, and microsatellite instability (MSI). [2, 3].
A male predominance in upper gastrointestinal tract cancers, including esophageal cancer and GC, is observed in almost all populations, and the male gender is a well-established risk factor [4, 5]. Some possible reasons contributing to the different incidences between males and females include the protective effects of hormones in females, differences in body iron storage, and different dietary habits and lifestyles [6]. However, strong evidence explaining this difference in incidence is lacking.
It has been reported that in young GC patients, MSI is more common in females than males [7]. However, there is no significant difference in genetic mutations in hMLH3, BRAF, and KRAS between the sexes in young GC patients [7]. Programmed death-ligand 1 (PD-L1) expression is reportedly more common in males GC patients [8, 9]; however, a meta-analysis study showed no difference in PD-L1 expression between the sexes in GC [10]. In addition, other common GC-related genetic alterations exist, including PIK3CA amplifications and genetic mutations in the PI3K/AKT pathway, TP53, and ARID1A [3]. To date, whether differences exist in common GC-related genes between the sexes is still unclear.
The aim of the current study was to compare the clinicopathological features, recurrence patterns, prognoses, and genetic alterations in GC between the sexes after curative surgery.
Results
Clinicopathological features
Among the 2673 GC patients, 1979 (74.0%) were males. As shown in Table 1, the males were more likely to be older and have more tumors located in the upper stomach, more Borrmann type 3&4 tumors, more intestinal-type tumors, more lymphovascular invasion, more advanced pathological T category, and more pathological Tumor, Node, Metastasis (TNM) stage III tumors than the females.
Table 1. Clinical profile in GC patients before and after propensity matching according to different genders.
| Variables | Before propensity score matching | After propensity score matching | |||||||||||||||||||||||||||||||||||||||||||||||||||||||||||||||||||||||||||||||||||||||||||||||||
| Male n=1979 n (%) | Female n=694 n (%) | P value | Male n=423 n (%) | Female n=423 n (%) | P value | ||||||||||||||||||||||||||||||||||||||||||||||||||||||||||||||||||||||||||||||||||||||||||||||
| Age (years old) | <0.001 | 0.945 | |||||||||||||||||||||||||||||||||||||||||||||||||||||||||||||||||||||||||||||||||||||||||||||||||
| <65 | 551 (27.8) | 402 (57.9) | 185 (43.7) | 186 (44.0) | |||||||||||||||||||||||||||||||||||||||||||||||||||||||||||||||||||||||||||||||||||||||||||||||
| ≥65 | 1428 (72.2) | 292 (42.1) | 238 (56.3) | 237 (56.0) | |||||||||||||||||||||||||||||||||||||||||||||||||||||||||||||||||||||||||||||||||||||||||||||||
| Tumor size (cm) | 0.053 | 0.729 | |||||||||||||||||||||||||||||||||||||||||||||||||||||||||||||||||||||||||||||||||||||||||||||||||
| <5 | 1042 (52.7) | 395 (56.9) | 232 (54.8) | 237 (56.0) | |||||||||||||||||||||||||||||||||||||||||||||||||||||||||||||||||||||||||||||||||||||||||||||||
| ≥5 | 937 (47.3) | 299 (43.1) | 191 (45.2) | 186 (44.0) | |||||||||||||||||||||||||||||||||||||||||||||||||||||||||||||||||||||||||||||||||||||||||||||||
| Tumor location | <0.001 | 0.668 | |||||||||||||||||||||||||||||||||||||||||||||||||||||||||||||||||||||||||||||||||||||||||||||||||
| Upper stomach | 372 (18.8) | 86 (12.4) | 49 (11.6) | 60 (14.2) | |||||||||||||||||||||||||||||||||||||||||||||||||||||||||||||||||||||||||||||||||||||||||||||||
| Middle stomach | 676 (34.2) | 306 (44.1) | 165 (39.0) | 164 (38.8) | |||||||||||||||||||||||||||||||||||||||||||||||||||||||||||||||||||||||||||||||||||||||||||||||
| Lower stomach | 876 (44.3) | 290 (41.8) | 201 (47.5) | 193 (45.6) | |||||||||||||||||||||||||||||||||||||||||||||||||||||||||||||||||||||||||||||||||||||||||||||||
| Whole stomach | 55 (2.8) | 12 (1.7) | 8 (1.9) | 6 (1.4) | |||||||||||||||||||||||||||||||||||||||||||||||||||||||||||||||||||||||||||||||||||||||||||||||
| Gross appearance | <0.001 | 0.692 | |||||||||||||||||||||||||||||||||||||||||||||||||||||||||||||||||||||||||||||||||||||||||||||||||
| Superficial type | 696 (35.2) | 313 (45.1) | 181 (42.8) | 183 (43.3) | |||||||||||||||||||||||||||||||||||||||||||||||||||||||||||||||||||||||||||||||||||||||||||||||
| Borrmann type 1 | 90 (4.5) | 32 (4.6) | 11 (2.6) | 23 (5.4) | |||||||||||||||||||||||||||||||||||||||||||||||||||||||||||||||||||||||||||||||||||||||||||||||
| Borrmann type 2 | 321 (16.2) | 103 (14.8) | 63 (14.9) | 61 (14.4) | |||||||||||||||||||||||||||||||||||||||||||||||||||||||||||||||||||||||||||||||||||||||||||||||
| Borrmann type 3 | 730 (36.9) | 190 (27.4) | 142 (33.6) | 119 (28.1) | |||||||||||||||||||||||||||||||||||||||||||||||||||||||||||||||||||||||||||||||||||||||||||||||
| Borrmann type 4 | 142 (7.2) | 56 (8.1) | (6.1) | 37 (8.7) | |||||||||||||||||||||||||||||||||||||||||||||||||||||||||||||||||||||||||||||||||||||||||||||||
| Lauren’s classification | <0.001 | 0.449 | |||||||||||||||||||||||||||||||||||||||||||||||||||||||||||||||||||||||||||||||||||||||||||||||||
| Intestinal type | 1265 (63.9) | 283 (40.8) | 226 (53.4) | 215 (50.8) | |||||||||||||||||||||||||||||||||||||||||||||||||||||||||||||||||||||||||||||||||||||||||||||||
| Diffuse type | 714 (36.1) | 411 (59.2) | 197 (46.6) | 208 (49.2) | |||||||||||||||||||||||||||||||||||||||||||||||||||||||||||||||||||||||||||||||||||||||||||||||
| Lymphovascular invasion | 1152 (58.2) | 353 (50.9) | 0.001 | 222 (52.5) | 216 (51.1) | 0.680 | |||||||||||||||||||||||||||||||||||||||||||||||||||||||||||||||||||||||||||||||||||||||||||||
| Lymphoid stroma | 188 (9.5) | 51 (7.3) | 0.087 | 31 (7.3) | 32 (7.6) | 0.896 | |||||||||||||||||||||||||||||||||||||||||||||||||||||||||||||||||||||||||||||||||||||||||||||
| Adjuvant chemotherapy | 166 (8.4) | 82 (11.8) | 0.007 | 40 (9.5) | 42 (9.9) | 0.816 | |||||||||||||||||||||||||||||||||||||||||||||||||||||||||||||||||||||||||||||||||||||||||||||
| Pathological T category | <0.001 | 0.074 | |||||||||||||||||||||||||||||||||||||||||||||||||||||||||||||||||||||||||||||||||||||||||||||||||
| T1 | 612 (30.9) | 287 (41.4) | 153 (36.2) | 182 (43.0) | |||||||||||||||||||||||||||||||||||||||||||||||||||||||||||||||||||||||||||||||||||||||||||||||
| T2 | 313 (15.8) | 82 (11.8) | 65 (15.4) | 45 (10.7) | |||||||||||||||||||||||||||||||||||||||||||||||||||||||||||||||||||||||||||||||||||||||||||||||
| T3 | 525 (26.5) | 180 (25.9) | 101 (23.9) | 104 (24.6) | |||||||||||||||||||||||||||||||||||||||||||||||||||||||||||||||||||||||||||||||||||||||||||||||
| T4 | 529 (26.8) | 145 (20.9) | 104 (24.5) | 92 (21.7) | |||||||||||||||||||||||||||||||||||||||||||||||||||||||||||||||||||||||||||||||||||||||||||||||
| Pathological N category | 0.199 | 0.825 | |||||||||||||||||||||||||||||||||||||||||||||||||||||||||||||||||||||||||||||||||||||||||||||||||
| N0 | 938 (47.5) | 336 (48.4) | 209 (49.4) | 213 (50.4) | |||||||||||||||||||||||||||||||||||||||||||||||||||||||||||||||||||||||||||||||||||||||||||||||
| N1 | 269 (13.5) | 112 (16.1) | 66 (15.6) | 57 (13.5) | |||||||||||||||||||||||||||||||||||||||||||||||||||||||||||||||||||||||||||||||||||||||||||||||
| N2 | 315 (15.9) | 94 (13.6) | 59 (13.9) | 58 (13.7) | |||||||||||||||||||||||||||||||||||||||||||||||||||||||||||||||||||||||||||||||||||||||||||||||
| N3 | 457 (23.1) | 152 (21.9) | 89 (21.1) | 95 (22.4) | |||||||||||||||||||||||||||||||||||||||||||||||||||||||||||||||||||||||||||||||||||||||||||||||
| Pathological TNM Stage | 0.015 | 0.622 | |||||||||||||||||||||||||||||||||||||||||||||||||||||||||||||||||||||||||||||||||||||||||||||||||
| I | 764 (38.6) | 295 (42.5) | 177 (41.8) | 189 (44.7) | |||||||||||||||||||||||||||||||||||||||||||||||||||||||||||||||||||||||||||||||||||||||||||||||
| II | 428 (21.6) | 166 (23.9) | 97 (22.9) | 87 (20.6) | |||||||||||||||||||||||||||||||||||||||||||||||||||||||||||||||||||||||||||||||||||||||||||||||
| III | 787 (39.8) | 233 (33.6) | 149 (35.3) | 147 (34.7) | |||||||||||||||||||||||||||||||||||||||||||||||||||||||||||||||||||||||||||||||||||||||||||||||
| TNM: tumor, node, metastasis; bold: statistically significant. | |||||||||||||||||||||||||||||||||||||||||||||||||||||||||||||||||||||||||||||||||||||||||||||||||||
As shown in Table 1, after propensity-score matching at a 1: 1 ratio, 846 patients were enrolled for the subsequent analysis, including 423 males and 423 females. There is no significant difference in the clinicopathological features between the males and females (Table 1), and no difference was observed between the sexes in each TNM stage (Table 2).
Table 2. Clinical profile in GC patients between different sexes in stage I-III GC.
| Variables | Stage I | Stage II | Stage III | ||||||||
| Male n=177 n (%) | Female n=189 n (%) | P value | Male n=97 n (%) | Female n=87 n (%) | P value | Male n=149 n (%) | Female n=147 n (%) | P value | |||
| Age (years old) | 0.760 | 0.611 | 0.825 | ||||||||
| <65 | 74 (41.8) | 82 (43.4) | 46 (47.4) | 38 (43.7) | 65 (43.6) | 66 (44.9) | |||||
| >65 | 103 (58.2) | 107 (56.6) | 31 (52.6) | 49 (56.3) | 84 (56.4) | 81 (55.1) | |||||
| Tumor size (cm) | 0.764 | 0.215 | 0.425 | ||||||||
| <5 | 150 (84.7) | 158 (83.6) | 48 (49.5) | 51 (58.6) | 34 (22.8) | 28 (19.0) | |||||
| >5 | 27 (15.3) | 31 (16.4) | 49 (50.5) | 36 (41.4) | 115 (77.2) | 119 (81.0) | |||||
| Tumor location | 0.926 | 0.817 | 0.556 | ||||||||
| Upper stomach | 15 (8.5) | 18 (9.5) | 12 (12.4) | 11 (12.6) | 22 (14.8) | 31 (21.1) | |||||
| Middle stomach | 78 (44.1) | 84 (44.4) | 31 (32.0) | 27 (31.0) | 56 (37.6) | 53 (36.1) | |||||
| Lower stomach | 84 (47.5) | 87 (46.0) | 53 (54.6) | 49 (56.3) | 64 (43.0) | 57 (38.8) | |||||
| Whole stomach | 0 | 0 | 1 (1.0) | 0 | 7 (4.7) | 6 (4.1) | |||||
| Gross appearance | 0.599 | 0.279 | 0.240 | ||||||||
| Superficial type | 147 (83.1) | 150 (79.4) | 21 (21.6) | 25 (28.7) | 13 (8.7) | 8 (5.4) | |||||
| Borrmann type 1 | 5 (2.8) | 9 (4.8) | 3 (3.1) | 8 (9.2) | 3 (2.0) | 6 (4.1) | |||||
| Borrmann type 2 | 14 (5.1) | 14 (7.4) | 28 (28.9) | 22 (25.3) | 26 (17.4) | 25 (17.0) | |||||
| Baromann type 3 | 15 (8.5) | 14 (7.4) | 39 (40.2) | 27 (31.0) | 88 (59.1) | 78 (53.1) | |||||
| Borrmann type 4 | 1 (0.6) | 2 (1.1) | 6 (6.2) | 5 (5.7) | 19 (12.8) | 30 (20.4) | |||||
| Lauren’s classification | 0.715 | 0.138 | 0.460 | ||||||||
| Intestinal type | 111 (62.7) | 122 (64.6) | 53 (54.6) | 38 (43.7) | 62 (41.6) | 55 (37.4) | |||||
| Diffuse type | 66 (37.3) | 67 (35.4) | 44 (45.4) | 49 (56.3) | 87 (58.4) | 92 (62.6) | |||||
| Lymphovascular invasion | 25 (14.1) | 33 (17.5) | 0.382 | 60 (61.9) | 49 (56.3) | 0.446 | 137 (91.9) | 134 (91.2) | |||
| Lymphoid stroma | 11 (6.2) | 11 (5.8) | 0.874 | 9 (9.3) | 8 (9.2) | 0.985 | 11 (7.4) | 13 (8.8) | 0.645 | ||
| Adjuvant chemotherapy | 0 | 0 | - | 8 (8.2) | 8 (9.2) | 0.820 | 32 (21.5) | 34 (23.1) | 0.733 | ||
| Pathological T category | 0.114 | 0.086 | 0.476 | ||||||||
| T1 | 145 (81.9) | 166 (87.8) | 7 (7.2) | 16 (18.4) | 1 (0.7) | 0 | |||||
| T2 | 32 (18.1) | 23 (12.2) | 29 (29.9) | 17 (19.5) | 4 (2.7) | 5 (3.4) | |||||
| T3 | 0 | 0 | 43 (44.3) | 37 (42.5) | 58 (38.9) | 67 (45.6) | |||||
| T4 | 0 | 0 | 18 (18.6) | 17 (19.5) | 86 (57.7) | 75 (51.0) | |||||
| Pathological N category | 0.410 | 0.632 | 0.458 | ||||||||
| N0 | 166 (93.8) | 173 (91.5) | 40 (41.2) | 38 (43.7) | 3 (2.0) | 2 (1.4) | |||||
| N1 | 11 (6.2) | 16 (8.5) | 34 (35.1) | 25 (28.7) | 21 (14.1) | 16 (10.9) | |||||
| N2 | 0 | 0 | 23 (23.7) | 20 (23.0) | 36 (24.2) | 38 (25.9) | |||||
| N3 | 0 | 0 | 0 | 4 (4.6) | 89 (59.7) | 91 (61.9) | |||||
Initial recurrence patterns
The mean follow-up time was 91.9 months, which was similar between males and females (91.5 vs. 92.4 months, P=0.875). The longest follow-up time was 344.6 months. Among the 846 patients, 207 patients (24.5%) had tumor recurrence during follow-up; 445 patients died during follow-up, and 49 patients (5.8%) had follow-up time shorter than 3 years; among them, there were 22 stage I diseases, 13 stage II diseases, and 14 stage III diseases. Among the 49 patients, four patients had tumor recurrence, including three patients with stage III diseases and one patient with stage II disease.
As shown in Table 3, the males were more likely to develop tumor recurrence, distant metastases, and liver metastases than the females. In stage I GC, the males were more likely to develop tumor recurrence than the females. In stage II GC, there was no difference in the initial recurrence patterns between the sexes. In stage III GC, the males were more likely to develop tumor recurrence and liver metastases than the females.
Table 3. The initial recurrence pattern between different genders in stage I-III GC patients after propensity score matching.
| Initial recurrence pattern | All GC | Stage I GC | Stage II GC | Stage III GC | |||||||||||||||||||||||||||||||||||||||||||||||||||||||||||||||||||||||||||||||||||||||||||||||
| Male n=423 n (%) | Female n=423 n (%) | P value | Male n=177 n (%) | Female n=189 n (%) | P value | Male n=97 n (%) | Female n=87 n (%) | P value | Male n=149 n (%) | Female n=147 n (%) | P value | ||||||||||||||||||||||||||||||||||||||||||||||||||||||||||||||||||||||||||||||||||||||||
| Total patients with recurrence | 118 (27.9) | 89 (21.0) | 0.020 | 19 (10.7) | 9 (4.8) | 0.032 | 19 (19.6) | 18 (20.7) | 0.852 | 80 (53.7) | 62 (42.2) | 0.047 | |||||||||||||||||||||||||||||||||||||||||||||||||||||||||||||||||||||||||||||||||||||||
| Locoregional recurrence | 53 (12.5) | 38 (9.0) | 0.096 | 8 (4.5) | 4 (2.1) | 0.197 | 9 (9.3) | 8 (9.2) | 0.985 | 36 (24.2) | 26 (17.7) | 0.171 | |||||||||||||||||||||||||||||||||||||||||||||||||||||||||||||||||||||||||||||||||||||||
| Distant metastasis | 98 (23.2) | 75 (17.7) | 0.030 | 11 (6.2) | 6 (3.2) | 0.167 | 16 (16.5) | 15 (17.2) | 0.893 | 71 (47.7) | 54 (36.7) | 0.057 | |||||||||||||||||||||||||||||||||||||||||||||||||||||||||||||||||||||||||||||||||||||||
| Peritoneal dissemination | 45 (10.6) | 41 (9.7) | 0.649 | 1 (0.6) | 3 (1.6) | 0.347 | 7 (7.2) | 8 (9.2) | 0.624 | 37 (24.8) | 30 (20.4) | 0.363 | |||||||||||||||||||||||||||||||||||||||||||||||||||||||||||||||||||||||||||||||||||||||
| Hematogenous metastasis | 61 (14.4) | 26 (6.1) | <0.001 | 9 (5.1) | 3 (1.6) | 0.060 | 10 (10.3) | 5 (5.7) | 0.259 | 42 (28.2) | 18 (12.2) | 0.001 | |||||||||||||||||||||||||||||||||||||||||||||||||||||||||||||||||||||||||||||||||||||||
| Liver | 40 (9.5) | 16 (3.8) | 0.001 | 4 (2.6) | 1 (0.5) | 0.154 | 7 (7.2) | 3 (3.4) | 0.260 | 29 (19.5) | 12 (8.2) | 0.005 | |||||||||||||||||||||||||||||||||||||||||||||||||||||||||||||||||||||||||||||||||||||||
| Lung | 7 (1.7) | 5 (1.2) | 0.561 | 2 (1.1) | 1 (0.5) | 0.524 | 1 (1.0) | 1 (1.1) | 0.938 | 4 (2.7) | 3 (2.0) | 0.716 | |||||||||||||||||||||||||||||||||||||||||||||||||||||||||||||||||||||||||||||||||||||||
| Bone | 13 (3.1) | 7 (1.7) | 0.175 | 4 (2.6) | 1 (0.5) | 0.154 | 2 (2.1) | 2 (2.3) | 0.912 | 7 (4.7) | 4 (2.7) | 0.369 | |||||||||||||||||||||||||||||||||||||||||||||||||||||||||||||||||||||||||||||||||||||||
| Brain | 5 (1.2) | 0 | 0.062 | 0 | 0 | - | 1 (1.0) | 0 | 0.342 | 4 (2.7) | 0 | 0.122 | |||||||||||||||||||||||||||||||||||||||||||||||||||||||||||||||||||||||||||||||||||||||
| Adrenal | 1 (0.2) | 2 (0.5) | 0.563 | 0 | 0 | - | 0 | 0 | - | 1 (0.7) | 2 (1.4) | 0.554 | |||||||||||||||||||||||||||||||||||||||||||||||||||||||||||||||||||||||||||||||||||||||
| Skin | 0 | 0 | - | 0 | 0 | - | 0 | 0 | - | 0 | 0 | - | |||||||||||||||||||||||||||||||||||||||||||||||||||||||||||||||||||||||||||||||||||||||
| Distant lymphatic recurrence | 23 (5.4) | 22 (5.2) | 0.878 | 1 (0.6) | 1 (0.5) | 0.963 | 1 (1.0) | 4 (4.6) | 0.137 | 21 (14.1) | 17 (11.6) | 0.515 | |||||||||||||||||||||||||||||||||||||||||||||||||||||||||||||||||||||||||||||||||||||||
| Some patients had more than one recurrence pattern; bold: statistically significant. | |||||||||||||||||||||||||||||||||||||||||||||||||||||||||||||||||||||||||||||||||||||||||||||||||||
Survival analysis
As shown in Figure 1, the males had significantly lower 5-year overall survival (OS) (60.9% vs. 64.0%, P=0.030, Figure 1A) and disease-free survival (DFS) (56.9% vs. 62.0%, P=0.015, Figure 1B) rates than the females. As shown in Figure 2, in stage I GC, the males had significantly lower 5-year OS (85.9% vs. 90.5%, P=0.047, Figure 2A) and DFS (83.6% vs. 88.8%, P=0.032, Figure 2B) rates than the females. In stage II GC, there was no significant difference in the OS (69.9% vs. 71.2%, P=0.526, Figure 2C) and DFS (65.0% vs. 66.7%, P=0.557, Figure 2D) rates between the sexes. In stage III GC, there was no significant difference in the OS (25.1% vs. 25.6%, P=0.436, Figure 2E) and DFS (19.8% vs. 24.2%, P=0.268, Figure 2F) rates between the sexes.
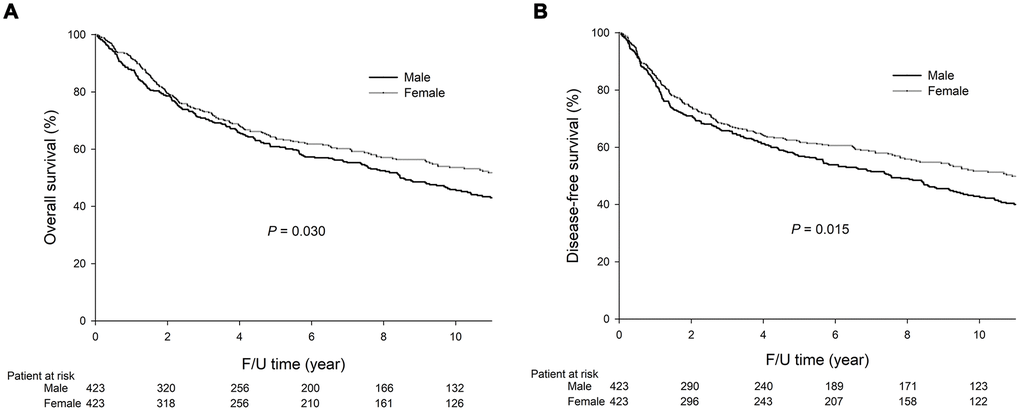
Figure 1. The 5-year OS (60.9% vs. 64.0%, P=0.030) and DFS (56.9% vs. 62.0%, P=0.015) rates were significantly lower in the males than the females. The survival curves are shown as follows: (A) OS curves of GC patients; (B) DFS curves of GC patients.
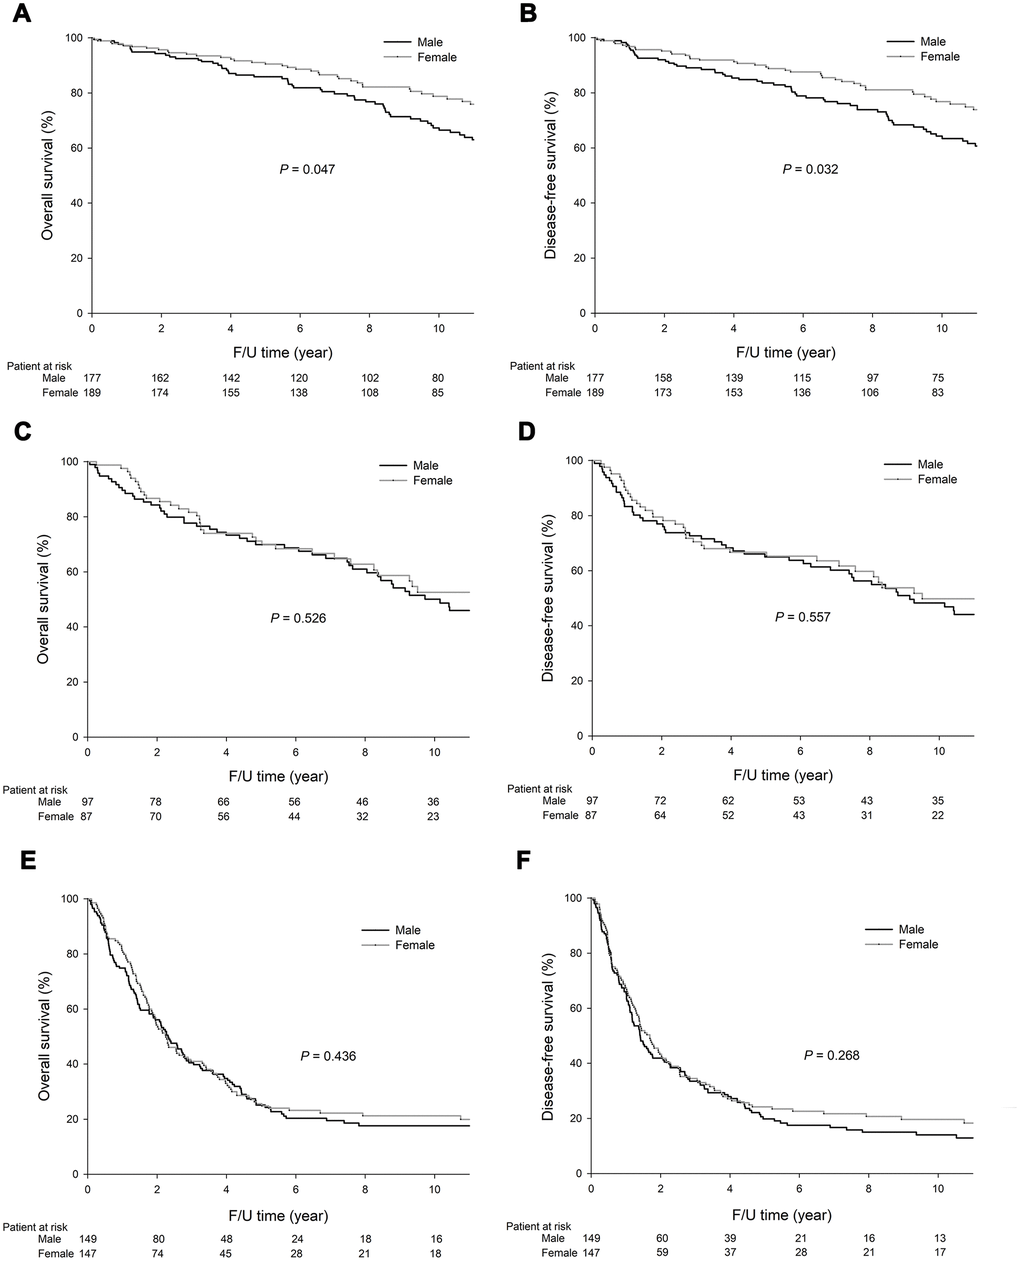
Figure 2. Among the stage I GC patients, the 5-year OS (85.9% vs. 90.5%, P=0.047) and DFS (83.6% vs. 88.8%, P=0.032) rates were significantly lower in the males than the females. Among the stage II GC patients, the 5-year OS (69.9% vs. 71.2%, P=0.526) and DFS (65.0% vs. 66.7%, P=0.557) rates did significantly differ between the males and females. Among the stage III GC patients, the 5-year OS (25.1% vs. 25.6%, P=0.436) and DFS (19.8% vs. 24.2%, P=0.268) rates did not significantly differ between the males and females. The survival curves are shown as follows: (A) OS curves of stage I GC patients; (B) DFS curves of stage I GC patients; (C) OS curves of stage II GC patients; (D) DFS curves of stage II GC patients; (E) OS curves of stage III GC patients; and (F) DFS curves of stage III GC patients.
As shown in Tables 4 and 5, the univariate analysis demonstrated that age, gender, tumor location, gross appearance, adjuvant chemotherapy, lymphovascular invasion, and pathological T and N categories were associated with OS and DFS. The aforementioned eight variables were included in a multivariate Cox proportional hazards model to adjust for the effects of covariates. The multivariate analysis demonstrated that age, gender, gross appearance, and pathological T and N categories were independent prognostic factors affecting OS and DFS.
Table 4. Univariate and multivariate analysis of factors affecting OS of GC patients after curative surgery.
| Variables | Univariate analysis | Multivariate analysis | |||||||||||||||||||||||||||||||||||||||||||||||||||||||||||||||||||||||||||||||||||||||||||||||||
| HR | 95%CI | P value | HR | 95%CI | P value | ||||||||||||||||||||||||||||||||||||||||||||||||||||||||||||||||||||||||||||||||||||||||||||||
| Age (years old) | <0.001 | <0.001 | |||||||||||||||||||||||||||||||||||||||||||||||||||||||||||||||||||||||||||||||||||||||||||||||||
| < 65 | 1.00 | 1.00 | |||||||||||||||||||||||||||||||||||||||||||||||||||||||||||||||||||||||||||||||||||||||||||||||||
| ≥65 | 1.78 | 1.459-2.163 | 1.90 | 1.551-2.321 | |||||||||||||||||||||||||||||||||||||||||||||||||||||||||||||||||||||||||||||||||||||||||||||||
| Gender | 0.030 | 0.042 | |||||||||||||||||||||||||||||||||||||||||||||||||||||||||||||||||||||||||||||||||||||||||||||||||
| Male | 1.00 | 1.00 | |||||||||||||||||||||||||||||||||||||||||||||||||||||||||||||||||||||||||||||||||||||||||||||||||
| Female | 0.81 | 0.675-0.980 | 0.82 | 0.674-0.993 | |||||||||||||||||||||||||||||||||||||||||||||||||||||||||||||||||||||||||||||||||||||||||||||||
| Tumor location | <0.001 | 0.131 | |||||||||||||||||||||||||||||||||||||||||||||||||||||||||||||||||||||||||||||||||||||||||||||||||
| Upper stomach | 1.00 | 1.00 | |||||||||||||||||||||||||||||||||||||||||||||||||||||||||||||||||||||||||||||||||||||||||||||||||
| Middle stomach | 0.63 | 0.469-0.841 | 0.71 | 0.526-0.961 | |||||||||||||||||||||||||||||||||||||||||||||||||||||||||||||||||||||||||||||||||||||||||||||||
| Lower stomach | 0.76 | 0.574-0.999 | 0.82 | 0.616-1.091 | |||||||||||||||||||||||||||||||||||||||||||||||||||||||||||||||||||||||||||||||||||||||||||||||
| Whole stomach | 2.85 | 1.568-5.187 | 1.03 | 0.542-1.947 | |||||||||||||||||||||||||||||||||||||||||||||||||||||||||||||||||||||||||||||||||||||||||||||||
| Gross appearance | <0.001 | 0.003 | |||||||||||||||||||||||||||||||||||||||||||||||||||||||||||||||||||||||||||||||||||||||||||||||||
| Superficial type | 1.00 | 1.00 | |||||||||||||||||||||||||||||||||||||||||||||||||||||||||||||||||||||||||||||||||||||||||||||||||
| Bormann type 1 | 2.07 | 1.278-3.351 | 1.30 | 0.776-2.176 | |||||||||||||||||||||||||||||||||||||||||||||||||||||||||||||||||||||||||||||||||||||||||||||||
| Bormann type 2 | 2.01 | 1.486-2.716 | 0.88 | 0.599-1.292 | |||||||||||||||||||||||||||||||||||||||||||||||||||||||||||||||||||||||||||||||||||||||||||||||
| Bormann type 3 | 3.34 | 2.668-4.183 | 1.42 | 1.017-1.978 | |||||||||||||||||||||||||||||||||||||||||||||||||||||||||||||||||||||||||||||||||||||||||||||||
| Bormann type 4 | 4.98 | 3.502-7.067 | 1.82 | 1.155-2.873 | |||||||||||||||||||||||||||||||||||||||||||||||||||||||||||||||||||||||||||||||||||||||||||||||
| Lymphovascular invasion | <0.001 | 0.174 | |||||||||||||||||||||||||||||||||||||||||||||||||||||||||||||||||||||||||||||||||||||||||||||||||
| Absent | 1.00 | 1.00 | |||||||||||||||||||||||||||||||||||||||||||||||||||||||||||||||||||||||||||||||||||||||||||||||||
| Present | 2.86 | 2.342-3.495 | 1.21 | 0.920-1.591 | |||||||||||||||||||||||||||||||||||||||||||||||||||||||||||||||||||||||||||||||||||||||||||||||
| Lauren’s classification | 0.263 | ||||||||||||||||||||||||||||||||||||||||||||||||||||||||||||||||||||||||||||||||||||||||||||||||||
| Intestinal type | 1.00 | ||||||||||||||||||||||||||||||||||||||||||||||||||||||||||||||||||||||||||||||||||||||||||||||||||
| Diffuse type | 1.11 | 0.923-1.340 | |||||||||||||||||||||||||||||||||||||||||||||||||||||||||||||||||||||||||||||||||||||||||||||||||
| Adjuvant chemotherapy | <0.001 | 0.581 | |||||||||||||||||||||||||||||||||||||||||||||||||||||||||||||||||||||||||||||||||||||||||||||||||
| No | 1.00 | 1.00 | |||||||||||||||||||||||||||||||||||||||||||||||||||||||||||||||||||||||||||||||||||||||||||||||||
| Yes | 2.00 | 1.473-2.731 | 0.91 | 0.640-1.285 | |||||||||||||||||||||||||||||||||||||||||||||||||||||||||||||||||||||||||||||||||||||||||||||||
| Pathological T category | <0.001 | <0.001 | |||||||||||||||||||||||||||||||||||||||||||||||||||||||||||||||||||||||||||||||||||||||||||||||||
| T1 | 1.00 | 1.00 | |||||||||||||||||||||||||||||||||||||||||||||||||||||||||||||||||||||||||||||||||||||||||||||||||
| T2 | 1.37 | 0.978-1.912 | 0.94 | 0.635-1.396 | |||||||||||||||||||||||||||||||||||||||||||||||||||||||||||||||||||||||||||||||||||||||||||||||
| T3 | 3.38 | 2.619-4.358 | 1.63 | 1.099-2.415 | |||||||||||||||||||||||||||||||||||||||||||||||||||||||||||||||||||||||||||||||||||||||||||||||
| T4 | 4.53 | 3.531-5.806 | 1.89 | 1.268-2.809 | |||||||||||||||||||||||||||||||||||||||||||||||||||||||||||||||||||||||||||||||||||||||||||||||
| Pathological N category | <0.001 | <0.001 | |||||||||||||||||||||||||||||||||||||||||||||||||||||||||||||||||||||||||||||||||||||||||||||||||
| N0 | 1.00 | 1.00 | |||||||||||||||||||||||||||||||||||||||||||||||||||||||||||||||||||||||||||||||||||||||||||||||||
| N1 | 1.46 | 1.086-1.957 | 1.03 | 0.743-1.425 | |||||||||||||||||||||||||||||||||||||||||||||||||||||||||||||||||||||||||||||||||||||||||||||||
| N2 | 2.36 | 1.775-3.143 | 1.53 | 1.106-2.119 | |||||||||||||||||||||||||||||||||||||||||||||||||||||||||||||||||||||||||||||||||||||||||||||||
| N3 | 6.67 | 5.285-8.429 | 3.47 | 2.532-4.766 | |||||||||||||||||||||||||||||||||||||||||||||||||||||||||||||||||||||||||||||||||||||||||||||||
| OS: overall survival; DFS: disease-free survival; bold: statistically significant. | |||||||||||||||||||||||||||||||||||||||||||||||||||||||||||||||||||||||||||||||||||||||||||||||||||
Table 5. Univariate and multivariate analysis of factors affecting DFS of GC patients after curative surgery.
| Variables | Univariate analysis | Multivariate analysis | |||||||||||||||||||||||||||||||||||||||||||||||||||||||||||||||||||||||||||||||||||||||||||||||||
| HR | 95%CI | P value | HR | 95%CI | P value | ||||||||||||||||||||||||||||||||||||||||||||||||||||||||||||||||||||||||||||||||||||||||||||||
| Age (years old) | <0.001 | <0.001 | |||||||||||||||||||||||||||||||||||||||||||||||||||||||||||||||||||||||||||||||||||||||||||||||||
| < 65 | 1.00 | 1.00 | |||||||||||||||||||||||||||||||||||||||||||||||||||||||||||||||||||||||||||||||||||||||||||||||||
| ≥65 | 1.75 | 1.443-2.120 | 1.85 | 1.517-2.250 | |||||||||||||||||||||||||||||||||||||||||||||||||||||||||||||||||||||||||||||||||||||||||||||||
| Gender | 0.015 | 0.018 | |||||||||||||||||||||||||||||||||||||||||||||||||||||||||||||||||||||||||||||||||||||||||||||||||
| Male | 1.00 | 1.00 | |||||||||||||||||||||||||||||||||||||||||||||||||||||||||||||||||||||||||||||||||||||||||||||||||
| Female | 0.80 | 0.664-0.957 | 0.80 | 0.659-0.961 | |||||||||||||||||||||||||||||||||||||||||||||||||||||||||||||||||||||||||||||||||||||||||||||||
| Tumor location | <0.001 | 0.054 | |||||||||||||||||||||||||||||||||||||||||||||||||||||||||||||||||||||||||||||||||||||||||||||||||
| Upper stomach | 1.00 | 1.00 | |||||||||||||||||||||||||||||||||||||||||||||||||||||||||||||||||||||||||||||||||||||||||||||||||
| Middle stomach | 0.61 | 0.459-0.812 | 0.68 | 0.507-0.915 | |||||||||||||||||||||||||||||||||||||||||||||||||||||||||||||||||||||||||||||||||||||||||||||||
| Lower stomach | 0.74 | 0.561-0.965 | 0.84 | 0.634-1.111 | |||||||||||||||||||||||||||||||||||||||||||||||||||||||||||||||||||||||||||||||||||||||||||||||
| Whole stomach | 2.78 | 1.534-5.047 | 0.97 | 0.513-1.835 | |||||||||||||||||||||||||||||||||||||||||||||||||||||||||||||||||||||||||||||||||||||||||||||||
| Gross appearance | <0.001 | 0.004 | |||||||||||||||||||||||||||||||||||||||||||||||||||||||||||||||||||||||||||||||||||||||||||||||||
| Superficial type | 1.00 | 1.00 | |||||||||||||||||||||||||||||||||||||||||||||||||||||||||||||||||||||||||||||||||||||||||||||||||
| Bormann type 1 | 1.95 | 1.208-3.155 | 1.29 | 0.772-2.142 | |||||||||||||||||||||||||||||||||||||||||||||||||||||||||||||||||||||||||||||||||||||||||||||||
| Bormann type 2 | 2.00 | 1.491-2.686 | 0.90 | 0.620-1.306 | |||||||||||||||||||||||||||||||||||||||||||||||||||||||||||||||||||||||||||||||||||||||||||||||
| Bormann type 3 | 3.35 | 2.688-4.174 | 1.42 | 1.026-1.963 | |||||||||||||||||||||||||||||||||||||||||||||||||||||||||||||||||||||||||||||||||||||||||||||||
| Bormann type 4 | 5.00 | 3.572-7.006 | 1.76 | 1.134-2.737 | |||||||||||||||||||||||||||||||||||||||||||||||||||||||||||||||||||||||||||||||||||||||||||||||
| Lymphovascular invasion | <0.001 | 0.149 | |||||||||||||||||||||||||||||||||||||||||||||||||||||||||||||||||||||||||||||||||||||||||||||||||
| Absent | 1.00 | 1.00 | |||||||||||||||||||||||||||||||||||||||||||||||||||||||||||||||||||||||||||||||||||||||||||||||||
| Present | 2.92 | 2.404-3.556 | 1.22 | 0.931-1.602 | |||||||||||||||||||||||||||||||||||||||||||||||||||||||||||||||||||||||||||||||||||||||||||||||
| Lauren’s classification | 0.351 | ||||||||||||||||||||||||||||||||||||||||||||||||||||||||||||||||||||||||||||||||||||||||||||||||||
| Intestinal type | 1.00 | ||||||||||||||||||||||||||||||||||||||||||||||||||||||||||||||||||||||||||||||||||||||||||||||||||
| Diffuse type | 1.09 | 0.909-1.309 | |||||||||||||||||||||||||||||||||||||||||||||||||||||||||||||||||||||||||||||||||||||||||||||||||
| Adjuvant chemotherapy | <0.001 | 0.796 | |||||||||||||||||||||||||||||||||||||||||||||||||||||||||||||||||||||||||||||||||||||||||||||||||
| No | 1.00 | 1.00 | |||||||||||||||||||||||||||||||||||||||||||||||||||||||||||||||||||||||||||||||||||||||||||||||||
| Yes | 2.27 | 1.702-3.026 | 1.05 | 0.748-1.461 | |||||||||||||||||||||||||||||||||||||||||||||||||||||||||||||||||||||||||||||||||||||||||||||||
| Pathological T category | <0.001 | <0.001 | |||||||||||||||||||||||||||||||||||||||||||||||||||||||||||||||||||||||||||||||||||||||||||||||||
| T1 | 1.00 | 1.00 | |||||||||||||||||||||||||||||||||||||||||||||||||||||||||||||||||||||||||||||||||||||||||||||||||
| T2 | 1.34 | 0.962-1.859 | 0.90 | 0.610-1.322 | |||||||||||||||||||||||||||||||||||||||||||||||||||||||||||||||||||||||||||||||||||||||||||||||
| T3 | 3.32 | 2.588-4.251 | 1.50 | 1.021-2.203 | |||||||||||||||||||||||||||||||||||||||||||||||||||||||||||||||||||||||||||||||||||||||||||||||
| T4 | 4.67 | 3.668-5.954 | 1.95 | 1.329-2.874 | |||||||||||||||||||||||||||||||||||||||||||||||||||||||||||||||||||||||||||||||||||||||||||||||
| Pathological N category | <0.001 | <0.001 | |||||||||||||||||||||||||||||||||||||||||||||||||||||||||||||||||||||||||||||||||||||||||||||||||
| N0 | 1.00 | 1.00 | |||||||||||||||||||||||||||||||||||||||||||||||||||||||||||||||||||||||||||||||||||||||||||||||||
| N1 | 1.50 | 1.128-2.006 | 1.07 | 0.778-1.476 | |||||||||||||||||||||||||||||||||||||||||||||||||||||||||||||||||||||||||||||||||||||||||||||||
| N2 | 2.41 | 1.821-3.179 | 1.53 | 1.116-2.107 | |||||||||||||||||||||||||||||||||||||||||||||||||||||||||||||||||||||||||||||||||||||||||||||||
| N3 | 6.91 | 5.491-8.691 | 3.55 | 2.599-4.859 | |||||||||||||||||||||||||||||||||||||||||||||||||||||||||||||||||||||||||||||||||||||||||||||||
| OS: overall survival; DFS: disease-free survival; bold: statistically significant. | |||||||||||||||||||||||||||||||||||||||||||||||||||||||||||||||||||||||||||||||||||||||||||||||||||
Analysis of genetic alterations
Genetic alterations were analyzed in 438 GC patients with available GC tissues. As shown in Table 6, the males had higher PD-L1 expression than the females (31.1% vs. 20.2%, P=0.020). Patients aged 65 years or older had higher PD-L1 expression than those younger than 65 years (33.1% vs. 20.8%, P=0.005).
Table 6. The molecular differences between genders in GC patients after curative surgery.
| All GC | Stage I GC | Stage II GC | Stage III GC | ||||||||||||||||||||||||||||||||||||||||||||||||||||||||||||||||||||||||||||||||||||||||||||||||
| Male n=309 n (%) | Female n=129 n (%) | P value | Male n=49 n (%) | Female n=39 n (%) | P value | Male n=90 n (%) | Female n=35 n (%) | P value | Male n=170 n (%) | Female n=55 n (%) | P value | ||||||||||||||||||||||||||||||||||||||||||||||||||||||||||||||||||||||||||||||||||||||||
| MSI status | 0.355 | 0.033 | 0.106 | 0.115 | |||||||||||||||||||||||||||||||||||||||||||||||||||||||||||||||||||||||||||||||||||||||||||||||
| MSI-L/S | 284 (91.9) | 116 (89.1) | 47 (95.9) | 32 (82.1) | 85 (94.4) | 30 (85.7) | 152 (89.4) | 53 (96.4) | |||||||||||||||||||||||||||||||||||||||||||||||||||||||||||||||||||||||||||||||||||||||||||
| MSI-H | 25 (8.1) | 14 (10.9) | 2 (4.1) | 7 (17.9) | 5 (5.6) | 5 (14.3) | 18 (10.6) | 2 (3.6) | |||||||||||||||||||||||||||||||||||||||||||||||||||||||||||||||||||||||||||||||||||||||||||
| PD-L1 expression | 96 (31.1) | 26 (20.2) | 0.020 | 14 (28.6) | 8 (20.5) | 0.386 | 28 (31.1) | 9 (25.7) | 0.553 | 53 (31.2) | 9 (16.4) | 0.033 | |||||||||||||||||||||||||||||||||||||||||||||||||||||||||||||||||||||||||||||||||||||||
| PIK3CA amplification | 137 (44.3) | 69 (53.5) | 0.080 | 20 (40.8) | 19 (48.7) | 0.459 | 39 (43.3) | 19 (54.3) | 0.270 | 78 (45.9) | 31 (56.4) | 0.176 | |||||||||||||||||||||||||||||||||||||||||||||||||||||||||||||||||||||||||||||||||||||||
| Genetic mutations | |||||||||||||||||||||||||||||||||||||||||||||||||||||||||||||||||||||||||||||||||||||||||||||||||||
| PI3K/AKT pathway | 54 (17.5) | 16 (12.4) | 0.182 | 8 (16.3) | 4 (10.3) | 0.410 | 15 (16.7) | 5 (14.3) | 0.744 | 31 (18.3) | 7 (12.7) | 0.335 | |||||||||||||||||||||||||||||||||||||||||||||||||||||||||||||||||||||||||||||||||||||||
| TP53 | 42 (13.6) | 20 (15.5) | 0.601 | 6 (12.2) | 7 (17.9) | 0.454 | 11 (12.2) | 1 (2.9) | 0.111 | 25 (14.7) | 12 (21.8) | 0.216 | |||||||||||||||||||||||||||||||||||||||||||||||||||||||||||||||||||||||||||||||||||||||
| ARID1A | 42 (13.6) | 10 (7.8) | 0.085 | 7 (14.3) | 4 (10.3) | 0.570 | 13 (14.4) | 2 (5.7) | 0.177 | 22 (12.9) | 4 (7.3) | 0.253 | |||||||||||||||||||||||||||||||||||||||||||||||||||||||||||||||||||||||||||||||||||||||
| BRAF | 2 (0.6) | 0 | 0.360 | 1 (2.0) | 0 | 0.370 | 1 (1.1) | 0 | 0.531 | 0 | 0 | - | |||||||||||||||||||||||||||||||||||||||||||||||||||||||||||||||||||||||||||||||||||||||
| KRAS | 4 (1.3) | 6 (4.7) | 0.071 | 2 (4.1) | 2 (5.1) | 0.815 | 2 (2.2) | 2 (5.7) | 0.319 | 0 | 2 (3.6) | 0.059 | |||||||||||||||||||||||||||||||||||||||||||||||||||||||||||||||||||||||||||||||||||||||
| MSI: microsatellite instability; MSI-H: MSI-high; MSI-L/S: MSI-low/stable; bold: statistically significant. | |||||||||||||||||||||||||||||||||||||||||||||||||||||||||||||||||||||||||||||||||||||||||||||||||||
In stage I GC, the females were more likely to have MSI-H tumors than the males (17.9% vs. 4.1%, P=0.033). In stage III GC, the males were more likely to exhibit PD-L1 expression than the females (31.2% vs. 16.4%, P=0.033). Among the 225 stage III GC, the patients aged 65 years or older were more likely to exhibit PD-L1 expression than the patients younger than 65 years (29% vs. 14.9%, P=0.013).
Among the 438 patients, forty-five (10.3%) patients, including 39 males and 6 females, developed liver metastases. Among these 45 patients with liver metastases, 16 (35.6%) patients had PD-L1 expression; 14 of these patients (14/16, 87.5%) were males, and 12 of the 14 (85.7%) males were aged 65 years or older.
Discussion
To minimize selection bias, we performed propensity-score matching and analyzed the clinicopathological feature differences between the sexes in our GC patients. Our results demonstrate that the males are associated with more tumor recurrence, more liver metastasis, and worse prognoses than the females with GC. In addition, the molecular analysis demonstrated that PD-L1 expression was more common among the aged male patients, especially those with stage III GC. Among the patients with liver metastases, PD-L1 expression was more common among the aged male patients.
In the present study, sex was one of the independent prognostic factors of OS and DFS. Although gross appearance and pathological T and N categories were significantly related to each other, all of the five independent prognostic factors were still significantly associated with OS and DFS by multivariate analysis. It seems that all the five factors play an important role in GC patient prognosis.
A meta-analysis [11] showed that MSI-H GC was associated with females, an older age, and intestinal-type GC. In the present study, a significantly higher tumor recurrence rate and a significantly higher frequency of MSI-H tumors was observed in the females than the males (17.9% vs. 4.1%, P=0.003) in stage I GC only. MSI-H tumors were associated with a better prognosis than MSI-L/S tumors in GC [12]. The reason why the males were associated with a worse prognosis than the females in stage I GC is possibly due to a higher tumor recurrence rate and fewer MSI-H tumors in the males than females. In stage III GC, although the male patients had more tumor recurrence and liver metastases than the female patients, the OS and DFS rates did not significantly differ between the sexes. A possible reason is that the tumor recurrence rates are high in stage III GC, with 53.7% in males and 42.2% in females. In addition, the OS (25.1% vs. 25.6%, P=0.436) and DFS (19.8% vs. 24.2%, P=0.268) rates were relatively low in both the males and females, resulting in no significant difference in survival rates between the sexes in stage III GC.
Among the 438 patients who underwent molecular analysis in the present study, the males had higher PD-L1 expression than the females (27.1% vs. 10.9%, P=0.014), and the aged patients were associated with higher PD-L1 expression than the younger patients (29% vs. 14.9%, P=0.013). In addition, interestingly, among the GC patients with liver metastases and PD-L1 expression, most (14/16, 87.5%) patients were males and 12 of the 14 (85.7%) males were aged over 65 years.
PD-L1 expression has been reported to be higher in metastatic liver tumors than primary gastric tumor cells and tumor infiltrating lymphocytes [13]. Consequently, immunotherapy may be beneficial for GC patients with liver metastases. According to our results, we recommend evaluating PD-L1 expression in GC patients who develop liver metastases, especially aged male patients, which may provide useful information for evaluating immunotherapy in these patients.
The PD-L1 CPS score was developed using the 22C3 assay as a companion diagnostic for immunotherapy in GC, which was approved by the U.S. Food and Drug Administration [14]. Most trials regarding the use of immunotherapy in GC are designed for metastatic GC patients. A randomized, multicenter, double-blind, placebo-controlled phase 3 study, ATTRACTION-05 (ONO-4538-38/BMS CA209844), investigating the role of Nivolumab in combination with adjuvant chemotherapy in pathological stage III gastric and esophagogastric junction cancer has completed patient enrollment, and the results are pending. The results of the above trial may provide useful information regarding the selection of patients who can benefit from the use of immunotherapy and chemotherapy in adjuvant setting. In the present study, PD-L1 expression was more common in male and aged patients, especially in stage III GC, who may be beneficial for adjuvant immunotherapy.
Whole-genome sequencing demonstrated that males had more somatic structural variants than females in GC, but the underlying reason and clinical significance for this result is unclear [15]. Chromosome conformation capture (Hi-C) methods have identified subchromosomal structures of higher-order chromatin interactions called topologically associated domains (TADs) that are separated from each other by boundary regions [16, 17]. By subdividing the genome into discrete regulatory units, TADs restrict the contacts that enhancers establish with their target genes [18–20]. One of the major TADs related to gender is sex-determining region Y-related high-mobility group box 9 (SOX9) [17]. It was reported that SOX9 regulated CEACAM1 (carcinoembryonic antigen cell adhesion molecule 1) expression and immune resistance in melanoma [21]. Furthermore, PD-L1 expression appears to be directly or indirectly regulated by several X-linked miRNAs [22]. According to TargetScan 7.1 (http://www.targetscan.org), three miRNAs localized on chromosome X, including miR-106b, miR-20b, and miR-513, are repressors of PD-L1 by direct binding to their 3′UTRs. PD-L1 transcription is induced by hypoxia-inducible factor-1α (HIFα) and signal transducer and activation of transcription-3 (STAT3) factors, directly acting on its promotor [23]. miR-20b can target both HIF-1a and STAT3 transcription factors [24], thus repressing PD-L1 expression. Therefore, there might be a gene-to-gene enhancing coalition effect among sex and PD-L1 expression. Further investigation to understand the mechanisms underlying the gender disparity and aging in the treatment response for GC is still needed.
In the study of Sasao et al. [7], for patients aged 40 or younger, males were more likely to have tumor located in the lower-third of the stomach than females (30% vs. 5%). In the present study, as shown in Table 1, females were more likely to have tumors in the middle-third stomach than males before propensity-score matching. For the subgroup analysis for younger and older patients, because the number of patients aged 40 or younger is too small for analysis, we choose an age of 65 years or older to categorize aged patients according to the World Health Organization. In the present study, for patients aged younger than 65 years, females were more likely to have tumor located in the middle-third of the stomach than males (46.5% vs. 37.6%), while tumors in the lower-third of the stomach were more common in males than females (44.3% vs. 37.6%). For patients aged 65 or older, males were more likely to have tumor located in the upper-third of the stomach (20.6% vs. 10.8%). Based on our results and others, it seems that the tumor location of GC was associated with both sex and age.
Regarding the physiological gastrointestinal motility, for liquid diet, there was no significant difference between sexes; however, for solid diet, the gastric emptying diet is significantly longer in females than males [25]. Pre-menopausal females have significantly longer gastric emptying time than males for solid diet [26]. For post-menopausal females, the gastric emptying time decreases and becomes similar to that in males [27]. The gastric emptying time increased with age in the women, while the gastric emptying time remained almost unchanged with age in the males [28]. In addition to gender, age, and the type of meal, patient statue and the size of stomach and diabetic mellitus may also affect gastric motility. The possible impact on the gastric emptying time should be evaluated in separate male and female subpopulations.
In our hospital, there has been a case manager in charge of contacting gastric cancer patients for more than 30 years. Consequently, most patients receive regular follow-up at our hospital. Our previous study demonstrated that approximately 90% of gastric cancer recurrences occurred within 3 years after surgery [29]. In the present study, only 5.8% of our patients had follow-up time shorter than 3 years, we believe that the small percentage of patients have little impact on the tumor recurrence rate in the present study.
Because this study is a retrospective study with single center data, this study has limitations. Consequently, we performed propensity-score matching to minimize selection bias. GC, a multifactorial disease, is easily associated with dietary culture and economical levels. Diet with high fat/salt/nitrogen, a history of infection with Helicobacter pylori or Epstein-Barr virus, tobacco use, immune system, and genetic mutations caused by chronic inflammation are risk factors for cancer development [30–34]. In the present study, we could not analyze the influence of dietary and economical levels in our GC patients because the data is not available in most patients. Although our results demonstrated higher PD-L1 expression in males than females, especially in stage III GC, none of our enrolled patients received immunotherapy for tumor recurrence. We could not evaluate the efficacy of immunotherapy in this group of patients. Further randomized controlled trials investigating the use of immunotherapy for adjuvant therapy are required to validate our results and may provide convincing evidence regarding GC treatment in the future.
In conclusion, males were associated with more tumor recurrence and higher PD-L1 expression than females, especially in stage III GC. Examining PD-L1 expression is recommended for GC patients with liver metastases, especially aged male patients; immunotherapy may be beneficial for this group of GC patients. Further randomized controlled studies are required to validate our results.
Materials and Methods
Patients and sample collection
Between January 1992 and December 2013, in total, 2673 GC patients with adenocarcinoma who underwent curative surgery (R0 resection) were enrolled in the present study. Propensity-score matching was performed to minimize selection bias in the comparison of the clinicopathological features between the sexes.
Tumor and normal gastric mucosa tissues were collected and stored in a biobank at our institution. The genetic alterations of 438 GC patients with available tumor and normal gastric mucosa tissues were analyzed. The pathological staging of the GC was performed according to the 8th edition of the American Joint Committee on Cancer (AJCC)/Union for International Cancer Control (UICC) TNM classification system [35].
Follow-up
Follow-up examinations, including physical examinations, blood tests with measurements of tumor markers, chest radiography, and sonography or computerized tomography scans of the abdomen, were performed every 3 months during the first 3 years after surgery and every 6 months thereafter.
DNA extraction and analysis of microsatellite instability and genetic mutations
The DNA extraction from the tissue specimens was performed using a QIAamp DNA Tissue Kit and a MinElute Virus Kit (Qiagen, Valencia, CA, USA) according to a previous report [36].
As described in a previous study [12], five reference microsatellite markers, namely D5S345, D2S123, D17S250, BAT25 and BAT26, were used to determine MSI. MSI-high (MSI-H) was defined as ≥ 2 loci of instability with 5 markers, while MSI-low/stable (MSI-L/S) was defined as one unstable locus or no MSI loci.
A MassARRAY system (Agena, San Diego, CA, USA) was used to identify 68 mutation hotspots in 8 GC-related genes (TP53, ARID1A, PTEN, PIK3CA, AKT1, AKT2, AKT3, and BRAF) [36]. PI3K/AKT pathway genetic mutations was defined as mutations identified in PIK3CA, PTEN, AKT1, AKT2, or AKT3.
Immunohistochemical (IHC) staining for PD-L1
IHC staining was performed to detect PD-L1 expression using PD-L1 IHC 22C3 pharmDx kit on a Dako ASL48 platform [13]. The combined positive score (CPS) was calculated, and a CPS score >1 was defined as positive expression of PD-L1.
Propensity-score matching strategy
As shown in Table 1, to minimize selection bias, propensity-score matching was performed based on logistic regression modeling of seven covariates (age, tumor location, gross appearance, Lauren’s classification, lymphovascular invasion, adjuvant chemotherapy, and pathological TNM stage) to balance the potential confounders between the males and females. A 1:1 ratio matching of males and females was applied. A specific caliper width equal to 0.1 standard deviation was used.
Statistical analysis
IBM SPSS Statistics 25.0 (IBM Corp., Armonk, NY, USA) was used for the statistical analyses. A χ2 test with Yates correction or Fisher’s exact test was used to compare the categorical data. The OS was defined from the date of surgery to the date of death or the last follow-up, while DFS was defined as the length of time after surgery during which the patient was alive without GC recurrence. The Kaplan–Meier method was used for the survival analysis of the OS and DFS. A multivariate analysis with Cox proportional hazards models was performed to analyze the independent prognostic factors of the OS and DFS. A P value < 0.05 was defined as statistically significant.
Abbreviations
AJCC: American Joint Committee on Cancer; CPS: combined positive score; DFS: Disease-free survival; GC: Gastric cancer; MSI: Microsatellite instability; MSI-H: Microsatellite instability-high; MSI-L/S: Microsatellite instability-low/stable; OS: Overall survival; PCR: Polymerase chain reaction; PD-L1: programmed death-ligand 1; TCGA: The Cancer Genome Atlas; TNM: Tumor, Node, Metastasis; UICC: Union for International Cancer Control.
Author Contributions
Li-Wen Hsu and Wen-Liang Fang carried out the statistical analysis and drafted the manuscript. Chien-Hsing Lin carried out the molecular genetic studies, including the MassARRAY analysis. Wen-Liang Fang and Kuo-Hung Huang collected patients’ records and samples. Wen-Liang Fang conceived of the study and participated in its design and coordination as well as complete drafting of the manuscript. All authors read and approved the final manuscript.
Acknowledgments
The authors thank Chien-Hsing Lin and Fang-Yu Chang for the molecular genetic analysis and Ann Fen-Yau Li for the IHC staining of PD-L1 in the study.
Conflicts of Interest
No authors have any conflicts of interest in relation to the manuscript.
Funding
This study was supported by research grants from the Ministry of Science and Technology, Taiwan (107-2314-B-075-007, 107-2314-B-075-005-MY2) and Taipei Veterans General Hospital (V107C-040, V109C-105). The funding sources had no role in the study design, data analysis, writing or submission of the manuscript.
References
- 1. Ferlay J, Colombet M, Soerjomataram I, Mathers C, Parkin DM, Piñeros M, Znaor A, Bray F. Estimating the global cancer incidence and mortality in 2018: GLOBOCAN sources and methods. Int J Cancer. 2019; 144:1941–53. https://doi.org/10.1002/ijc.31937 [PubMed]
- 2. Cancer Genome Atlas Research Network. Comprehensive molecular characterization of gastric adenocarcinoma. Nature. 2014; 513:202–09. https://doi.org/10.1038/nature13480 [PubMed]
- 3. Fang WL, Huang KH, Chang SC, Lin CH, Chen MH, Chao Y, Lo SS, Li AF, Wu CW, Shyr YM. Comparison of the clinicopathological characteristics and genetic alterations between patients with gastric cancer with or without Helicobacter pylori infection. Oncologist. 2019; 24:e845–53. https://doi.org/10.1634/theoncologist.2018-0742 [PubMed]
- 4. Menke-Pluymers MB, Hop WC, Dees J, van Blankenstein M, Tilanus HW. Risk factors for the development of an adenocarcinoma in columnar-lined (Barrett) esophagus. The rotterdam esophageal tumor study group. Cancer. 1993; 72:1155–58. https://doi.org/10.1002/1097-0142(19930815)72:4<1155::aid-cncr2820720404>3.0.co;2-c [PubMed]
- 5. Lindblad M, Rodríguez LA, Lagergren J. Body mass, tobacco and alcohol and risk of esophageal, gastric cardia, and gastric non-cardia adenocarcinoma among men and women in a nested case-control study. Cancer Causes Control. 2005; 16:285–94. https://doi.org/10.1007/s10552-004-3485-7 [PubMed]
- 6. Freedman ND, Derakhshan MH, Abnet CC, Schatzkin A, Hollenbeck AR, McColl KE. Male predominance of upper gastrointestinal adenocarcinoma cannot be explained by differences in tobacco smoking in men versus women. Eur J Cancer. 2010; 46:2473–78. https://doi.org/10.1016/j.ejca.2010.05.005 [PubMed]
- 7. Sasao S, Hiyama T, Tanaka S, Yoshihara M, Yasui W, Chayama K. Clinicopathologic and genetic characteristics of gastric cancer in young male and female patients. Oncol Rep. 2006; 16:11–15. https://doi.org/10.3892/or.16.1.11 [PubMed]
- 8. Kawazoe A, Kuwata T, Kuboki Y, Shitara K, Nagatsuma AK, Aizawa M, Yoshino T, Doi T, Ohtsu A, Ochiai A. Clinicopathological features of programmed death ligand 1 expression with tumor-infiltrating lymphocyte, mismatch repair, and Epstein-Barr virus status in a large cohort of gastric cancer patients. Gastric Cancer. 2017; 20:407–15. https://doi.org/10.1007/s10120-016-0631-3 [PubMed]
- 9. Böger C, Behrens HM, Mathiak M, Krüger S, Kalthoff H, Röcken C. PD-L1 is an independent prognostic predictor in gastric cancer of western patients. Oncotarget. 2016; 7:24269–83. https://doi.org/10.18632/oncotarget.8169 [PubMed]
- 10. Zhang M, Dong Y, Liu H, Wang Y, Zhao S, Xuan Q, Wang Y, Zhang Q. The clinicopathological and prognostic significance of PD-L1 expression in gastric cancer: a meta-analysis of 10 studies with 1,901 patients. Sci Rep. 2016; 6:37933. https://doi.org/10.1038/srep37933 [PubMed]
- 11. Polom K, Marano L, Marrelli D, De Luca R, Roviello G, Savelli V, Tan P, Roviello F. Meta-analysis of microsatellite instability in relation to clinicopathological characteristics and overall survival in gastric cancer. Br J Surg. 2018; 105:159–67. https://doi.org/10.1002/bjs.10663 [PubMed]
- 12. Fang WL, Chang SC, Lan YT, Huang KH, Chen JH, Lo SS, Hsieh MC, Li AF, Wu CW, Chiou SH. Microsatellite instability is associated with a better prognosis for gastric cancer patients after curative surgery. World J Surg. 2012; 36:2131–38. https://doi.org/10.1007/s00268-012-1652-7 [PubMed]
- 13. Alsaab HO, Sau S, Alzhrani R, Tatiparti K, Bhise K, Kashaw SK, Iyer AK. PD-1 and PD-L1 checkpoint signaling inhibition for cancer immunotherapy: mechanism, combinations, and clinical outcome. Front Pharmacol. 2017; 8:561. https://doi.org/10.3389/fphar.2017.00561 [PubMed]
- 14. Fashoyin-Aje L, Donoghue M, Chen H, He K, Veeraraghavan J, Goldberg KB, Keegan P, McKee AE, Pazdur R. FDA Approval Summary: Pembrolizumab for Recurrent Locally Advanced or Metastatic Gastric or Gastroesophageal Junction Adenocarcinoma Expressing PD-L1. Oncologist. 2019; 24:103–109. https://doi.org/10.1634/theoncologist.2018-0221 [PubMed]
- 15. Xing R, Zhou Y, Yu J, Yu Y, Nie Y, Luo W, Yang C, Xiong T, Wu WK, Li Z, Bing Y, Lin S, Zhang Y, et al. Whole-genome sequencing reveals novel tandem-duplication hotspots and a prognostic mutational signature in gastric cancer. Nat Commun. 2019; 10:2037. https://doi.org/10.1038/s41467-019-09644-6 [PubMed]
- 16. Nora EP, Lajoie BR, Schulz EG, Giorgetti L, Okamoto I, Servant N, Piolot T, van Berkum NL, Meisig J, Sedat J, Gribnau J, Barillot E, Blüthgen N, et al. Spatial partitioning of the regulatory landscape of the X-inactivation centre. Nature. 2012; 485:381–85. https://doi.org/10.1038/nature11049 [PubMed]
- 17. Dixon JR, Selvaraj S, Yue F, Kim A, Li Y, Shen Y, Hu M, Liu JS, Ren B. Topological domains in mammalian genomes identified by analysis of chromatin interactions. Nature. 2012; 485:376–80. https://doi.org/10.1038/nature11082 [PubMed]
- 18. Lupiáñez DG, Kraft K, Heinrich V, Krawitz P, Brancati F, Klopocki E, Horn D, Kayserili H, Opitz JM, Laxova R, Santos-Simarro F, Gilbert-Dussardier B, Wittler L, et al. Disruptions of topological chromatin domains cause pathogenic rewiring of gene-enhancer interactions. Cell. 2015; 161:1012–25. https://doi.org/10.1016/j.cell.2015.04.004 [PubMed]
- 19. Symmons O, Uslu VV, Tsujimura T, Ruf S, Nassari S, Schwarzer W, Ettwiller L, Spitz F. Functional and topological characteristics of mammalian regulatory domains. Genome Res. 2014; 24:390–400. https://doi.org/10.1101/gr.163519.113 [PubMed]
- 20. Rao SS, Huntley MH, Durand NC, Stamenova EK, Bochkov ID, Robinson JT, Sanborn AL, Machol I, Omer AD, Lander ES, Aiden EL. A 3D map of the human genome at kilobase resolution reveals principles of chromatin looping. Cell. 2014; 159:1665–80. https://doi.org/10.1016/j.cell.2014.11.021 [PubMed]
- 21. Ashkenazi S, Ortenberg R, Besser M, Schachter J, Markel G. SOX9 indirectly regulates CEACAM1 expression and immune resistance in melanoma cells. Oncotarget. 2016; 7:30166–77. https://doi.org/10.18632/oncotarget.7379 [PubMed]
- 22. Carè A, Bellenghi M, Matarrese P, Gabriele L, Salvioli S, Malorni W. Sex disparity in cancer: roles of microRNAs and related functional players. Cell Death Differ. 2018; 25:477–85. https://doi.org/10.1038/s41418-017-0051-x [PubMed]
- 23. Chen J, Jiang CC, Jin L, Zhang XD. Regulation of PD-L1: a novel role of pro-survival signalling in cancer. Ann Oncol. 2016; 27:409–16. https://doi.org/10.1093/annonc/mdv615 [PubMed]
- 24. Cascio S, D’Andrea A, Ferla R, Surmacz E, Gulotta E, Amodeo V, Bazan V, Gebbia N, Russo A. miR-20b modulates VEGF expression by targeting HIF-1 alpha and STAT3 in MCF-7 breast cancer cells. J Cell Physiol. 2010; 224:242–49. https://doi.org/10.1002/jcp.22126 [PubMed]
- 25. Bennink R, Peeters M, Van den Maegdenbergh V, Geypens B, Rutgeerts P, De Roo M, Mortelmans L. Comparison of total and compartmental gastric emptying and antral motility between healthy men and women. Eur J Nucl Med. 1998; 25:1293–99. https://doi.org/10.1007/s002590050298 [PubMed]
- 26. Knight LC, Parkman HP, Brown KL, Miller MA, Trate DM, Maurer AH, Fisher RS. Delayed gastric emptying and decreased antral contractility in normal premenopausal women compared with men. Am J Gastroenterol. 1997; 92:968–75. [PubMed]
- 27. Hutson WR, Roehrkasse RL, Wald A. Influence of gender and menopause on gastric emptying and motility. Gastroenterology. 1989; 96:11–17. https://doi.org/10.1016/0016-5085(89)90758-0 [PubMed]
- 28. Grybäck P, Hermansson G, Lyrenäs E, Beckman KW, Jacobsson H, Hellström PM. Nationwide standardisation and evaluation of scintigraphic gastric emptying: reference values and comparisons between subgroups in a multicentre trial. Eur J Nucl Med. 2000; 27:647–55. https://doi.org/10.1007/s002590050558 [PubMed]
- 29. Wu CW, Lo SS, Shen KH, Hsieh MC, Chen JH, Chiang JH, Lin HJ, Li AF, Lui WY. Incidence and factors associated with recurrence patterns after intended curative surgery for gastric cancer. World J Surg. 2003; 27:153–58. https://doi.org/10.1007/s00268-002-6279-7 [PubMed]
- 30. González CA, Agudo A. Carcinogenesis, prevention and early detection of gastric cancer: where we are and where we should go. Int J Cancer. 2012; 130:745–53. https://doi.org/10.1002/ijc.26430 [PubMed]
- 31. Dikshit RP, Mathur G, Mhatre S, Yeole BB. Epidemiological review of gastric cancer in India. Indian J Med Paediatr Oncol. 2011; 32:3–11. https://doi.org/10.4103/0971-5851.81883 [PubMed]
- 32. Kou Y, Koag MC, Lee S. N7 methylation alters hydrogen-bonding patterns of guanine in duplex DNA. J Am Chem Soc. 2015; 137:14067–70. https://doi.org/10.1021/jacs.5b10172 [PubMed]
- 33. Kou Y, Koag MC, Lee S. Promutagenicity of 8-chloroguanine, a major inflammation-induced halogenated DNA lesion. Molecules. 2019; 24:3507. https://doi.org/10.3390/molecules24193507 [PubMed]
- 34. Wen R, Umeano AC, Kou Y, Xu J, Farooqi AA. Nanoparticle systems for cancer vaccine. Nanomedicine (Lond). 2019; 14:627–48. https://doi.org/10.2217/nnm-2018-0147 [PubMed]
- 35. American Joint Committee on Cancer. AJCC cancer staging manual. ed. New York: Springer; 2017.
- 36. Fang WL, Lan YT, Huang KH, Liu CA, Hung YP, Lin CH, Jhang FY, Chang SC, Chen MH, Chao Y, Lin WC, Lo SS, Fen-Yau Li A, et al. Clinical significance of circulating plasma DNA in gastric cancer. Int J Cancer. 2016; 138:2974–83. https://doi.org/10.1002/ijc.30018 [PubMed]