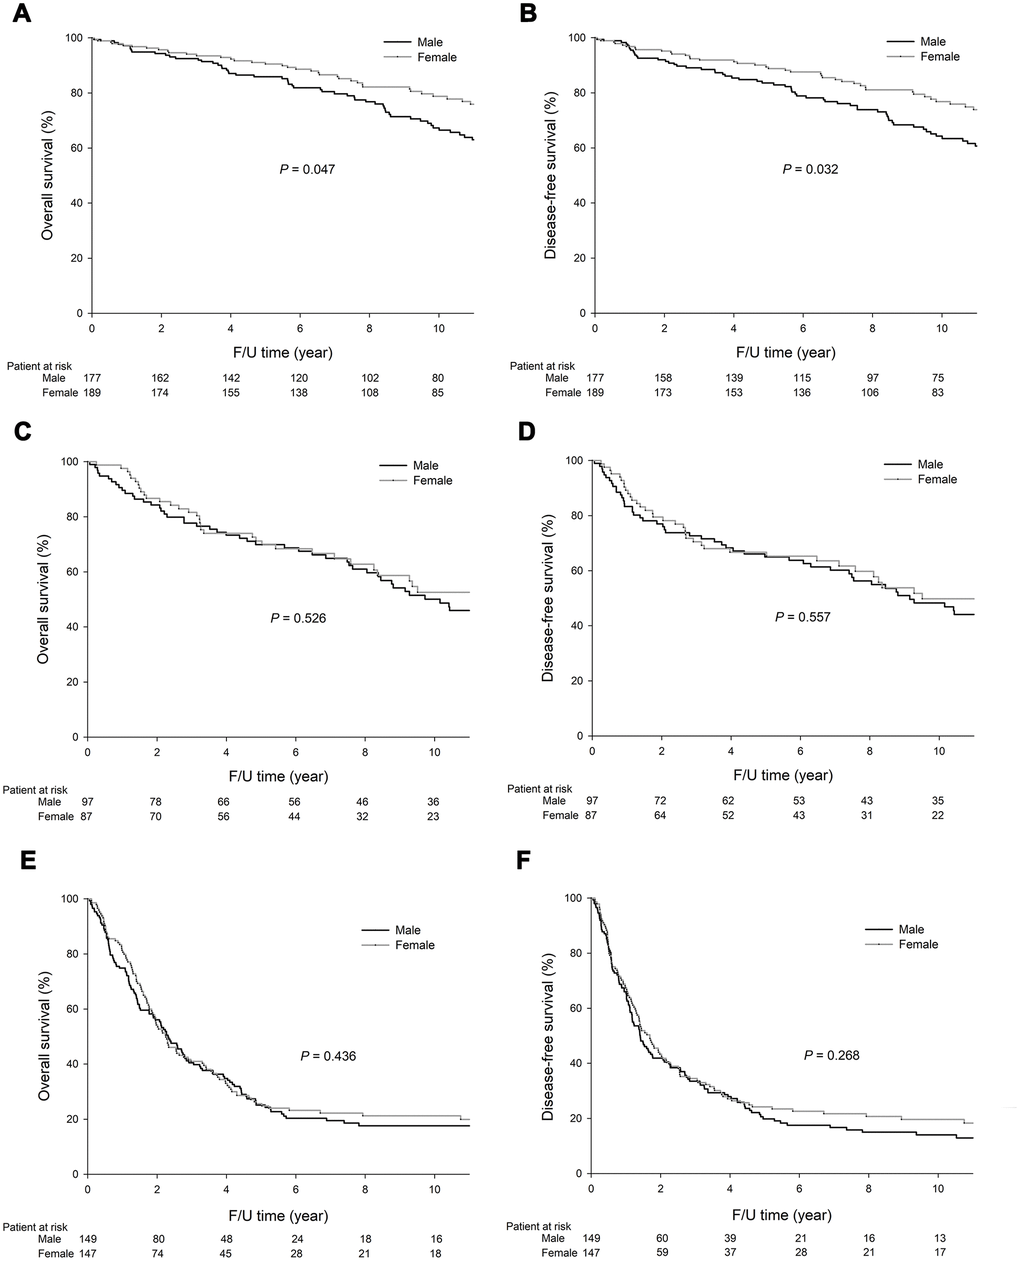
Figure 2.Among the stage I GC patients, the 5-year OS (85.9% vs. 90.5%, P=0.047) and DFS (83.6% vs. 88.8%, P=0.032) rates were significantly lower in the males than the females. Among the stage II GC patients, the 5-year OS (69.9% vs. 71.2%, P=0.526) and DFS (65.0% vs. 66.7%, P=0.557) rates did significantly differ between the males and females. Among the stage III GC patients, the 5-year OS (25.1% vs. 25.6%, P=0.436) and DFS (19.8% vs. 24.2%, P=0.268) rates did not significantly differ between the males and females. The survival curves are shown as follows: (A) OS curves of stage I GC patients; (B) DFS curves of stage I GC patients; (C) OS curves of stage II GC patients; (D) DFS curves of stage II GC patients; (E) OS curves of stage III GC patients; and (F) DFS curves of stage III GC patients.