


Introduction
Pancreatic cancer (PC) is one of the most lethal malignancies [1], with 47,050 estimated deaths in the United States in 2020 [2]. It is predicted to become the second leading cause of cancer-related deaths within the next decade, while the mortalities of other gastrointestinal cancers have declined over time [2, 3]. The poor outcomes of PC patients are attributed to diagnostic difficulty, early metastatic tendency and therapy resistance [4, 5]. Although the diagnostic and therapeutic strategies are constantly advancing, the mortality of PC patients remains high. Hence, for PC patients, valid biomarkers with simple test methods are urgently needed to predict survival outcomes, monitor disease changes, assess treatment responses and optimize treatment plans.
Liquid biopsy is a new technology of noninvasive detection that obtains biomarkers from nonsolid biological tissues such as blood [6], and it has received increasing attention in cancer research due to its convenience and noninvasiveness [7, 8]. Through the analysis of obtained markers, information from the source tissues can be reflected and cancers or other diseases can be monitored. For example, several recent studies have successfully applied liquid biopsy to achieve diagnosis and staging of PC [9, 10]. One of the biomarkers of liquid biopsy, circulating tumor DNA (ctDNA) arises from the apoptosis, necrosis, and lysis of circulating tumor cells, as well as active secretion from tumors [11, 12]. With the improvement of detection methods, ctDNA has been proposed as a biomarker for early diagnosis, prognostic stratification, disease monitoring and treatment response assessment in a variety of cancers [6, 13–15].
A growing body of studies has revealed the potential prognostic value of ctDNA in PC in recent years [16, 17]. The mutations and concentration levels of ctDNA may be associated with overall survival (OS) and progression-free survival (PFS) in PC patients. Our previous studies demonstrated that K-ras mutations and ERBB2 exon17 mutations detected in ctDNA are significantly associated with OS [18–20]. However, inconsistent findings have been reported [21, 22]. Systematic and significant evidence that validates the prognostic value of ctDNA in PC is lacking. Therefore, the present systematic review and meta-analysis was performed to clarify the relationship between ctDNA and the prognosis of PC patients to provide more reliable evidence that may improve the management and treatment of PC.
Results
Literature screening and study characteristics
The flow chart of the study selection criteria is presented in Figure 1. We initially identified 1233 studies from the Embase, MEDLINE, and Web of Science databases. Among these studies, 1175 were excluded after screening the titles and abstracts to remove duplicates or irrelevant studies. A total of 33 studies were excluded according to the inclusion and exclusion criteria. Thus, a total of 25 eligible studies that included 2326 patients were enrolled in this meta-analysis [18–42]. The characteristics of the included studies are summarized in Table 1. All of the included studies had OS outcomes, while 5 of them had PFS prognostic data [21, 28, 32, 35, 36]. Seven studies included patients with PC of all stages (stage: I - IV) [23–26, 29, 32, 33], 8 studies included patients with resectable PC (stage: I - II) [21, 22, 27, 31, 35, 37, 38, 42], and 12 studies included patients with advanced PC (stage: III - IV) [18–20, 22, 28, 30, 31, 34, 36, 39–41]. All of the included studies sampled at baseline, and 4 of them had postoperative data [21, 31, 35, 38]. For the quality assessment according to the Newcastle-Ottawa Scale (NOS), all of the included studies obtained a score greater than 6 (Supplementary Table 1).
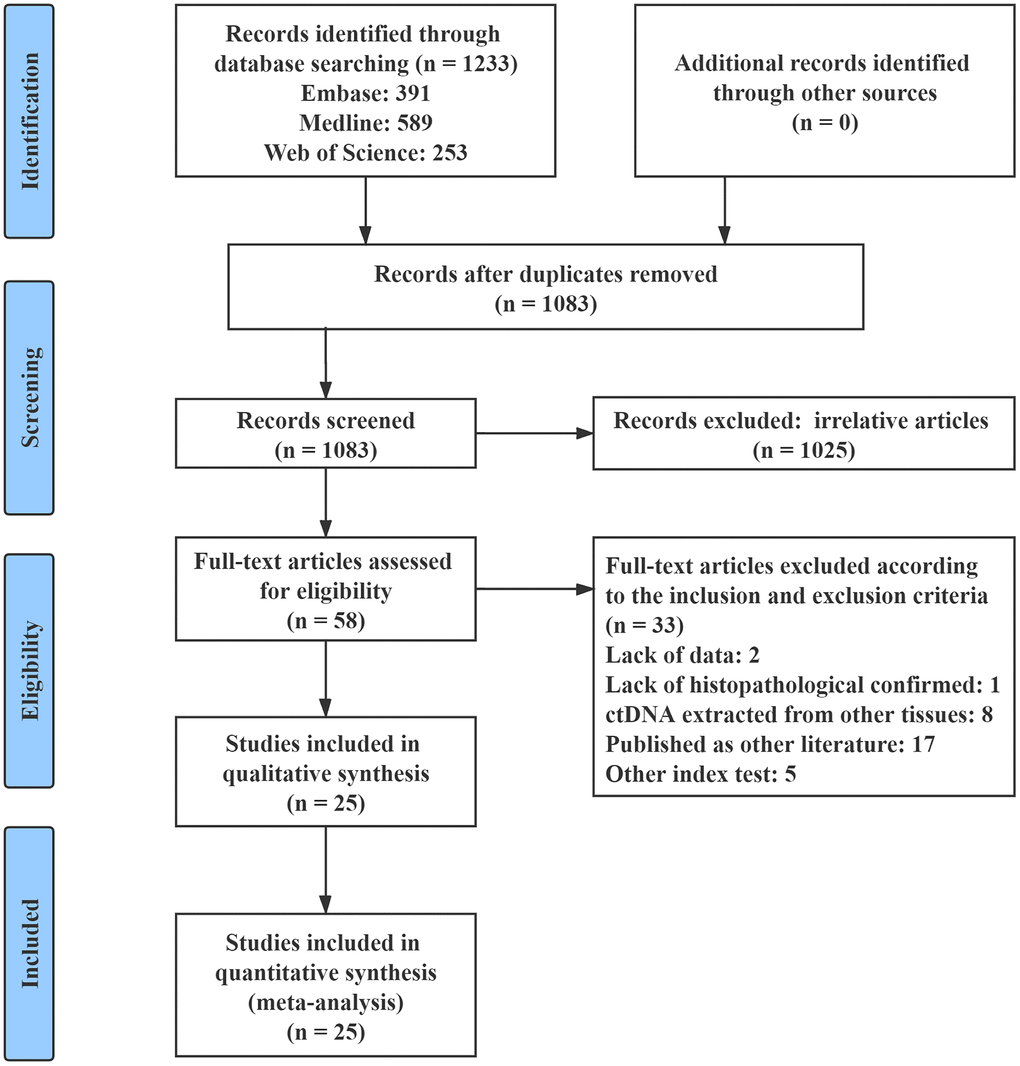
Figure 1. Flow chart of the study selection process.
Table 1. Characteristics of the Included Studies.
| Study | Country | No. of Patients | Tumor Stage | Sample | Sampling Time | ctDNA(+) Rate | Method | Marker | Survival Analysis | Result | |||||||||||||||||||||||||||||||||||||||||||||||||||||||||||||||||||||||||||||||||||||||||
| Castells 1999 [23] | Spain | 44 | I - IV | Plasma | Baseline | 12/44, 27% | RFLP-PCR | K-ras | U/M | OS | |||||||||||||||||||||||||||||||||||||||||||||||||||||||||||||||||||||||||||||||||||||||||
| Chen 2010 [18] | China | 91 | III - IV | Plasma | Baseline | 30/91, 33% | PCR | K-ras | U/M | OS | |||||||||||||||||||||||||||||||||||||||||||||||||||||||||||||||||||||||||||||||||||||||||
| Earl 2015 [24] | Spain | 31 | I - IV | Plasma | Baseline | 8/31, 26% | ddPCR | K-ras | U/M | OS | |||||||||||||||||||||||||||||||||||||||||||||||||||||||||||||||||||||||||||||||||||||||||
| Kinugasa 2015 [25] | Japan | 75 | I - IV | Serum | Baseline | 47/75, 63% | ddPCR | K-ras / G12V/ G12D | U/M | OS | |||||||||||||||||||||||||||||||||||||||||||||||||||||||||||||||||||||||||||||||||||||||||
| 66 | 36/66, 55% | ||||||||||||||||||||||||||||||||||||||||||||||||||||||||||||||||||||||||||||||||||||||||||||||||||
| Takai 2015 [26] | Japan | 259 | I - IV | Plasma | Baseline | 83/259, 32% | ddPCR | K-ras | M | OS | |||||||||||||||||||||||||||||||||||||||||||||||||||||||||||||||||||||||||||||||||||||||||
| Hadano 2016 [27] | Japan | 105 | I - II | Plasma | Baseline | 33/105, 31% | ddPCR | K-ras | U/M | OS | |||||||||||||||||||||||||||||||||||||||||||||||||||||||||||||||||||||||||||||||||||||||||
| Tjensvoll 2016 [28] | Norway | 14 | III - IV | Plasma | Baseline | 10/14, 71% | PNA-clamp PCR | K-ras / ctDNA level | U/M | OS / PFS | |||||||||||||||||||||||||||||||||||||||||||||||||||||||||||||||||||||||||||||||||||||||||
| Adamo 2017 [29] | UK | 26 | I - IV | Plasma | Baseline | 7/26, 27% | Targeted-NGS | K-ras | U | OS | |||||||||||||||||||||||||||||||||||||||||||||||||||||||||||||||||||||||||||||||||||||||||
| Chen 2017 [30] | Denmark | 189 | III - IV | Plasma | Baseline | 177/189, 94% | PCR coupled with NGS | ctDNA level | U/M | OS | |||||||||||||||||||||||||||||||||||||||||||||||||||||||||||||||||||||||||||||||||||||||||
| Cheng 2017 [19] | China | 188 | III - IV | Plasma | Baseline | 25/188, 13% | ddPCR | ERBB2 exon17 | U/M | OS | |||||||||||||||||||||||||||||||||||||||||||||||||||||||||||||||||||||||||||||||||||||||||
| 65/188, 35% | K-ras G12V | ||||||||||||||||||||||||||||||||||||||||||||||||||||||||||||||||||||||||||||||||||||||||||||||||||
| Pietrasz 2017 [31] | France | 104 | III - IV | Plasma | Baseline | 50/104, 48% | NGS | Multi-genes | U/M | OS | |||||||||||||||||||||||||||||||||||||||||||||||||||||||||||||||||||||||||||||||||||||||||
| 31 | I - II | Post-operative | 6/31, 19% | ||||||||||||||||||||||||||||||||||||||||||||||||||||||||||||||||||||||||||||||||||||||||||||||||
| Kim 2018 [32] | Korea | 106 | I - IV | Plasma | Baseline | 53/106, 50% | ddPCR | K-ras | U/M | OS / PFS | |||||||||||||||||||||||||||||||||||||||||||||||||||||||||||||||||||||||||||||||||||||||||
| Lin 2018 [33] | China | 65 | I - IV | Plasma | Baseline | 20/65, 31% | ddPCR | K-ras | U/M | OS | |||||||||||||||||||||||||||||||||||||||||||||||||||||||||||||||||||||||||||||||||||||||||
| Nakano 2018 [21] | Japan | 45 | I - II | Serum | Baseline | 11/45, 24% | PNA-clamp PCR | K-ras | U | OS / PFS | |||||||||||||||||||||||||||||||||||||||||||||||||||||||||||||||||||||||||||||||||||||||||
| Post-operative | 20/45, 44% | ||||||||||||||||||||||||||||||||||||||||||||||||||||||||||||||||||||||||||||||||||||||||||||||||||
| Perets 2018 [34] | Israel | 17 | III - IV | Plasma | Baseline | 5/17, 29% | PCR | K-ras | U | OS | |||||||||||||||||||||||||||||||||||||||||||||||||||||||||||||||||||||||||||||||||||||||||
| Yang 2018 [35] | China | 35 | I - II | Plasma | Baseline | 9/35, 26% | dPCR | K-ras G12V | U/M | OS / PFS | |||||||||||||||||||||||||||||||||||||||||||||||||||||||||||||||||||||||||||||||||||||||||
| Post-operative | 8/35, 23% | ||||||||||||||||||||||||||||||||||||||||||||||||||||||||||||||||||||||||||||||||||||||||||||||||||
| Bernard 2019 [36] | USA | 102 | III - IV | Plasma | Baseline | 53/102, 52% | ddPCR | K-ras | U/M | OS / PFS | |||||||||||||||||||||||||||||||||||||||||||||||||||||||||||||||||||||||||||||||||||||||||
| Groot 2019 [37] | USA | 59 | I - II | Plasma | Baseline | 29/59, 49% | ddPCR | K-ras | U/M | OS | |||||||||||||||||||||||||||||||||||||||||||||||||||||||||||||||||||||||||||||||||||||||||
| Lee 2019 [38] | Australia | 37 | I - II | Plasma | Baseline | 23/37, 62% | Safe-Sequencing System | K-ras | U/M | OS | |||||||||||||||||||||||||||||||||||||||||||||||||||||||||||||||||||||||||||||||||||||||||
| 35 | Post-operative | 13/35, 37% | |||||||||||||||||||||||||||||||||||||||||||||||||||||||||||||||||||||||||||||||||||||||||||||||||
| Mohan 2019 [39] | UK | 55 | III - IV | Plasma | Baseline | 40/55, 73% | ddPCR | K-ras | U | OS | |||||||||||||||||||||||||||||||||||||||||||||||||||||||||||||||||||||||||||||||||||||||||
| Patel 2019 [40] | USA | 94 | III - IV | Plasma | Baseline | 70/94, 74% | NGS | K-ras / ctDNA level | U/M | OS | |||||||||||||||||||||||||||||||||||||||||||||||||||||||||||||||||||||||||||||||||||||||||
| Strijker 2019 [41] | Netherlands | 58 | III - IV | Plasma | Baseline | 26/58, 45% | Targeted-NGS | ctDNA level | U/M | OS | |||||||||||||||||||||||||||||||||||||||||||||||||||||||||||||||||||||||||||||||||||||||||
| Watanabe 2019 [22] | Japan | 39 | I - II | Plasma | Baseline | 7/39, 20% | ddPCR | K-ras | U/M | OS | |||||||||||||||||||||||||||||||||||||||||||||||||||||||||||||||||||||||||||||||||||||||||
| 39 | III - IV | 12/39, 31% | |||||||||||||||||||||||||||||||||||||||||||||||||||||||||||||||||||||||||||||||||||||||||||||||||
| Cheng 2020 [20] | China | 210 | III - IV | Plasma | Baseline | 61/210, 29% | ddPCR | K-ras G12V | U/M | OS | |||||||||||||||||||||||||||||||||||||||||||||||||||||||||||||||||||||||||||||||||||||||||
| 93/210, 44% | K-ras G12D | ||||||||||||||||||||||||||||||||||||||||||||||||||||||||||||||||||||||||||||||||||||||||||||||||||
| Guo 2020 [42] | China | 113 | I - II | Plasma | Baseline | 26/113, 23% | ddPCR | K-ras G12V | U/M | OS | |||||||||||||||||||||||||||||||||||||||||||||||||||||||||||||||||||||||||||||||||||||||||
| 13/113, 12% | K-ras G12D | ||||||||||||||||||||||||||||||||||||||||||||||||||||||||||||||||||||||||||||||||||||||||||||||||||
| PCR: polymerase chain reaction; NGS: next-generation sequencing; RFLP-PCR: restriction fragment length polymorphism-PCR; dPCR: digital PCR; ddPCR: droplet digital PCR; PNA-clamp PCR: peptide nucleic acid-clamp PCR; OS: overall survival; PFS: progression-free survival; U: univariate analysis; M: multivariate analysis. | |||||||||||||||||||||||||||||||||||||||||||||||||||||||||||||||||||||||||||||||||||||||||||||||||||
ctDNA as a prognostic factor of PC
A total of 24 studies that included 34 sets of samples were available for OS analyzed by univariate analysis and were pooled for meta-analysis. The meta-analysis results for ctDNA and the prognosis of PC patients are shown in Figure 2A. The results indicated that patients with mutations detected and high concentrations of ctDNA had a significantly poorer OS (HR = 2.54; 95% CI, 2.05-3.14). As shown in Figure 2B, for the multivariate analysis, 21 studies that included 28 sets of samples were analyzed and showed significant results (HR = 2.07; 95% CI, 1.69-2.54). Because of the significant heterogeneity (I2 = 87.7% and I2 = 85.8%), a random-effects model was applied. As shown in Figure 3A, for PFS, 5 studies that included 8 sets of samples were analyzed via univariate analysis, and the results showed significant associations between mutations detected and high concentrations of ctDNA and the PFS of PC patients (HR = 2.18; 95% CI, 1.41-3.37, I2 = 65.9%). Similar results (Figure 3B) were found when analyzed by multivariate analysis (HR = 2.20; 95% CI, 1.38-3.52, I2 = 61.5%).
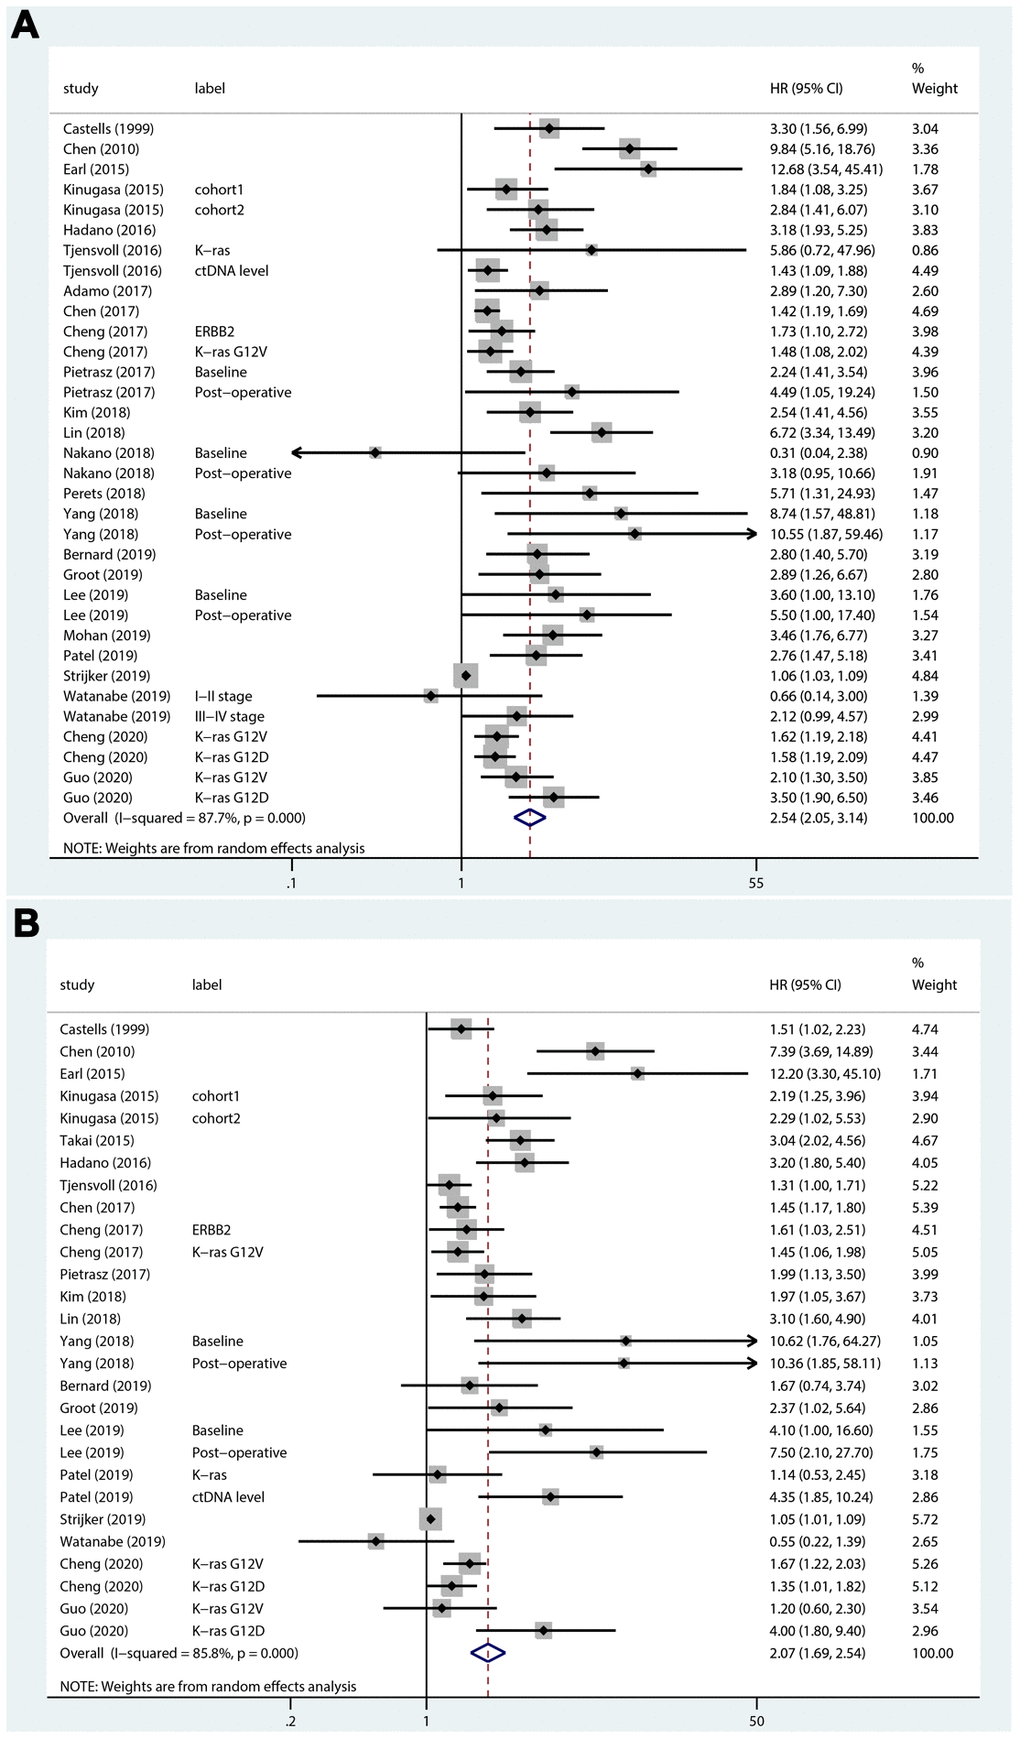
Figure 2. Forest plots of the HRs for ctDNA and the OS of PC patients. (A) The original HRs of OS analyzed by univariate analysis. (B) The original HRs of OS analyzed by multivariate analysis.
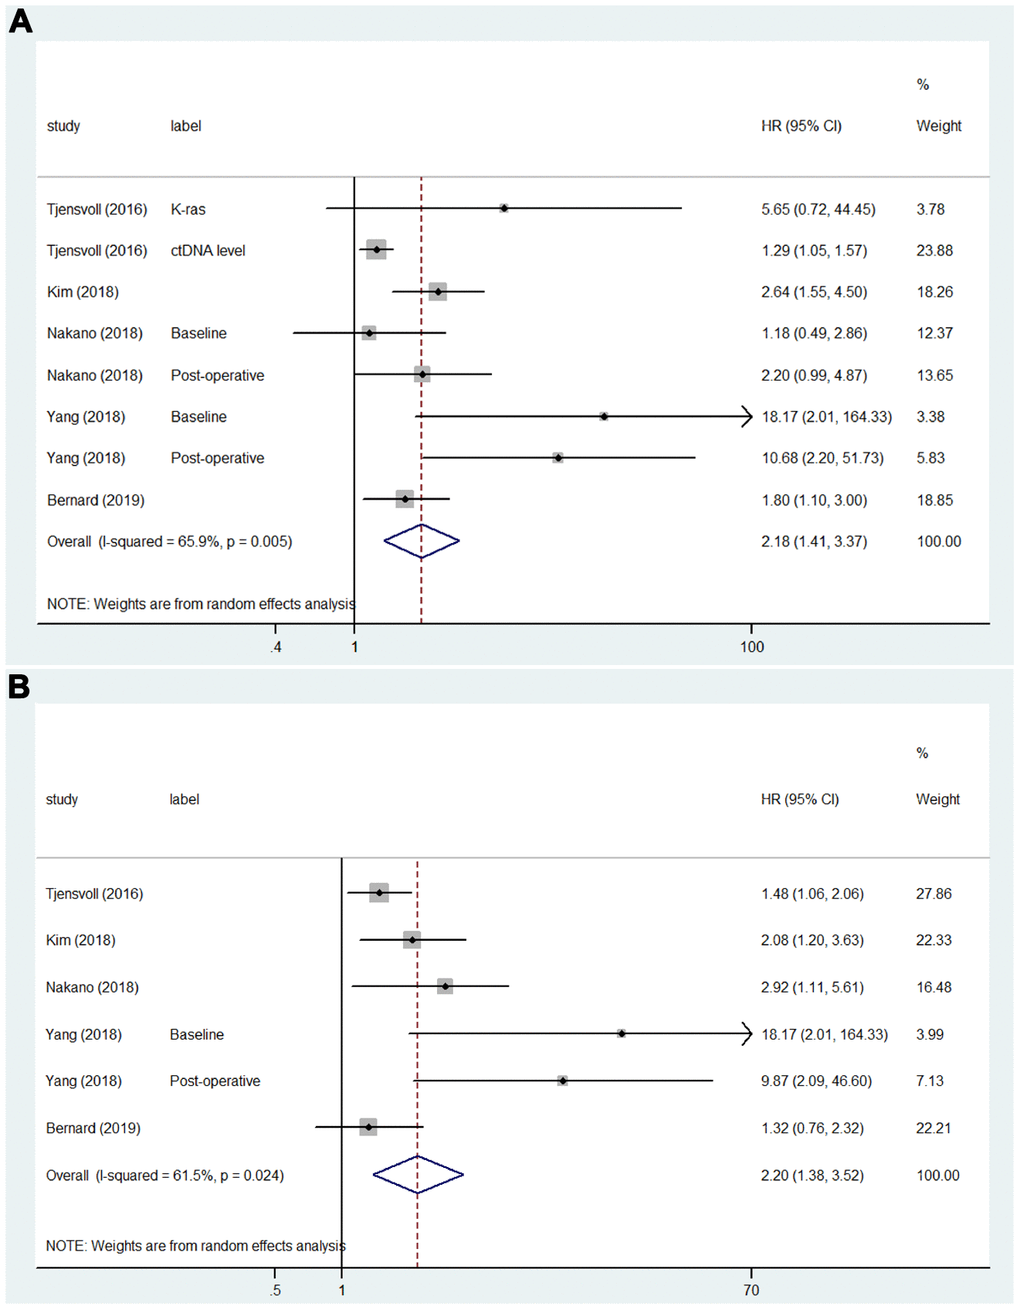
Figure 3. Forest plots of the HRs for ctDNA and the PFS of PC patients. (A) The original HRs of PFS analyzed by univariate analysis. (B) The original HRs of PFS analyzed by multivariate analysis.
Subgroup analysis
Subgroup analyses were performed because of the significant heterogeneity in the above results. As shown in Supplementary Figure 1A, in the subgroup analysis by disease stage, whether the studies included patients with PC of all stages (HR = 3.37; 95% CI, 2.22-5.12, I2 = 55.2%), resectable PC only (HR = 2.95; 95% CI, 2.11-4.12, I2 = 28.0%), or advanced PC only (HR = 2.01; 95% CI, 1.58-2.57, I2 = 89.0%), mutations detected and high concentrations of ctDNA were still significant predictors of poorer OS and presented a similar effect. When classified by the sampling time, as shown in Supplementary Figure 1B, the studies sampled postoperatively (HR = 4.84; 95% CI, 2.38-9.85, I2 = 0.0%) had higher HRs than the studies sampled at baseline (HR = 2.42; 95% CI, 1.95-3.01, I2 = 88.4%). For subgroup analysis by detection marker (Supplementary Figure 1C), the studies detected K-ras mutations (HR = 3.31; 95% CI, 2.53-4.34, I2 = 48.6%), K-ras G12V mutation (HR = 2.03; 95% CI, 1.51-2.74, I2 = 49.3%) or K-ras G12D mutation (HR = 1.77; 95% CI, 1.22-2.58, I2 = 55.6%) showed that mutations detected in ctDNA were significantly associated with poorer OS, and the concentration level of ctDNA was also significantly associated with OS (HR = 1.40; 95% CI, 1.07-1.83, I2 = 87.2%). Subgroup analyses were also performed according to the detection method, ctDNA positive rate, sample origin, patient ethnicity and patient size, and the results are summarized in Table 2.
Table 2. Subgroup analysis for overall survival.
| Subgroups | No. of Studies | HR | 95% CI | I2 |
| Tumor Stage | ||||
| I-IV | 7 | 3.37 | 2.22-5.12 | 55.2% |
| I-II | 12 | 2.95 | 2.11-4.12 | 28.0% |
| III-IV | 15 | 2.01 | 1.58-2.57 | 89.0% |
| Sampling Time | ||||
| Baseline | 30 | 2.42 | 1.95-3.01 | 88.4% |
| Post-operative | 4 | 4.84 | 2.38-9.85 | 0.0% |
| Detection Marker | ||||
| K-ras | 20 | 3.31 | 2.53-4.34 | 48.6% |
| K-ras G12V | 7 | 2.03 | 1.51-2.74 | 49.3% |
| K-ras G12D | 4 | 1.77 | 1.22-2.58 | 55.6% |
| ERBB2 exon17 | 1 | 1.73 | 1.10-2.72 | 0.0% |
| ctDNA level | 4 | 1.40 | 1.07-1.83 | 87.2% |
| Detection Method | ||||
| PCR | 9 | 3.77 | 1.77-8.02 | 81.6% |
| ddPCR | 17 | 2.36 | 1.90-2.94 | 62.3% |
| NGS | 5 | 2.14 | 1.17-3.91 | 85.4% |
| Safe-Sequencing System | 2 | 4.35 | 1.67-11.32 | 0.0% |
| PCR&NGS | 1 | 1.42 | 1.19-1.69 | 0.0% |
| ctDNA(+) Rate | ||||
| <40% | 19 | 3.08 | 2.22-4.28 | 74.1% |
| >40% | 15 | 2.01 | 1.58-2.55 | 84.6% |
| Sample Origin | ||||
| Plasma | 30 | 2.60 | 2.08-3.26 | 88.6% |
| Serum | 4 | 2.05 | 1.16-3.65 | 36.1% |
| Ethnicity | ||||
| Asian | 18 | 2.49 | 1.90-3.28 | 73.2% |
| Caucasian | 16 | 2.47 | 1.85-3.30 | 85.5% |
| Patient Size | ||||
| <50 | 15 | 3.14 | 2.01-4.90 | 60.3% |
| 50-100 | 8 | 3.10 | 1.58-6.09 | 93.6% |
| >100 | 11 | 1.91 | 1.60-2.27 | 55.1% |
Publication bias
The publication bias of the included studies was assessed by Egger’s and Begg’s tests in this meta-analysis. Significant publication bias was found in both the univariate and multivariate OS analyses according to the results of Egger’s and Begg’s tests (Figure 4A, 4B). Thus, we performed a trim and fill analysis, and the pooled HRs calculated by the trim and fill analysis still showed a significant effect of ctDNA in both the univariate OS analysis (HR = 2.05; 95% CI, 1.68-2.49) and multivariate OS analysis (HR = 1.74; 95% CI, 1.43-2.12). The funnel plot for the trim and fill analysis is shown in Figure 5A, 5B.
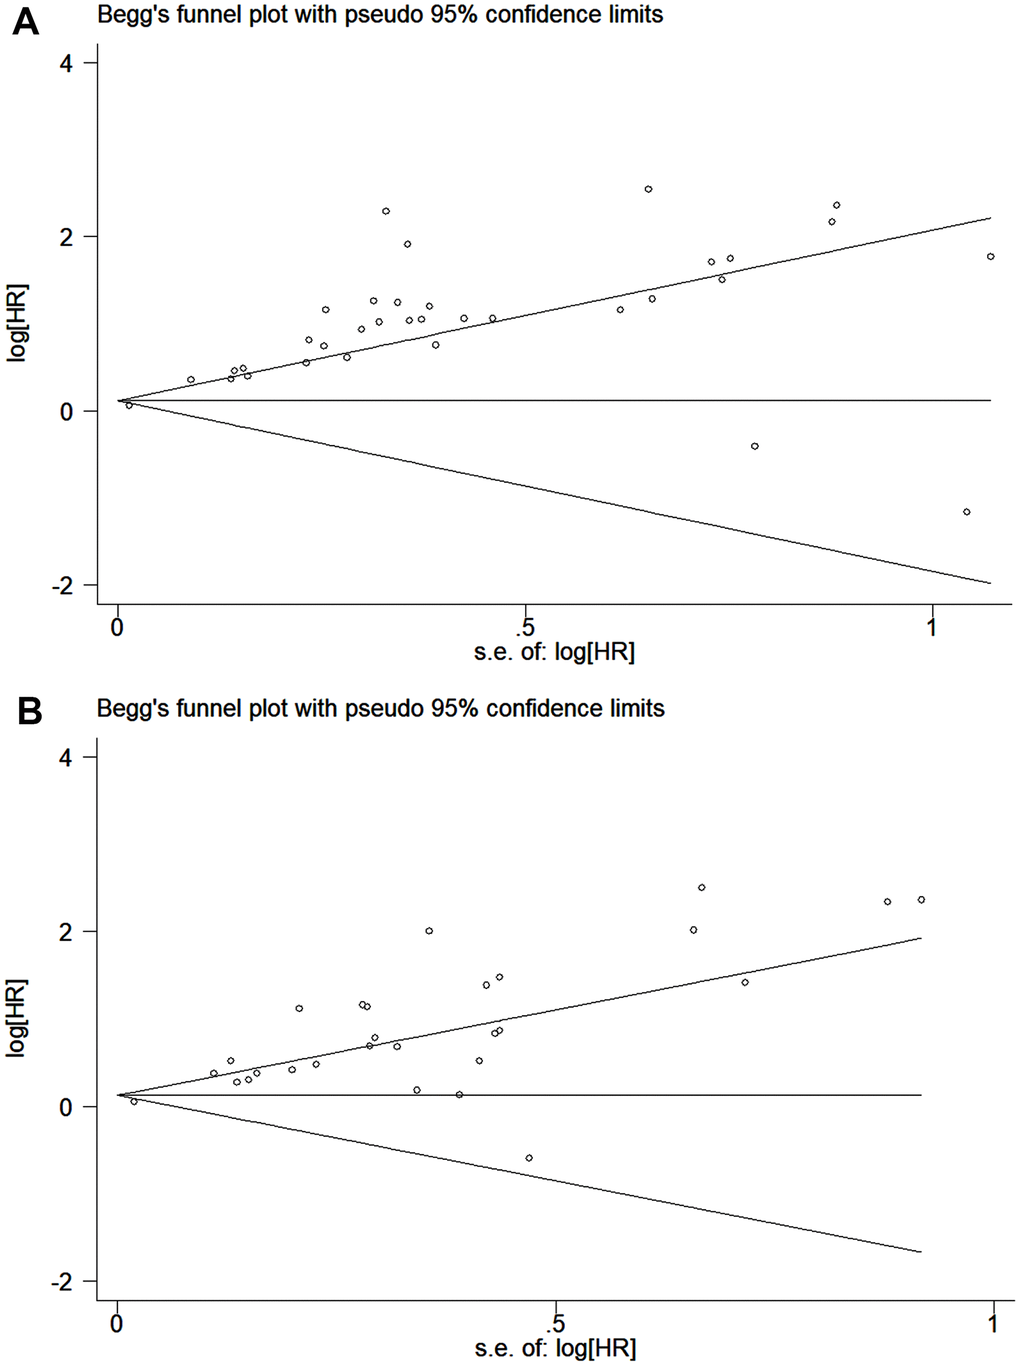
Figure 4. Funnel plot for the assessment of publication bias of the included studies. (A) The original HRs of OS analyzed by univariate analysis. (B) The original HRs of OS analyzed by multivariate analysis.
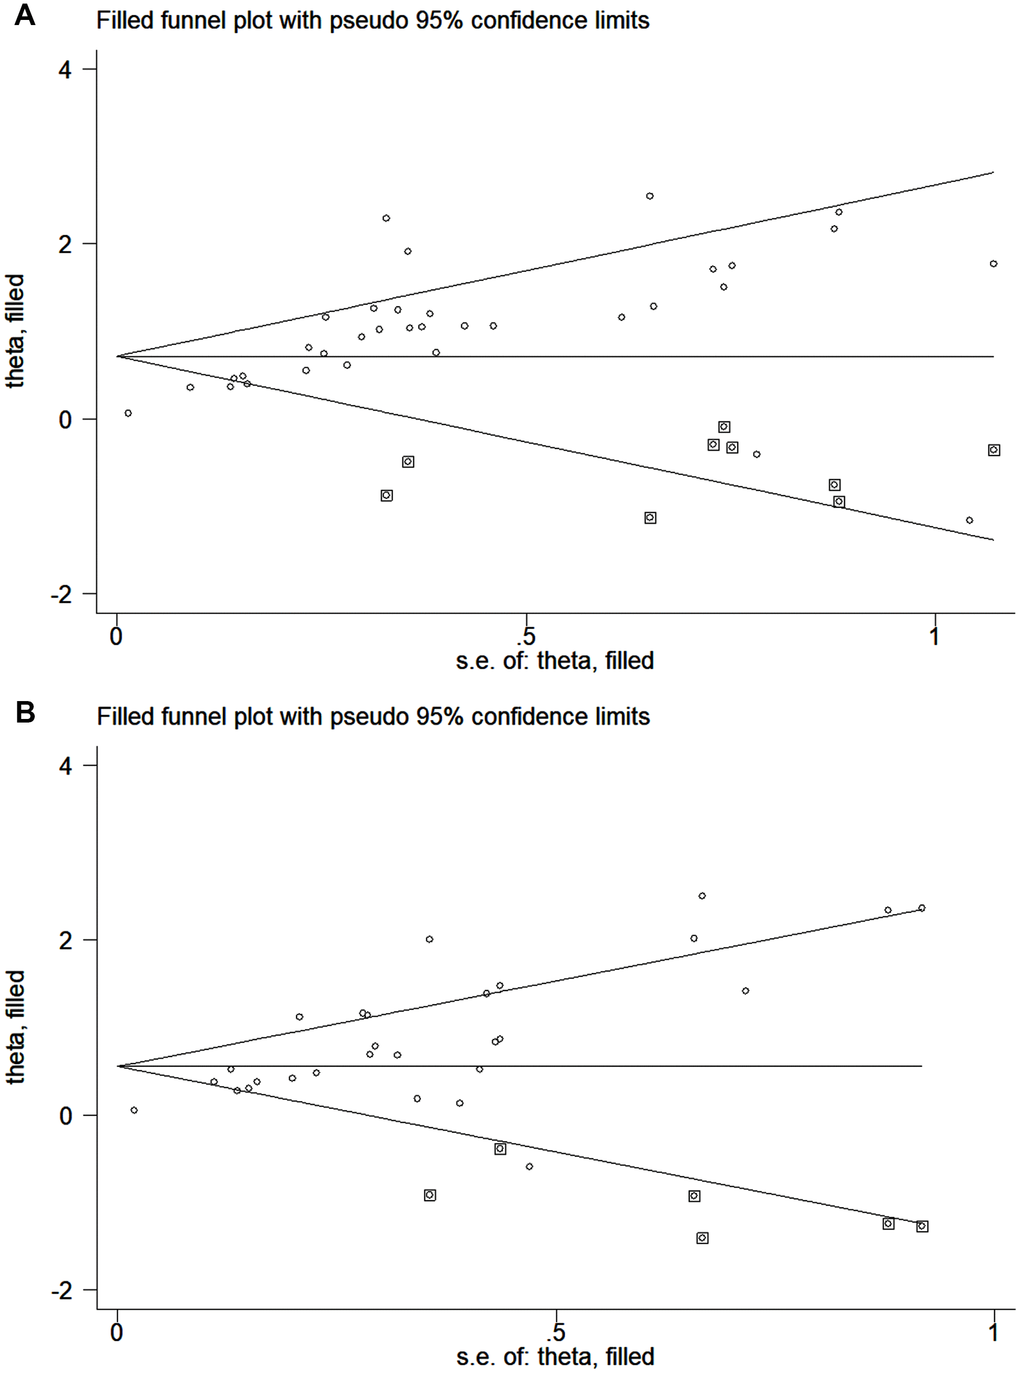
Figure 5. Funnel plot for the trim and fill analysis. (A) The original HRs of OS analyzed by univariate analysis. (B) The original HRs of OS analyzed by multivariate analysis.
Discussion
PC is well known to have a poor prognosis, of which the five-year survival rate is approximately 10%, and only 15–25% of PC patients are resectable [4, 43]. Patients in different stages are suggested to undergo different treatments. For advanced PC, patients are usually suggested to undergo chemotherapy with combination regimens, but therapy resistance is a characteristic of PC [44, 45]. For resectable PC, extensive surgery with adjunctive chemotherapy is recommended; however, many resectable PC patients experience recurrence [46]. Thus, many studies have largely focused on finding effective prognostic factors. Increasing evidence has revealed the potential prognostic value of ctDNA in PC, although many studies validated their results using small sample sizes. However, inconsistent findings have been reported. Therefore, this systematic review and meta-analysis was performed to assess the potential prognostic value of ctDNA in PC.
A total of 2326 patients pooled from 25 eligible studies were included in this meta-analysis. The sample sizes for each study ranged from 14 to 259. The ctDNA was detected via different markers in these studies, which can be divided into two categories: mutations and concentration levels. Our study demonstrated that patients with mutations detected and high concentrations of ctDNA had significantly poorer OS (univariate: HR = 2.54; 95% CI, 2.05-3.14; multivariate: HR = 2.07; 95% CI, 1.69-2.54) and PFS (univariate: HR = 2.18; 95% CI, 1.41-3.37; multivariate: HR = 2.20; 95% CI, 1.38-3.52). Due to the significant heterogeneity, we performed subgroup analyses by tumor stage, sampling time, detection marker, etc. Significant differences were not observed between the results according to tumor stage and detection marker in the subgroup analyses. For the sampling time, the results showed that the studies that sampled postoperatively (HR = 4.84; 95% CI, 2.38-9.85, I2 = 0.0%) had higher HRs than the studies that sampled at baseline (HR = 2.42; 95% CI, 1.95-3.01, I2 = 88.4%). In terms of heterogeneity, the I2 value decreased to approximately 50.0% in most subgroups, which indicated that some of the sources of heterogeneity were the differences in tumor stages, sampling times, and detection markers.
As shown in the results of the subgroup analysis by detection methods, the I2 value decreased to approximately 60% in the droplet digital PCR (ddPCR) subgroups, which indicated that the differences in detection methods might be another potential source of heterogeneity. The technologies for ctDNA analysis are based on next-generation sequencing (NGS) or polymerase chain reaction (PCR). The methods based on PCR, such as digital PCR (dPCR), ddPCR and peptide nucleic acid-clamp PCR (PNA-clamp PCR), are more sensitive, quick, and inexpensive, but they can analyze only some specific loci once a time [14]. The methods based on NGS can analyze more loci and even perform whole-exome sequencing, but their sensitivity is lower than that of PCR-based methods. Thus, some researchers coupled the two technologies to reduce this limitation [30]. Before detection, the procedures of sample collection and ctDNA extraction are equally important [47]. However, standardized protocols for the collection, extraction and detection of ctDNA are lacking, which is one of the most important reasons why ctDNA has not been widely used in the clinic.
Most of the studies included in this meta-analysis focused on the mutation detection of ctDNA, especially K-ras mutations. K-ras, which encodes a small GTPase that modulates downstream signaling from growth factor receptors, is one of the major driver genes in PC and plays an important role in tumor progression [48]. Although the work of Nakano et al. [21] and Watanabe et al. [22] reported inconsistent findings, our analysis still shows that the detection of K-ras mutations in ctDNA had significant prognostic value in PC. In our view, we speculate that the reasons for the inconsistent results may be related to the use of different sources of samples, including plasma and serum; the inclusion of patients with pancreatic cancer in different stages that have received neo-adjuvant chemoradiotherapy or not; and the inclusion of patients with demographic differences. Several studies have reported that a type of K-ras mutations, the K-ras G12V mutation, is an independent prognostic factor in PC [19, 25, 35]. Cheng et al. [20] and Guo et al. [42] showed that the K-ras G12D mutation also has a significant prognostic value, although Kinugasa et al. [25] suggested that there is no significant association between the K-ras G12D mutation and OS in PC patients. According to the results of this meta-analysis, we considered that the detection of the K-ras G12D mutation is a significant prognostic factor in PC (HR = 1.77; 95% CI, 1.22-2.58, I2 = 55.6%), although more studies are needed to further confirm this finding. On the other hand, 4 studies focused on the concentration level of ctDNA [28, 30, 40, 41]. Although only 4 studies were included in this subgroup analysis, the heterogeneity among these studies was significantly high. We hold the opinion that in terms of concentration detection, different detection methods and cut-off values will have a greater impact on the results, which leads to high heterogeneity. Thus, more high-quality studies are needed to test the prognostic value of the concentration levels of ctDNA. In addition to these studies, Henriksen et al. reported that cell-free DNA promoter hypermethylation in plasma was associated with poorer OS [49]. We did not include this study in the meta-analysis because it studied cell-free DNA instead of ctDNA, and the detection methods between hypermethylation and mutation were considerably different. However, this study offers a potential idea and basis for further research on ctDNA.
In addition to one-point assessments of ctDNA, Watanabe et al. revealed that the longitudinal monitoring of ctDNA can also predict the prognosis of PC [22]. The emergence of ctDNA in longitudinal tests was associated with OS in both patients who underwent surgery (HR = 54.50; 95% CI, 6.64-447.60) and those who did not undergo surgery (HR = 10.40; 95% CI, 2.95-37.00). One of our recent studies reported that the detection of the K-ras G12V mutation in ctDNA correlated with circulating Treg cells can further stratify the prognosis in patients with advanced PC [20]. Patients with both the K-ras G12V mutation and high Treg cell levels had the worst survival. These studies suggested the great potential value in the innovative application of ctDNA for analyzing prognosis.
The prognostic value of ctDNA is not limited to OS and PFS. Lee et al. reported that ctDNA is associated with recurrence-free survival (RFS) [38]. For patients with resectable PC, postoperative ctDNA detection is a significant predictor of recurrence (HR = 6.30; 95% CI, 2.40-16.20). Guo et al. also found that the detection of the K-ras G12D in ctDNA is an independent prognostic factor of recurrence (HR = 5.10; 95% CI, 2.20-11.80) [42]. The effective prediction of recurrence plays an important guiding role in the selection of clinical treatment strategies, which allows for more aggressive screening and treatment to prevent recurrence.
Several limitations in the current meta-analysis should be considered. First, the methodological and clinical characteristics of the eligible studies were not quite consistent, which may cause heterogeneity in the overall results. Second, the differences in patient characteristics (such as age or other variables) may be another potential source of heterogeneity. Third, only studies published in English were included in our meta-analysis, which may result in bias. Finally, significant publication bias was observed in our meta-analysis. The results of the trim and fill analysis revealed that unpublished studies with negative conclusions might not impact the results of our meta-analysis. However, to provide more reliable evidence, the findings of our meta-analysis need to be confirmed by further multicenter, prospective clinical trials.
Conclusions
In conclusion, the current meta-analysis indicates that there is a significant association between detectable ctDNA and PC prognosis. Mutations detected or high concentrations of ctDNA are significant predictors of the OS and PFS of PC patients. Our meta-analysis strongly supports that ctDNA is a useful predictive biomarker for PC, with advantages of convenience, safety and noninvasiveness.
Materials and Methods
Search strategy
A systematic literature review was conducted by searching Embase, MEDLINE, and Web of Science from inception to April 2020. The keywords used in our searches were “circulating tumor DNA/ctDNA/cell free DNA/cfDNA”, “pancreatic cancer/pancreatic neoplasm/pancreatic ductal adenocarcinoma/PDAC” and “prognosis/prognostic”. The reference lists of the selected articles were also used to supplement the searches. Two reviewers (ZL Fang and QC Meng) independently assessed the eligibility of the potential studies following the guidelines of the Preferred Reporting Items for Systematic Reviews and Meta-Analyses (PRISMA) statement [50].
Inclusion and exclusion criteria
The inclusion criteria were as follows: (1) all PC patients included in the studies were confirmed by histopathology; (2) ctDNA was extracted from peripheral blood; (3) the time of sample collection was declared; and (4) the prognostic value of ctDNA was reported or able to be calculated. The exclusion criteria were as follows: (1) ctDNA was not extracted from peripheral blood; (2) the HRs of prognostic data were not reported and Kaplan-Meier curves were not provided to calculate them; and (3) literature published as reviews, conferences, case reports, letters or expert opinions.
Data extraction
The data were reviewed and extracted independently by two reviewers, and any disagreements were settled by discussion. The following information was extracted from the included articles: name of the first author, publication year, country of study, number of patients, tumor stage, sample origin, sampling time, ctDNA positive rate, detection method, detection marker, and HRs of prognostic data including OS and PFS. For articles whose HRs and 95% CIs were not directly available, we extracted the data from Kaplan-Meier curves via Engauge Digitizer version 4.1 [51] and used the methods described by Tierney et al. to calculate the HRs with 95% CIs [52].
Quality assessment
The NOS was used to evaluate the quality of the included studies by two reviewers independently [53]. This scale consists of 8 items and is used to assess the quality of the selection, comparability, exposure (case-control studies) and outcomes (cohort studies) of the included studies. In the present study, we considered a study with a score of 6 or more as a high-quality study.
Statistical analysis
Pooled HRs of OS and PFS were calculated using Stata 12.0 (StataCorp, College Station, TX, USA). If the original HRs were analyzed by both univariate and multivariate analyses, the pooled HRs were calculated respectively. Heterogeneity was assessed by chi-square tests and I2 values. For values of I2 > 50% or p < 0.1, the random-effects model was used; otherwise, the fixed-effects model was applied. All p-values were two sided, and statistical significance was set at p < 0.05. Subgroup analyses were performed according to the tumor stage, sampling time, detection marker, detection method, ctDNA positive rate, sample origin, ethnicity and patient size.
Author Contributions
ZLF, QCM and BZ collected the related papers, performed the meta-analysis and drafted the manuscript. SS, JL, CL and JH participated in the design of the meta-analysis. WW, JX and XJY initiated the study and revised the manuscript. All authors have read and agreed to the published version of the manuscript.
Conflicts of Interest
The authors declare no conflicts of interest.
Funding
This study was jointly funded by the National Natural Science Foundation of China (No. 81772555, 81802352 and 81902428), the National Science Foundation for Distinguished Young Scholars of China (No. 81625016), the Shanghai Sailing Program (No. 19YF1409400 and 20YF1409000), the Shanghai Rising-Star Program (No. 20QA1402100), the Shanghai Anticancer Association Young Eagle Program (No. SACA-CY19A06), the Clinical and Scientific Innovation Project of Shanghai Hospital Development Center (No. SHDC12018109 and SHDC12019109) and the Scientific Innovation Project of Shanghai Education Committee (No. 2019-01-07-00-07-E00057).
References
- 1. Shi S, Hua J, Liang C, Meng Q, Liang D, Xu J, Ni Q, Yu X. Proposed modification of the 8th edition of the AJCC staging system for pancreatic ductal adenocarcinoma. Ann Surg. 2019; 269:944–50. https://doi.org/10.1097/SLA.0000000000002668 [PubMed]
- 2. Siegel RL, Miller KD, Jemal A. Cancer statistics, 2020. CA Cancer J Clin. 2020; 70:7–30. https://doi.org/10.3322/caac.21590 [PubMed]
- 3. Rahib L, Smith BD, Aizenberg R, Rosenzweig AB, Fleshman JM, Matrisian LM. Projecting cancer incidence and deaths to 2030: the unexpected burden of thyroid, liver, and pancreas cancers in the United States. Cancer Res. 2014; 74:2913–21. https://doi.org/10.1158/0008-5472.CAN-14-0155 [PubMed]
- 4. Hidalgo M. Pancreatic cancer. N Engl J Med. 2010; 362:1605–17. https://doi.org/10.1056/NEJMra0901557 [PubMed]
- 5. Wolfgang CL, Herman JM, Laheru DA, Klein AP, Erdek MA, Fishman EK, Hruban RH. Recent progress in pancreatic cancer. CA Cancer J Clin. 2013; 63:318–48. https://doi.org/10.3322/caac.21190 [PubMed]
- 6. Crowley E, Di Nicolantonio F, Loupakis F, Bardelli A. Liquid biopsy: monitoring cancer-genetics in the blood. Nat Rev Clin Oncol. 2013; 10:472–84. https://doi.org/10.1038/nrclinonc.2013.110 [PubMed]
- 7. Marrugo-Ramírez J, Mir M, Samitier J. Blood-based cancer biomarkers in liquid biopsy: a promising non-invasive alternative to tissue biopsy. Int J Mol Sci. 2018; 19:2877. https://doi.org/10.3390/ijms19102877 [PubMed]
- 8. Husain H, Velculescu VE. Cancer DNA in the circulation: the liquid biopsy. JAMA. 2017; 318:1272–74. https://doi.org/10.1001/jama.2017.12131 [PubMed]
- 9. Yang KS, Im H, Hong S, Pergolini I, Del Castillo AF, Wang R, Clardy S, Huang CH, Pille C, Ferrone S, Yang R, Castro CM, Lee H, et al. Multiparametric plasma EV profiling facilitates diagnosis of pancreatic Malignancy. Sci Transl Med. 2017; 9:eaal3226. https://doi.org/10.1126/scitranslmed.aal3226 [PubMed]
- 10. Yang Z, LaRiviere MJ, Ko J, Till JE, Christensen T, Yee SS, Black TA, Tien K, Lin A, Shen H, Bhagwat N, Herman D, Adallah A, et al. A multianalyte panel consisting of extracellular vesicle miRNAs and mRNAs, cfDNA, and CA19-9 shows utility for diagnosis and staging of pancreatic ductal adenocarcinoma. Clin Cancer Res. 2020; 26:3248–58. https://doi.org/10.1158/1078-0432.CCR-19-3313 [PubMed]
- 11. Stroun M, Maurice P, Vasioukhin V, Lyautey J, Lederrey C, Lefort F, Rossier A, Chen XQ, Anker P. The origin and mechanism of circulating DNA. Ann N Y Acad Sci. 2000; 906:161–68. https://doi.org/10.1111/j.1749-6632.2000.tb06608.x [PubMed]
- 12. De Rubis G, Rajeev Krishnan S, Bebawy M. Liquid biopsies in cancer diagnosis, monitoring, and prognosis. Trends Pharmacol Sci. 2019; 40:172–86. https://doi.org/10.1016/j.tips.2019.01.006 [PubMed]
- 13. Siravegna G, Marsoni S, Siena S, Bardelli A. Integrating liquid biopsies into the management of cancer. Nat Rev Clin Oncol. 2017; 14:531–48. https://doi.org/10.1038/nrclinonc.2017.14 [PubMed]
- 14. Wan JC, Massie C, Garcia-Corbacho J, Mouliere F, Brenton JD, Caldas C, Pacey S, Baird R, Rosenfeld N. Liquid biopsies come of age: towards implementation of circulating tumour DNA. Nat Rev Cancer. 2017; 17:223–38. https://doi.org/10.1038/nrc.2017.7 [PubMed]
- 15. Cohen JD, Javed AA, Thoburn C, Wong F, Tie J, Gibbs P, Schmidt CM, Yip-Schneider MT, Allen PJ, Schattner M, Brand RE, Singhi AD, Petersen GM, et al. Combined circulating tumor DNA and protein biomarker-based liquid biopsy for the earlier detection of pancreatic cancers. Proc Natl Acad Sci USA. 2017; 114:10202–07. https://doi.org/10.1073/pnas.1704961114 [PubMed]
- 16. Samandari M, Julia MG, Rice A, Chronopoulos A, Del Rio Hernandez AE. Liquid biopsies for management of pancreatic cancer. Transl Res. 2018; 201:98–127. https://doi.org/10.1016/j.trsl.2018.07.008 [PubMed]
- 17. Lee JS, Park SS, Lee YK, Norton JA, Jeffrey SS. Liquid biopsy in pancreatic ductal adenocarcinoma: current status of circulating tumor cells and circulating tumor DNA. Mol Oncol. 2019; 13:1623–50. https://doi.org/10.1002/1878-0261.12537 [PubMed]
- 18. Chen H, Tu H, Meng ZQ, Chen Z, Wang P, Liu LM. K-ras mutational status predicts poor prognosis in unresectable pancreatic cancer. Eur J Surg Oncol. 2010; 36:657–62. https://doi.org/10.1016/j.ejso.2010.05.014 [PubMed]
- 19. Cheng H, Liu C, Jiang J, Luo G, Lu Y, Jin K, Guo M, Zhang Z, Xu J, Liu L, Ni Q, Yu X. Analysis of ctDNA to predict prognosis and monitor treatment responses in metastatic pancreatic cancer patients. Int J Cancer. 2017; 140:2344–2350. https://doi.org/10.1002/ijc.30650 [PubMed]
- 20. Cheng H, Luo G, Jin K, Fan Z, Huang Q, Gong Y, Xu J, Yu X, Liu C. Kras mutation correlating with circulating regulatory T cells predicts the prognosis of advanced pancreatic cancer patients. Cancer Med. 2020; 9:2153–59. https://doi.org/10.1002/cam4.2895 [PubMed]
- 21. Nakano Y, Kitago M, Matsuda S, Nakamura Y, Fujita Y, Imai S, Shinoda M, Yagi H, Abe Y, Hibi T, Fujii-Nishimura Y, Takeuchi A, Endo Y, et al. KRAS mutations in cell-free DNA from preoperative and postoperative sera as a pancreatic cancer marker: a retrospective study. Br J Cancer. 2018; 118:662–69. https://doi.org/10.1038/bjc.2017.479 [PubMed]
- 22. Watanabe F, Suzuki K, Tamaki S, Abe I, Endo Y, Takayama Y, Ishikawa H, Kakizawa N, Saito M, Futsuhara K, Noda H, Konishi F, Rikiyama T. Longitudinal monitoring of KRAS-mutated circulating tumor DNA enables the prediction of prognosis and therapeutic responses in patients with pancreatic cancer. PLoS One. 2019; 14:e0227366. https://doi.org/10.1371/journal.pone.0227366 [PubMed]
- 23. Castells A, Puig P, Móra J, Boadas J, Boix L, Urgell E, Solé M, Capellà G, Lluís F, Fernández-Cruz L, Navarro S, Farré A. K-ras mutations in DNA extracted from the plasma of patients with pancreatic carcinoma: diagnostic utility and prognostic significance. J Clin Oncol. 1999; 17:578–84. https://doi.org/10.1200/JCO.1999.17.2.578 [PubMed]
- 24. Earl J, Garcia-Nieto S, Martinez-Avila JC, Montans J, Sanjuanbenito A, Rodríguez-Garrote M, Lisa E, Mendía E, Lobo E, Malats N, Carrato A, Guillen-Ponce C. Circulating tumor cells (Ctc) and kras mutant circulating free Dna (cfdna) detection in peripheral blood as biomarkers in patients diagnosed with exocrine pancreatic cancer. BMC Cancer. 2015; 15:797. https://doi.org/10.1186/s12885-015-1779-7 [PubMed]
- 25. Kinugasa H, Nouso K, Miyahara K, Morimoto Y, Dohi C, Tsutsumi K, Kato H, Matsubara T, Okada H, Yamamoto K. Detection of K-ras gene mutation by liquid biopsy in patients with pancreatic cancer. Cancer. 2015; 121:2271–80. https://doi.org/10.1002/cncr.29364 [PubMed]
- 26. Takai E, Totoki Y, Nakamura H, Morizane C, Nara S, Hama N, Suzuki M, Furukawa E, Kato M, Hayashi H, Kohno T, Ueno H, Shimada K, et al. Clinical utility of circulating tumor DNA for molecular assessment in pancreatic cancer. Sci Rep. 2015; 5:18425. https://doi.org/10.1038/srep18425 [PubMed]
- 27. Hadano N, Murakami Y, Uemura K, Hashimoto Y, Kondo N, Nakagawa N, Sueda T, Hiyama E. Prognostic value of circulating tumour DNA in patients undergoing curative resection for pancreatic cancer. Br J Cancer. 2016; 115:59–65. https://doi.org/10.1038/bjc.2016.175 [PubMed]
- 28. Tjensvoll K, Lapin M, Buhl T, Oltedal S, Steen-Ottosen Berry K, Gilje B, Søreide JA, Javle M, Nordgård O, Smaaland R. Clinical relevance of circulating KRAS mutated DNA in plasma from patients with advanced pancreatic cancer. Mol Oncol. 2016; 10:635–43. https://doi.org/10.1016/j.molonc.2015.11.012 [PubMed]
- 29. Adamo P, Cowley CM, Neal CP, Mistry V, Page K, Dennison AR, Isherwood J, Hastings R, Luo J, Moore DA, Howard PJ, Miguel ML, Pritchard C, et al. Profiling tumour heterogeneity through circulating tumour DNA in patients with pancreatic cancer. Oncotarget. 2017; 8:87221–33. https://doi.org/10.18632/oncotarget.20250 [PubMed]
- 30. Chen I, Raymond VM, Geis JA, Collisson EA, Jensen BV, Hermann KL, Erlander MG, Tempero M, Johansen JS. Ultrasensitive plasma ctDNA KRAS assay for detection, prognosis, and assessment of therapeutic response in patients with unresectable pancreatic ductal adenocarcinoma. Oncotarget. 2017; 8:97769–86. https://doi.org/10.18632/oncotarget.22080 [PubMed]
- 31. Pietrasz D, Pécuchet N, Garlan F, Didelot A, Dubreuil O, Doat S, Imbert-Bismut F, Karoui M, Vaillant JC, Taly V, Laurent-Puig P, Bachet JB. Plasma Circulating Tumor DNA in Pancreatic Cancer Patients Is a Prognostic Marker. Clin Cancer Res. 2017; 23:116–123. https://doi.org/10.1158/1078-0432.CCR-16-0806 [PubMed]
- 32. Kim MK, Woo SM, Park B, Yoon KA, Kim YH, Joo J, Lee WJ, Han SS, Park SJ, Kong SY. Prognostic implications of multiplex detection of KRAS mutations in cell-free DNA from patients with pancreatic ductal adenocarcinoma. Clin Chem. 2018; 64:726–34. https://doi.org/10.1373/clinchem.2017.283721 [PubMed]
- 33. Lin M, Alnaggar M, Liang S, Chen J, Xu K, Dong S, Du D, Niu L. Circulating tumor DNA as a sensitive marker in patients undergoing irreversible electroporation for pancreatic cancer. Cell Physiol Biochem. 2018; 47:1556–64. https://doi.org/10.1159/000490874 [PubMed]
- 34. Perets R, Greenberg O, Shentzer T, Semenisty V, Epelbaum R, Bick T, Sarji S, Ben-Izhak O, Sabo E, Hershkovitz D. Mutant KRAS circulating tumor DNA is an accurate tool for pancreatic cancer monitoring. Oncologist. 2018; 23:566–72. https://doi.org/10.1634/theoncologist.2017-0467 [PubMed]
- 35. Yang X, Xu W, Tian X, Wu J, Lv A, Li C, Guan X, Qian H, Hao C. Diagnostic and prognostic value of KRAS mutations in circulating pancreatic ductal adenocarcinoma tumor DNA. Translational Cancer Research. 2018; 7:622–33. https://doi.org/10.21037/tcr.2018.05.33
- 36. Bernard V, Kim DU, San Lucas FA, Castillo J, Allenson K, Mulu FC, Stephens BM, Huang J, Semaan A, Guerrero PA, Kamyabi N, Zhao J, Hurd MW, et al. Circulating nucleic acids are associated with outcomes of patients with pancreatic cancer. Gastroenterology. 2019; 156:108–18.e4. https://doi.org/10.1053/j.gastro.2018.09.022 [PubMed]
- 37. Groot VP, Mosier S, Javed AA, Teinor JA, Gemenetzis G, Ding D, Haley LM, Yu J, Burkhart RA, Hasanain A, Debeljak M, Kamiyama H, Narang A, et al. Circulating tumor DNA as a clinical test in resected pancreatic cancer. Clin Cancer Res. 2019; 25:4973–84. https://doi.org/10.1158/1078-0432.CCR-19-0197 [PubMed]
- 38. Lee B, Lipton L, Cohen J, Tie J, Javed AA, Li L, Goldstein D, Burge M, Cooray P, Nagrial A, Tebbutt NC, Thomson B, Nikfarjam M, et al. Circulating tumor DNA as a potential marker of adjuvant chemotherapy benefit following surgery for localized pancreatic cancer. Ann Oncol. 2019; 30:1472–78. https://doi.org/10.1093/annonc/mdz200 [PubMed]
- 39. Mohan S, Ayub M, Rothwell DG, Gulati S, Kilerci B, Hollebecque A, Sun Leong H, Smith NK, Sahoo S, Descamps T, Zhou C, Hubner RA, McNamara MG, et al. Analysis of circulating cell-free DNA identifies KRAS copy number gain and mutation as a novel prognostic marker in pancreatic cancer. Sci Rep. 2019; 9:11610. https://doi.org/10.1038/s41598-019-47489-7 [PubMed]
- 40. Patel H, Okamura R, Fanta P, Patel C, Lanman RB, Raymond VM, Kato S, Kurzrock R. Clinical correlates of blood-derived circulating tumor DNA in pancreatic cancer. J Hematol Oncol. 2019; 12:130. https://doi.org/10.1186/s13045-019-0824-4 [PubMed]
- 41. Strijker M, Soer EC, de Pastena M, Creemers A, Balduzzi A, Beagan JJ, Busch OR, van Delden OM, Halfwerk H, van Hooft JE, van Lienden KP, Marchegiani G, Meijer SL, et al. Circulating tumor DNA quantity is related to tumor volume and both predict survival in metastatic pancreatic ductal adenocarcinoma. Int J Cancer. 2020; 146:1445–56. https://doi.org/10.1002/ijc.32586 [PubMed]
- 42. Guo S, Shi X, Shen J, Gao S, Wang H, Shen S, Pan Y, Li B, Xu X, Shao Z, Jin G. Preoperative detection of KRAS G12D mutation in ctDNA is a powerful predictor for early recurrence of resectable PDAC patients. Br J Cancer. 2020; 122:857–67. https://doi.org/10.1038/s41416-019-0704-2 [PubMed]
- 43. Schlitter AM, Segler A, Steiger K, Michalski CW, Jäger C, Konukiewitz B, Pfarr N, Endris V, Bettstetter M, Kong B, Regel I, Kleeff J, Klöppel G, Esposito I. Molecular, morphological and survival analysis of 177 resected pancreatic ductal adenocarcinomas (PDACs): identification of prognostic subtypes. Sci Rep. 2017; 7:41064. https://doi.org/10.1038/srep41064 [PubMed]
- 44. Balaban EP, Mangu PB, Khorana AA, Shah MA, Mukherjee S, Crane CH, Javle MM, Eads JR, Allen P, Ko AH, Engebretson A, Herman JM, Strickler JH, Benson AB
3rd , Urba S, Yee NS. Locally Advanced, Unresectable Pancreatic Cancer: American Society of Clinical Oncology Clinical Practice Guideline. J Clin Oncol. 2016; 34:2654–68. https://doi.org/10.1200/JCO.2016.67.5561 [PubMed] - 45. Sohal DP, Kennedy EB, Khorana A, Copur MS, Crane CH, Garrido-Laguna I, Krishnamurthi S, Moravek C, O’Reilly EM, Philip PA, Ramanathan RK, Ruggiero JT, Shah MA, et al. Metastatic pancreatic cancer: ASCO clinical practice guideline update. J Clin Oncol. 2018; 36:2545–56. https://doi.org/10.1200/JCO.2018.78.9636 [PubMed]
- 46. Khorana AA, McKernin SE, Berlin J, Hong TS, Maitra A, Moravek C, Mumber M, Schulick R, Zeh HJ, Katz MH. Potentially curable pancreatic adenocarcinoma: ASCO clinical practice guideline update. J Clin Oncol. 2019; 37:2082–88. https://doi.org/10.1200/JCO.19.00946 [PubMed]
- 47. Merker JD, Oxnard GR, Compton C, Diehn M, Hurley P, Lazar AJ, Lindeman N, Lockwood CM, Rai AJ, Schilsky RL, Tsimberidou AM, Vasalos P, Billman BL, et al. Circulating Tumor DNA Analysis in Patients With Cancer: American Society of Clinical Oncology and College of American Pathologists Joint Review. J Clin Oncol. 2018; 36:1631–1641. https://doi.org/10.1200/JCO.2017.76.8671 [PubMed]
- 48. Yoon C, Till J, Cho SJ, Chang KK, Lin JX, Huang CM, Ryeom S, Yoon SS. KRAS activation in gastric adenocarcinoma stimulates epithelial-to-mesenchymal transition to cancer stem-like cells and promotes metastasis. Mol Cancer Res. 2019; 17:1945–57. https://doi.org/10.1158/1541-7786.MCR-19-0077 [PubMed]
- 49. Henriksen SD, Madsen PH, Larsen AC, Johansen MB, Pedersen IS, Krarup H, Thorlacius-Ussing O. Cell-free DNA promoter hypermethylation in plasma as a predictive marker for survival of patients with pancreatic adenocarcinoma. Oncotarget. 2017; 8:93942–56. https://doi.org/10.18632/oncotarget.21397 [PubMed]
- 50. Moher D, Liberati A, Tetzlaff J, Altman DG, and PRISMA Group. Preferred reporting items for systematic reviews and meta-analyses: the PRISMA statement. Int J Surg. 2010; 8:336–41. https://doi.org/10.1016/j.ijsu.2010.02.007 [PubMed]
- 51. Parmar MK, Torri V, Stewart L. Extracting summary statistics to perform meta-analyses of the published literature for survival endpoints. Stat Med. 1998; 17:2815–34. https://doi.org/10.1002/(sici)1097-0258(19981230)17:24<2815::aid-sim110>3.0.co;2-8 [PubMed]
- 52. Tierney JF, Stewart LA, Ghersi D, Burdett S, Sydes MR. Practical methods for incorporating summary time-to-event data into meta-analysis. Trials. 2007; 8:16. https://doi.org/10.1186/1745-6215-8-16 [PubMed]
- 53. Margulis AV, Pladevall M, Riera-Guardia N, Varas-Lorenzo C, Hazell L, Berkman ND, Viswanathan M, Perez-Gutthann S. Quality assessment of observational studies in a drug-safety systematic review, comparison of two tools: the newcastle-ottawa scale and the RTI item bank. Clin Epidemiol. 2014; 6:359–68. https://doi.org/10.2147/CLEP.S66677 [PubMed]