


Introduction
Lung cancer is the leading cause of death globally, approximately 2.1 million new cases and 1.8 million deaths occurred in 2018 [1]. These cases were mainly non-small cell lung cancer (NSCLC), which is divided into different histological categories. Among them, lung adenocarcinoma (LUAD) is the most prevalent subtype [2]. Although multimodal treatment strategies, including immunotherapy, radiotherapy, and non-invasive surgical resection have greatly advanced in recent decades, the outcomes of curing lung cancer remain unsatisfactory and the five-year relative overall survival rate is approximately 18% [3].
Improvements in molecular pathology detection methods and targeted therapies have markedly increased the overall survival of patients with LUAD based on the emerging concept of “precision medicine” in recent years [4]. In precision medicine, key genes driving carcinogenesis can be considered as therapeutic targets. Frequently reported molecules used in pathology detection and as therapeutic targets in adenocarcinoma include epidermal growth factor receptor mutations, echinoderm microtubule-associated protein-like gene, and anaplastic lymphoma kinase gene [5–8]. Although molecularly targeted therapies have shown good clinical results [9–11], curing patients with LUAD remains challenging, particularly because of the development of drug resistance [12, 13]. Therefore, it is necessary to identify more effective indicators for molecular pathology diagnosis and prognosis prediction in patients with LUAD.
Ribonucleotide reductase M2 subunit (RRM2), a rate-limiting enzyme involved in DNA synthesis and damage repair, plays vital roles in many critical cellular processes such as cell proliferation, invasiveness, migration, and senescence [14]. RRM2 functions as a tumor driver is frequently overexpressed in various malignancies [15, 16]. Lu et al. found that the expression level of RRM2 is correlated with invasion depth, poorer differentiation, and tumor metastasis in patients with colorectal carcinoma [17]. RRM2 knockdown attenuated melanoma growth both in vitro and in vivo, which was correlated with maintenance of senescence-associated cell-cycle arrest [18]. Hsu et al. found that RRM2 was positively correlated with tumor grade, and patients with early stage NSCLC with RRM2-low tumors had better outcomes [19]. These findings indicate RRM2 may not only function as an oncogene, but also is a promising biomarker for molecular pathology diagnosis and prognosis prediction in patients with LUAD.
This study was conducted to assess the prognostic significance of RRM2 gene expression in LUAD through bioinformatics analysis of the clinical features and survival information from The Cancer Genome Atlas (TCGA). We also performed in vitro experiment to investigate the effect of RRM2 expression on cell proliferation and invasion of LUAD cells and related key signaling pathways. Our results demonstrated that RRM2 is useful for predicting the prognosis of patients with LUAD and that high expression of RRM2 is associated with poor prognosis in these patients.
Results
Baseline characteristics of patients
A total of 503 patients with the required clinical features were acquired from TCGA data portal in April 2019. The detailed clinical features are listed in Table 1. Among the 503 participants, 233 were male (46.3%) and 270 were female (53.7%). The median age of all participants was 65 years. In terms of LUAD stage, 268 patients were stage I (54.1%), 120 patients were stage II (24.2%), 81 patients were stage III (16.4%), and 26 patients were stage IV (5.3%). The cancer status included 105 patients with tumors (26.0%) and 301 tumor-free patients (74.0%). The median follow-up of the 503 patients with LUAD was 25.3 months (rang 0–227 months).
Table 1. Clinical characteristics of the lung adenocarcinoma patients.
| Clinical characteristics | N | (%) | |
| Age (years) | <65 | 223 | 44.3 |
| >=65 | 280 | 55.7 | |
| Gender | Female | 270 | 53.7 |
| Male | 233 | 46.3 | |
| Race | Asian | 9 | 2.0 |
| non-Asian | 446 | 98.0 | |
| Stage | I | 268 | 54.1 |
| II | 120 | 24.2 | |
| III | 81 | 16.4 | |
| IV | 26 | 5.3 | |
| Smoking status | Current smoker | 118 | 24.1 |
| Ever smoker | 301 | 61.2 | |
| Never smoker | 70 | 14.7 | |
| T classification | T1 | 171 | 33.2 |
| T2 | 265 | 53.0 | |
| T3 | 45 | 9.0 | |
| T4 | 19 | 3.8 | |
| M classification | M0 | 334 | 93.0 |
| M1 | 25 | 7.0 | |
| N classification | N0 | 323 | 66.1 |
| N1 | 95 | 19.4 | |
| N2 | 71 | 14.5 | |
| Location in lung | Central | 64 | 36.8 |
| Peripheral | 110 | 63.2 | |
| Radiation therapy | Yes | 13 | 8.3 |
| No | 144 | 91.7 | |
| New tumor event after initial treatment | Yes | 31 | 16.6 |
| No | 156 | 83.4 | |
| EGFR mutation | Yes | 80 | 29.4 |
| No | 192 | 70.6 | |
| KRAS mutation | Yes | 21 | 35.0 |
| No | 39 | 65.0 | |
| EML4-ALK translocation | Yes | 34 | 14.0 |
| No | 208 | 86.0 | |
| Person neoplasm cancer status | With tumor | 106 | 26.0 |
| Tumor free | 301 | 74.0 | |
| Primary therapy outcomes | SD+PD | 19 | 12.6 |
| CR+PR | 132 | 87.4 |
High RRM2 expression in LUAD
To assess the status of RRM2 expression in LUAD patients, we compared the expression level to that in normal lung tissues. The results demonstrated that RRM2 gene expression level was significantly higher in LUAD tissues (p = 3.99e-32) that in normal tissues (Figure 1A). The results were verified in LUAD tissues and paired normal lung tissues (p = 3.35e-18) (Figure 1B).
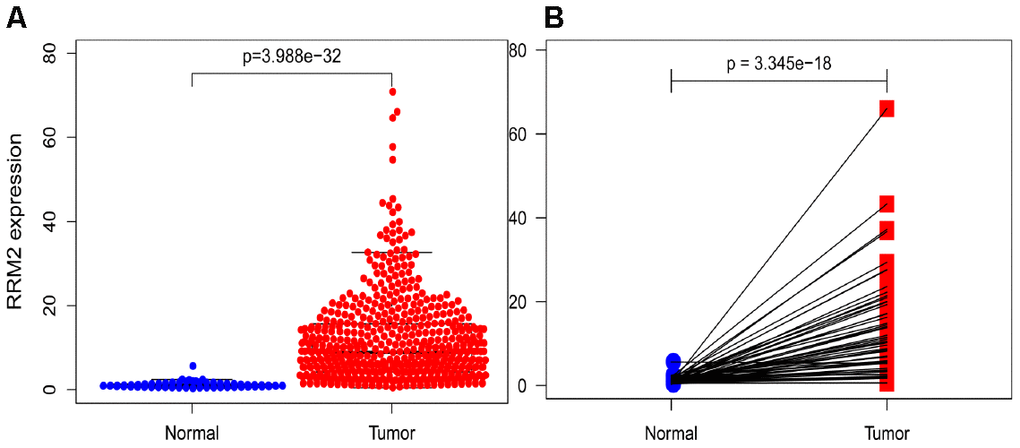
Figure 1. RRM2 expression in lung adenocarcinoma tissues. (A) RRM2 expression in normal and tumor tissues. (B) RRM2 expression in paired tissues.
Correlation between RRM2 expression and clinical features
The association identified between RRM2 expression and clinical features in patients with LUAD is summarized in Table 2. High expression of RRM2 was significantly correlated with age (p = 0.006), clinical stage (p = 1.30e-05), T classification (p = 7.37e-04), M classification (p = 0.017), N classification (p = 1.15e-05), cancer status (p = 5.51e-04), new tumor event after initial treatment (p = 0.043), and smoking status (p = 1.81e-06), as shown in Figure 2. However, high expression of RRM2 was not significantly correlated with other clinical features (Supplementary Figure 1A–1G). Univariate analysis using logistic regression demonstrated that RRM2 gene expression was a categorical dependent variable associated with poor prognostic clinical features (Table 2). High expression of RRM2 was significantly associated with clinical stage (IV vs. I: OR = 0.012, 95% confidence interval [CI] = 1.31–7.58, p = 0.012), T classification (T2 vs. T1: OR = 1.88, 95%CI = 1.28–2.79, p = 0.001), and cancer status (OR = 1.73, 95%CI = 1.12–2.71, p = 0.014).
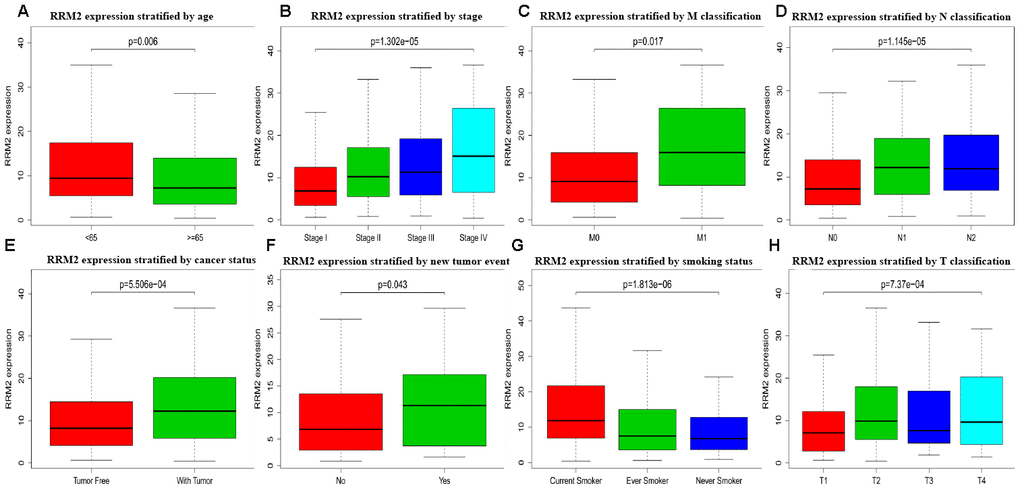
Figure 2. Box plot evaluating RRM2 expression of patients with lung adenocarcinoma according to different clinical characteristics. (A) Age; (B) Clinical stage; (C) M classification; (D) N classification; (E) Cancer status; (F) New tumor event; (G) Smoking status; (H) T classification.
Table 2. Logistic analysis of the association between RRM2 expression and clinical characteristics.
| Clinical characteristics | Total (N) | RRM2 expression | |||||||||||||||||||||||||||||||||||||||||||||||||||||||||||||||||||||||||||||||||||||||||||||||||
| OR | 95%CI | p-Value | |||||||||||||||||||||||||||||||||||||||||||||||||||||||||||||||||||||||||||||||||||||||||||||||||
| Age (>=65 vs. <65) | 503 | 0.72 | 0.50-1.03 | 0.071 | |||||||||||||||||||||||||||||||||||||||||||||||||||||||||||||||||||||||||||||||||||||||||||||||
| Gender (Male vs. Female) | 503 | 1.36 | 0.96-1.93 | 0.085 | |||||||||||||||||||||||||||||||||||||||||||||||||||||||||||||||||||||||||||||||||||||||||||||||
| Race (non-Asian vs. Asian) | 455 | 0.99 | 0.23-4.26 | 0.995 | |||||||||||||||||||||||||||||||||||||||||||||||||||||||||||||||||||||||||||||||||||||||||||||||
| Stage | 495 | ||||||||||||||||||||||||||||||||||||||||||||||||||||||||||||||||||||||||||||||||||||||||||||||||||
| I | Reference | ||||||||||||||||||||||||||||||||||||||||||||||||||||||||||||||||||||||||||||||||||||||||||||||||||
| II | 1.56 | 1.01-2.40 | 0.043 | ||||||||||||||||||||||||||||||||||||||||||||||||||||||||||||||||||||||||||||||||||||||||||||||||
| III | 2.18 | 1.33-3.63 | 0.002 | ||||||||||||||||||||||||||||||||||||||||||||||||||||||||||||||||||||||||||||||||||||||||||||||||
| IV | 3.02 | 1.31-7.58 | 0.012 | ||||||||||||||||||||||||||||||||||||||||||||||||||||||||||||||||||||||||||||||||||||||||||||||||
| Smoking status | 489 | ||||||||||||||||||||||||||||||||||||||||||||||||||||||||||||||||||||||||||||||||||||||||||||||||||
| Current smoker | Reference | ||||||||||||||||||||||||||||||||||||||||||||||||||||||||||||||||||||||||||||||||||||||||||||||||||
| Ever smoker | 0.40 | 0.25-0.62 | 4.66e-05 | ||||||||||||||||||||||||||||||||||||||||||||||||||||||||||||||||||||||||||||||||||||||||||||||||
| Never smoker | 0.33 | 0.18-0.60 | <0.001 | ||||||||||||||||||||||||||||||||||||||||||||||||||||||||||||||||||||||||||||||||||||||||||||||||
| T (T2 vs. T1) | 436 | 1.88 | 1.28-2.79 | 0.001 | |||||||||||||||||||||||||||||||||||||||||||||||||||||||||||||||||||||||||||||||||||||||||||||||
| M (M1 vs. M0) | 359 | 2.25 | 0.97-5.65 | 0.066 | |||||||||||||||||||||||||||||||||||||||||||||||||||||||||||||||||||||||||||||||||||||||||||||||
| N classification | 489 | ||||||||||||||||||||||||||||||||||||||||||||||||||||||||||||||||||||||||||||||||||||||||||||||||||
| N0 | Reference | ||||||||||||||||||||||||||||||||||||||||||||||||||||||||||||||||||||||||||||||||||||||||||||||||||
| N1 | 1.78 | 1.12-2.83 | 0.015 | ||||||||||||||||||||||||||||||||||||||||||||||||||||||||||||||||||||||||||||||||||||||||||||||||
| N2 | 2.69 | 1.59-4.65 | <0.001 | ||||||||||||||||||||||||||||||||||||||||||||||||||||||||||||||||||||||||||||||||||||||||||||||||
| Location (central vs. peripheral) | 174 | 1.60 | 0.87-2.97 | 0.135 | |||||||||||||||||||||||||||||||||||||||||||||||||||||||||||||||||||||||||||||||||||||||||||||||
| Radiation therapy (yes vs. no) | 157 | 2.42 | 0.75-9.25 | 0.158 | |||||||||||||||||||||||||||||||||||||||||||||||||||||||||||||||||||||||||||||||||||||||||||||||
| New tumor event after initial treatment (yes vs. no) | 187 | 2.28 | 1.02-5.37 | 0.049 | |||||||||||||||||||||||||||||||||||||||||||||||||||||||||||||||||||||||||||||||||||||||||||||||
| EGFR mutation (yes vs. no) | 272 | 0.76 | 0.45-1.28 | 0.306 | |||||||||||||||||||||||||||||||||||||||||||||||||||||||||||||||||||||||||||||||||||||||||||||||
| KRAS mutation (yes vs. no) | 62 | 0.50 | 0.17-1.40 | 0.191 | |||||||||||||||||||||||||||||||||||||||||||||||||||||||||||||||||||||||||||||||||||||||||||||||
| EML4-ALK translocation (yes vs. no) | 242 | 1.16 | 0.56-2.41 | 0.692 | |||||||||||||||||||||||||||||||||||||||||||||||||||||||||||||||||||||||||||||||||||||||||||||||
| Person neoplasm cancer status (with tumor vs tumor free) | 407 | 1.73 | 1.12-2.71 | 0.014 | |||||||||||||||||||||||||||||||||||||||||||||||||||||||||||||||||||||||||||||||||||||||||||||||
| Primary therapy outcomes (SD+PD vs. CR+PR) | 151 | 1.44 | 0.55-3.94 | 0.463 | |||||||||||||||||||||||||||||||||||||||||||||||||||||||||||||||||||||||||||||||||||||||||||||||
| Abbreviations: OR, odds ratio; CI, confidence interval. | |||||||||||||||||||||||||||||||||||||||||||||||||||||||||||||||||||||||||||||||||||||||||||||||||||
| Bold values indicate P<0.05. | |||||||||||||||||||||||||||||||||||||||||||||||||||||||||||||||||||||||||||||||||||||||||||||||||||
High expression of RRM2 is an independent risk factor for overall survival
Kaplan-Meier survival analysis showed that high RRM2 expression was associated with poor prognosis (p = 7.86e-04), as shown in Figure 3A. Subgroup analysis by different clinical features demonstrated that high RRM2 expression was significantly associated with poor prognosis in LUAD cases more than 65 years old (p = 2.287e-04), clinical stage I/II (p = 0.023), M0 (p = 0.001), N0 (p = 0.031), with tumor (p = 5.617e-04), smoker (p = 0.031), and T1/T2 (p = 0.023), as shown in Figure 3B–3H. Univariate Cox analysis demonstrated that high RRM2 expression was significantly correlated with poor overall survival (hazard ratio [HR] = 1.34, 95%CI = 1.16–1.54, p = 4.86e-05). Multivariate Cox analysis confirmed RRM2 gene expression was an independent risk factor for overall survival in patients with LUAD (HR = 1.29, 95%CI = 1.11–1.50, p < 0.001), as shown in Table 3 and Figure 4.
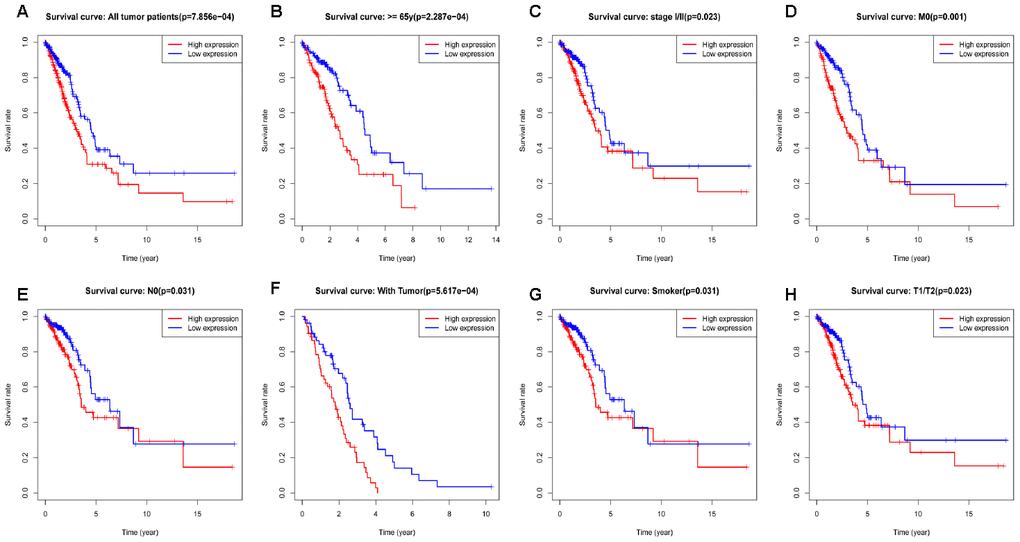
Figure 3. Kaplan-Meier curve for overall survival in lung adenocarcinoma. (A) Kaplan-Meier curve for RRM2 in all tumor patients; (B–H) Subgroup analysis for age greater than 65 years, stage I/II, M0, N0, with tumor, smoker, and T1/T2.
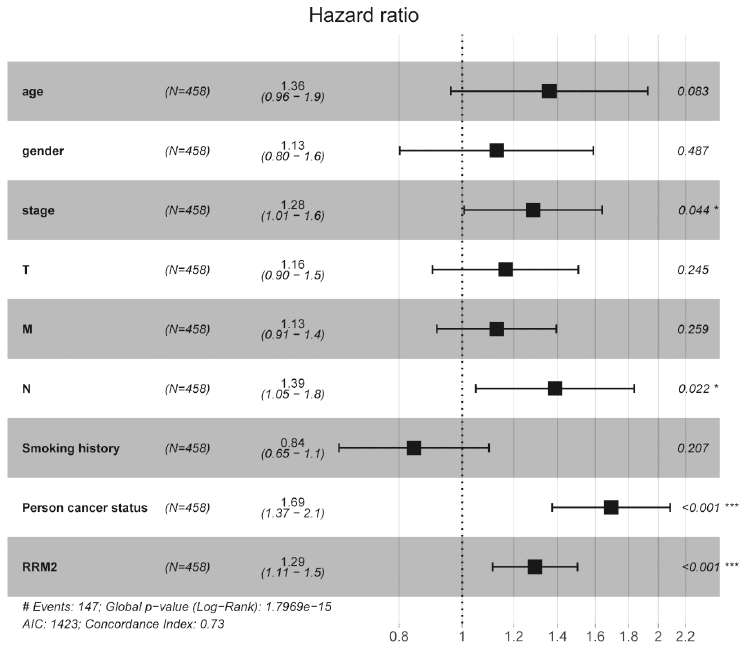
Figure 4. Forest plot of the multivariate Cox regression analysis in lung adenocarcinoma.
Table 3. Univariate and multivariate Cox regression analyses of clinical characteristics associated with overall survival.
| Clinical characteristics | Univariate analysis | Multivariate analysis | |||||||||||||||||||||||||||||||||||||||||||||||||||||||||||||||||||||||||||||||||||||||||||||||||
| HR | 95%CI | p-Value | HR | 95%CI | p-Value | ||||||||||||||||||||||||||||||||||||||||||||||||||||||||||||||||||||||||||||||||||||||||||||||
| Age | 1.18 | 0.86-1.63 | 0.309 | 1.36 | 0.96-1.93 | 0.083 | |||||||||||||||||||||||||||||||||||||||||||||||||||||||||||||||||||||||||||||||||||||||||||||
| Gender | 1.04 | 0.76-1.43 | 0.789 | 1.13 | 0.80-1.59 | 0.487 | |||||||||||||||||||||||||||||||||||||||||||||||||||||||||||||||||||||||||||||||||||||||||||||
| Race | 2.01 | 0.28-14.35 | 0.488 | ||||||||||||||||||||||||||||||||||||||||||||||||||||||||||||||||||||||||||||||||||||||||||||||||
| Stage | 1.67 | 1.44-1.93 | 1.12e-11 | 1.28 | 1.01-1.64 | 0.043 | |||||||||||||||||||||||||||||||||||||||||||||||||||||||||||||||||||||||||||||||||||||||||||||
| Smoking status | 0.92 | 0.72-1.19 | 0.540 | 0.84 | 0.65-1.10 | 0.207 | |||||||||||||||||||||||||||||||||||||||||||||||||||||||||||||||||||||||||||||||||||||||||||||
| T | 1.53 | 1.25-1.86 | 3.12e-05 | 1.16 | 0.90-1.51 | 0.245 | |||||||||||||||||||||||||||||||||||||||||||||||||||||||||||||||||||||||||||||||||||||||||||||
| M | 0.92 | 0.77-1.11 | 0.386 | 1.13 | 0.91-1.39 | 0.259 | |||||||||||||||||||||||||||||||||||||||||||||||||||||||||||||||||||||||||||||||||||||||||||||
| N | 1.72 | 1.44-2.06 | 1.82e-09 | 1.39 | 1.05-1.84 | 0.022 | |||||||||||||||||||||||||||||||||||||||||||||||||||||||||||||||||||||||||||||||||||||||||||||
| Location | 0.95 | 0.57-1.58 | 0.829 | ||||||||||||||||||||||||||||||||||||||||||||||||||||||||||||||||||||||||||||||||||||||||||||||||
| Radiation therapy | 2.87 | 1.32-6.23 | 0.007 | ||||||||||||||||||||||||||||||||||||||||||||||||||||||||||||||||||||||||||||||||||||||||||||||||
| New tumor event after initial treatment | 2.3 | 1.31-4.05 | 0.003 | ||||||||||||||||||||||||||||||||||||||||||||||||||||||||||||||||||||||||||||||||||||||||||||||||
| EGFR mutation | 1.33 | 0.82-2.15 | 0.242 | ||||||||||||||||||||||||||||||||||||||||||||||||||||||||||||||||||||||||||||||||||||||||||||||||
| KRAS mutation | 2.21 | 0.85-5.76 | 0.103 | ||||||||||||||||||||||||||||||||||||||||||||||||||||||||||||||||||||||||||||||||||||||||||||||||
| EML4-ALK translocation | 1.96 | 1.06-3.63 | 0.031 | ||||||||||||||||||||||||||||||||||||||||||||||||||||||||||||||||||||||||||||||||||||||||||||||||
| Primary therapy outcomes | 2.44 | 0.90-6.59 | 0.078 | ||||||||||||||||||||||||||||||||||||||||||||||||||||||||||||||||||||||||||||||||||||||||||||||||
| Person neoplasm cancer status | 4.74 | 3.27-6.87 | 2.08e-16 | 1.69 | 1.37-2.08 | 7.20e-07 | |||||||||||||||||||||||||||||||||||||||||||||||||||||||||||||||||||||||||||||||||||||||||||||
| RRM2 expression | 1.34 | 1.16-1.54 | 4.86e-05 | 1.29 | 1.11-1.50 | <0.001 | |||||||||||||||||||||||||||||||||||||||||||||||||||||||||||||||||||||||||||||||||||||||||||||
| Abbreviations: HR, hazard ratio; CI, confidence interval. | |||||||||||||||||||||||||||||||||||||||||||||||||||||||||||||||||||||||||||||||||||||||||||||||||||
| Bold values indicate P<0.05. | |||||||||||||||||||||||||||||||||||||||||||||||||||||||||||||||||||||||||||||||||||||||||||||||||||
Diagnostic value of RRM2 expression in LUAD
We conducted ROC curve analysis of RRM2 gene expression data to evaluate the diagnostic value of this gene. The area was 0.967, which indicated high diagnostic value, as shown in Figure 5A. Subgroup analysis demonstrated the diagnostic value of RRM2 gene expression in different clinical features of LUAD, with AUC values of 0.966 for stage I/II, 0.974 for stage III/IV, 0.972 for M0, 0.961 for N0, 0.980 for N1-N3, 0.965 for T1/T2, and 0.980 for T3/T4 (Figure 5B–H). Therefore, a nomogram was constructed to predict the 1-, 3-, and 5-year survival probability of patients by combining the expression level of RRM2 with clinical variables (Figure 6).
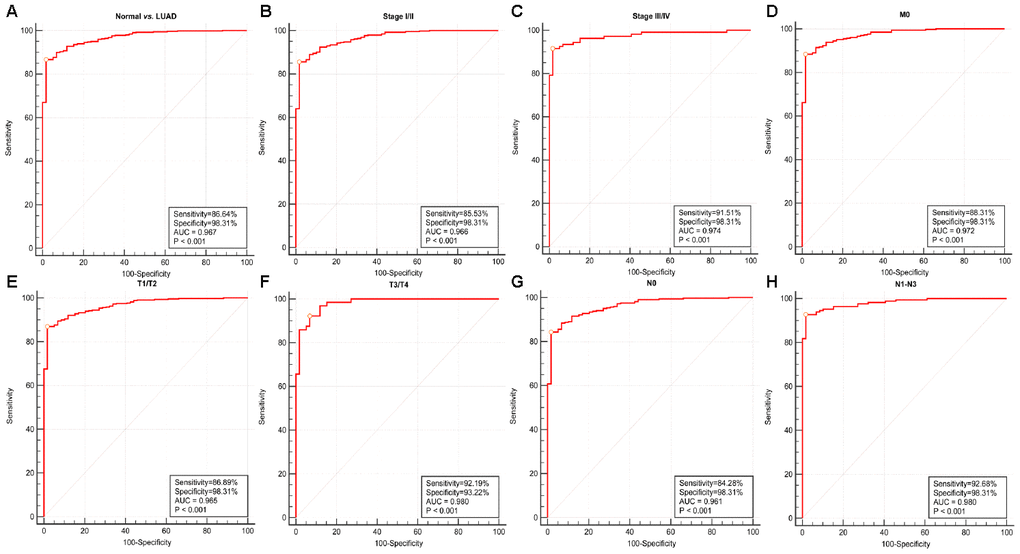
Figure 5. Diagnostic value of RRM2 expression in lung adenocarcinoma. (A) ROC curve for RRM2 in normal lung tissue and LUAD; (B–H) Subgroup analysis for stage I/II, stage III/IV, M0, T1/T2, T3/T4, N0, N1-N3.
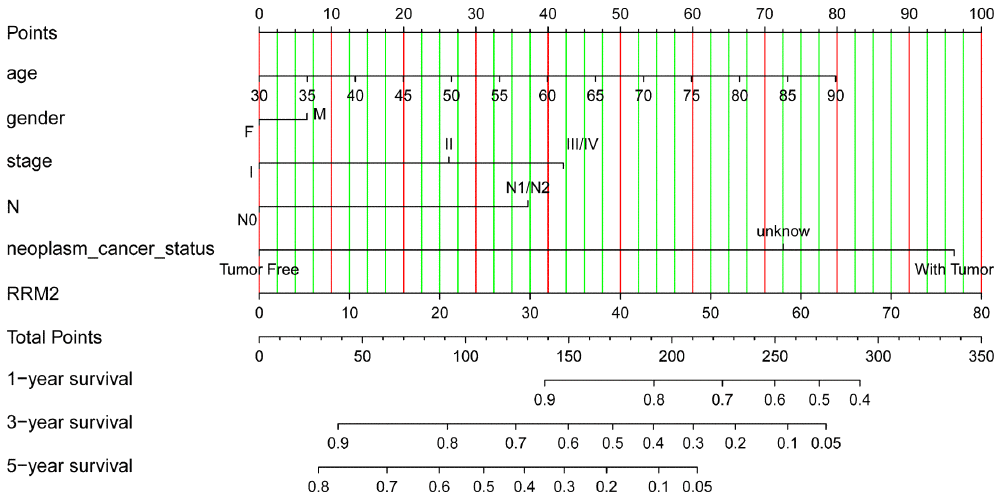
Figure 6. Nomogram for predicting probability of patients with 1-, 3- and 5-year overall survival. For risk estimation, identify the status for each clinical factors and expression value of RRM2, draw a line straight upwards to the Points axis to see the points a single factor yields. Repeat until scores for all factors are decided. Sum the points and locate the summed point on the Total Points axis. Then 1-, 3- and 5year related survival probabilities were obtained by draw a line straight down to the Risk axis.
GSEA identifies a RRM2-related signaling pathway
We performed GSEA using the low- and high-RRM2 expression data sets to identify signaling pathways that are differentially activated in LUAD. GSEA showed a large difference (false discovery rate < 5%, nominal p-value < 25%) MSigDB collection enrichment (c2.cp.kegg.v6.2.symbols.gmt) (Table 4). Gene sets related to cell cycle, p53 signaling pathway, DNA replication, small cell lung cancer, apoptosis, and pathway in cancer showed differential enrichment in the high RRM2 gene expression phenotype (Figure 7).
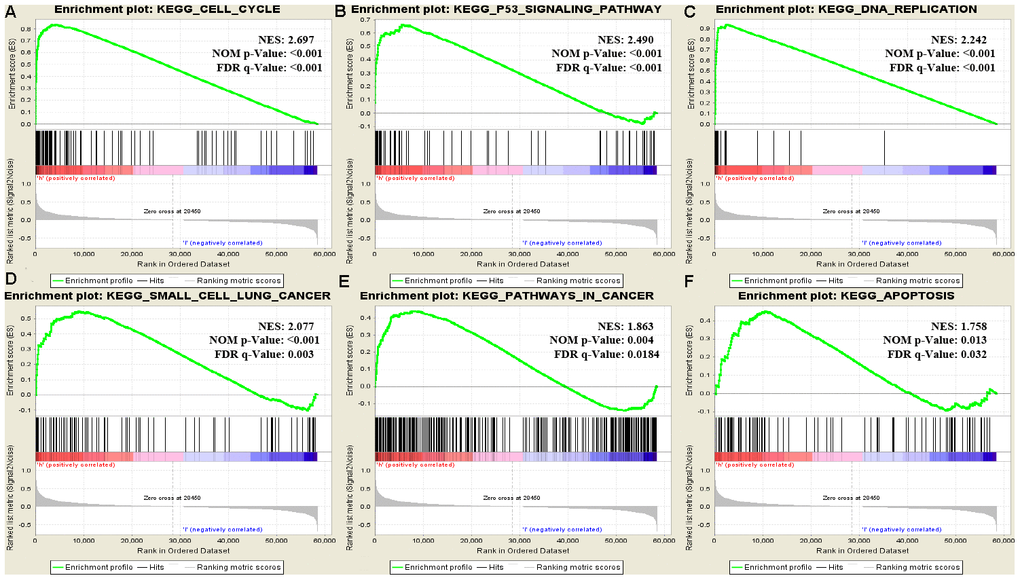
Figure 7. Enrichment plots from GSEA. Gene set enrichment plots of (A) cell cycle, (B) p53 signaling pathway, (C) DNA replication, (D) small cell lung cancer, (E) pathways in cancer, and (F) apoptosis in lung adenocarcinoma cases with high RRM2 expression.
Table 4. Gene sets enriched in the high RRM2 expression phenotype.
| Gene set name | SIZE | ES | NES | NOM p-Val | FDR q-Val | ||||||||||||||||||||||||||||||||||||||||||||||||||||||||||||||||||||||||||||||||||||||||||||||
| KEGG_CELL_CYCLE | 124 | 0.839 | 2.697 | <0.001 | <0.001 | ||||||||||||||||||||||||||||||||||||||||||||||||||||||||||||||||||||||||||||||||||||||||||||||
| KEGG_P53_SIGNALING_PATHWAY | 66 | 0.666 | 2.49 | <0.001 | <0.001 | ||||||||||||||||||||||||||||||||||||||||||||||||||||||||||||||||||||||||||||||||||||||||||||||
| KEGG_DNA_REPLICATION | 36 | 0.942 | 2.242 | <0.001 | 1.56e-04 | ||||||||||||||||||||||||||||||||||||||||||||||||||||||||||||||||||||||||||||||||||||||||||||||
| KEGG_SMALL_CELL_LUNG_CANCER | 84 | 0.553 | 2.077 | <0.001 | 0.003 | ||||||||||||||||||||||||||||||||||||||||||||||||||||||||||||||||||||||||||||||||||||||||||||||
| KEGG_APOPTOSIS | 86 | 0.454 | 1.758 | 0.013 | 0.032 | ||||||||||||||||||||||||||||||||||||||||||||||||||||||||||||||||||||||||||||||||||||||||||||||
| KEGG_PATHWAYS_IN_CANCER | 324 | 0.44 | 1.863 | 0.004 | 0.018 | ||||||||||||||||||||||||||||||||||||||||||||||||||||||||||||||||||||||||||||||||||||||||||||||
| Abbreviations: ES, enrichment score; NES, normalized enrichment score; NOM, nominal; FDR, false discovery rate. | |||||||||||||||||||||||||||||||||||||||||||||||||||||||||||||||||||||||||||||||||||||||||||||||||||
| Gene sets with NOM P-value <0.05 and FDR q-value <0.25 were considered as significantly enriched. | |||||||||||||||||||||||||||||||||||||||||||||||||||||||||||||||||||||||||||||||||||||||||||||||||||
Validation using independent external database
We further validated the repeatability and portability of RRM2 expression in the prognostic effect of LUAD patients by using two other independent external datasets, including GSE30219 and GSE50081. In the validation set GSE30219, Kaplan-Meier survival analysis revealed that patients with increased RRM2 expression had shorter OS (Figure 8A–8D). The prognostic value of RRM2 was also demonstrated in patients with LUAD using GSE50081 (Figure 8E–8H). Meanwhile, the diagnostic value of RRM2 was also demonstrated in patients with LUAD using GSE30219 (Supplementary Figure 1H). Consistent with these results, RRM2 was found to be significantly over-expressed in LUAD by using five distinct LUAD datasets (Garber Lung, Hou Lung, Landi Lung, Okayama Lung, and Su Lung) via pooled analysis in the Oncomine database [20–24], and significant over-expression was also found in the TIMER database (Figure 9A–9C). Interestingly, high RRM2 gene expression is frequently detected in numerous human solid tumors, such as lung cancer, colorectal cancer, breast cancer, bladder cancer, and others (Figure 9A, 9C).
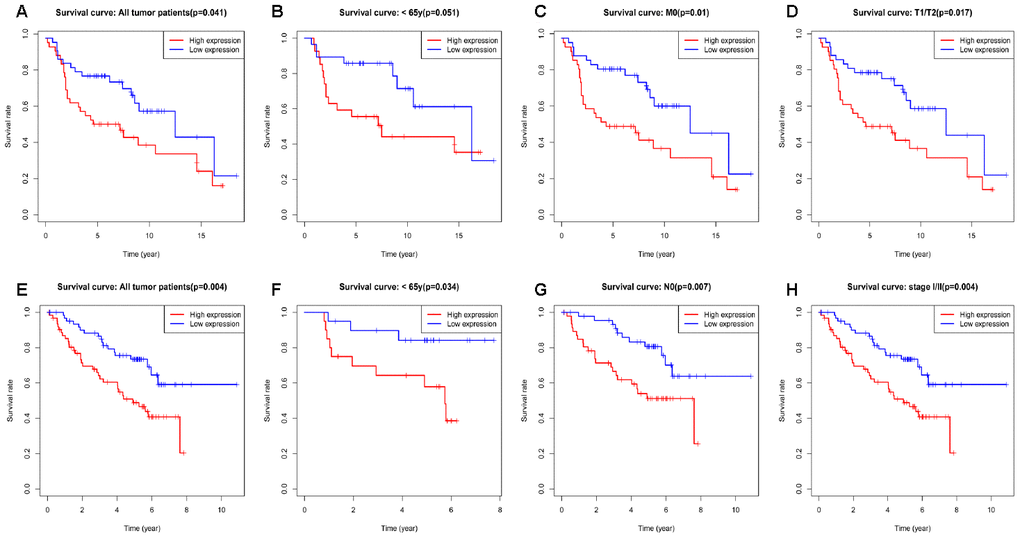
Figure 8. Kaplan-Meier curve for overall survival in lung adenocarcinoma in the validation datasets GSE30219 (A–D) and GSE50081 (E–H).
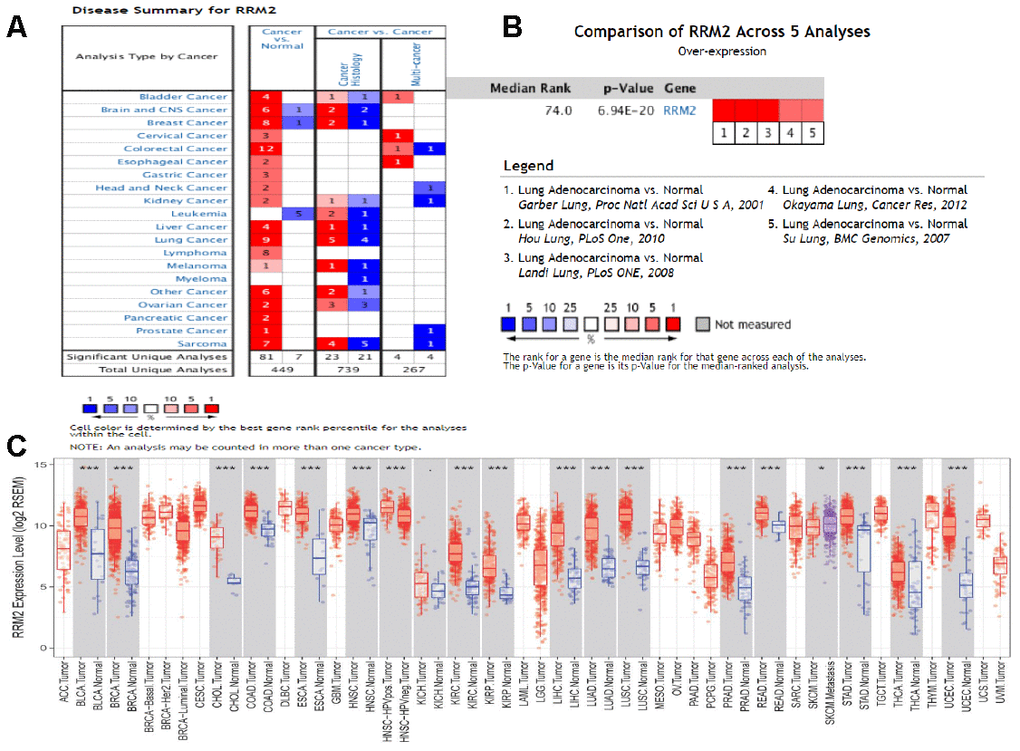
Figure 9. Expression analysis of RRM2 by Oncomine and TIMER databases. (A) Expression of RRM2 in different types of human cancers in the Oncomine database; (B) RRM2 is over-expression (red) in lung adenocarcinoma by Oncomine meta-analysis comparing with normal tissue; (C) Expression of RRM2 in different types of human cancers in the TIMER database.
RRM2 over-expression in LUAD tissues and cell lines was shown by qRT-PCR
We examined the expression of RRM2 by qRT-PCR in 40 tumor tissue samples and corresponding non-cancerous tissue samples from LUAD patients. In result, qRT-PCR showed that RRM2 expression was significantly higher in LUAD tissues compared to adjacent non-cancerous tissues (Figure 10A). We also examined the expression of RRM2 in five lung cancer cell lines (A549, SPCA-1, 95-D, PG-49, and NCI-H292), and the results showed that the expression level of RRM2 was significantly higher than that in the normal cell lines (BEAS-2B and HaCaT) (Figure 10B). In particular, the expression level of RRM2 in A549 lung cancer cell line was higher as compared to other lung cancer cell lines, A549 cells thus were selected for the subsequent experiments.
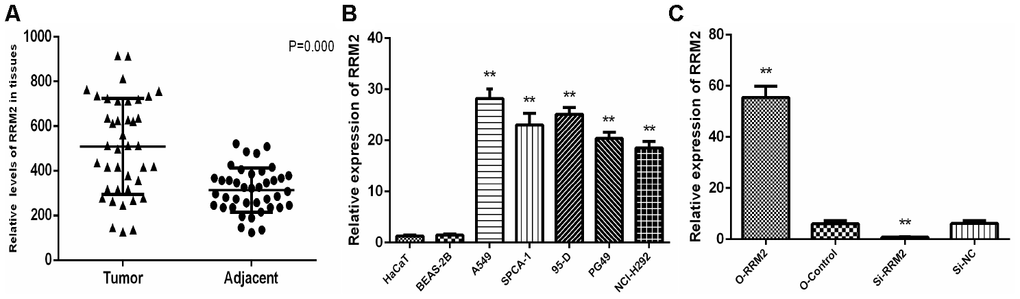
Figure 10. RRM2 expression in human LUAD tissues and cell lines. (A) Expression of RRM2 in 40 LUAD tissues and corresponding non-cancerous tissues were detected by qRT-PCR; (B) RRM2 expression levels in A549, SPCA-1, 95-D, PG-49, BEAS-2B, HaCaT, and NCI-H292 by qRT-PCR; (C) RRM2 expression in A549 cells transfected with si-RRM2, O-RRM2, si-NC, and O-Control were confirmed by qRT-PCR. *indicates a p-value < 0.05, and **indicates a p-value < 0.01.
RRM2 promoted A549 cells proliferation and invasion
To explore the role of RRM2 on cell proliferation and invasion, siRNA targeting RRM2 and non-silencing RNA sequences were transfected into A549 cell line, and the efficiency of over-expression and knockdown were validated by qRT-PCR (Figure 10C). In result, qRT-PCR showed that RRM2 expression was markedly lower after transfecting si-RRM2. CCK-8 was used to explore the role of RRM2 on cell proliferation, and the results showed that RRM2 over-expression in A549 cells promoted proliferative activity, whereas RRM2 knockdown markedly inhibited the proliferation ability of A549 cells (Figure 11A). Transwell assays were then employed to evaluate the role of RRM2 on cell invasion, and the results suggest that RRM2 over-expression markedly promoted A549 cells invasive activity (Figure 11B). Cell cycle was further determined by flow cytometry in attempt to explain the RRM2-mediated promotion of proliferative activity. A549 cells revealed G2/M cell cycle arrest after RRM2 knockdown (si-RRM2) (Figure 11C). To verify the underlying mechanism, the relevant signaling pathway proteins, p53, Bcl-2, Livin, and E-cadherin were determined by western blot assay. The results demonstrated RRM2 over-expression in A549 cells increased expression of Bcl-2/E-cadherin and decreased expression of p53, whereas RRM2 knockdown (si-RRM2) markedly decreased the expression of Bcl-2/E-cadherin and increased the expression of p53 (Figure 11D).
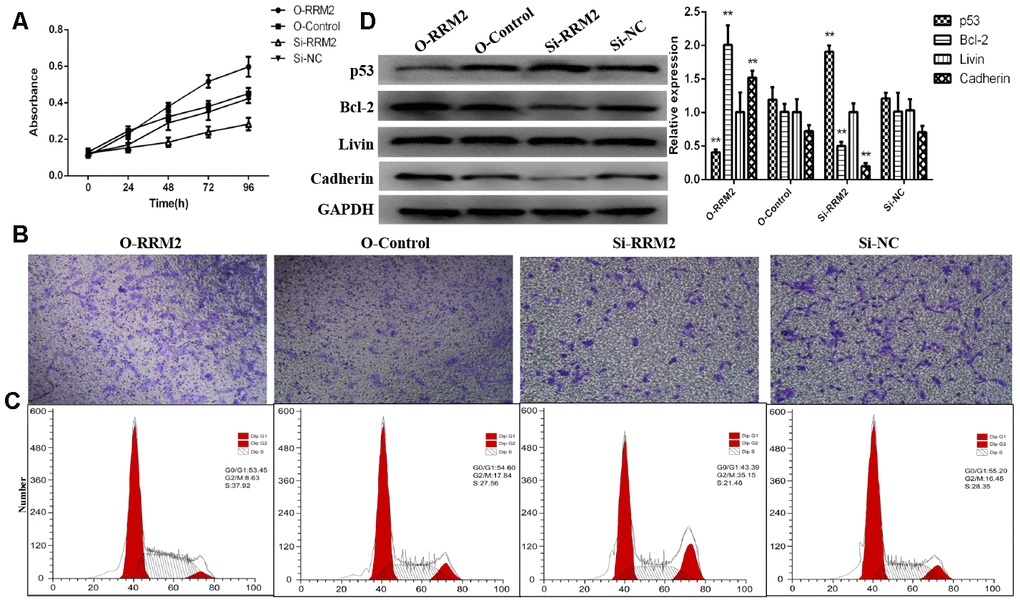
Figure 11. RRM2 promoted cell proliferation and invasion and regulated cell cycle progression of lung cancer cells. (A) CCK-8 proliferation curve of A549 cells transfected with si-RRM2, O-RRM2, si-NC, and O-Control; (B) Transwell assays were performed to evaluate the role of RRM2 on cell invasion; (C) The cell cycle analyzed of A549 cells by flow cytometry; (D) RRM2-associated signaling pathways were determined by western blot assay. *indicates a p-value < 0.05, and **indicates a p-value < 0.01.
Discussion
Ribonucleotide reductase, an enzyme involved in the cell cycle, has two components identified in humans, the RRM1 the regulatory subunit and RRM2 the catalytic subunit, which are vital for DNA synthesis and damage repair [14, 25]. RRM2B is one small subunit of RRM2, which is induced by p53 and plays an important role in repairing DNA damage [26]. Maintenance of mitochondrial DNA is also necessary [27]. Ribonucleotide reductase plays an important role in regulating the sizes of dNTP pools, which is required for correct DNA replication [27]. Changes in the sizes of dNTP pools or disruption in their balance will lead to increased mutation rates [27, 28]. Ribonucleotide reductase high expression is a characteristic of many solid tumors, and a series of mechanistically distinct ribonucleotide reductase inhibitors serve as effective agents for cancer treatment [29–31]. As the rate-limiting ribonucleotide reductase enzyme, the RRM2 level controls the cell cycle-dependent activity of ribonucleotide. Suppression of RRM2 expression sensitizes cancer cells to both ribonucleotide reductase inhibitors and cisplatin [29, 32]. Overexpression of RRM2 is associated with poorer prognosis in multiple carcinomas [19, 33]. For instance, patients with cervical cancer with positive RRM2 expression showed a higher recurrent rate and lower survival rate than those with negative RRM2 expression [34]. Additionally, RRM2 dysregulation is related to chemoresistance during cancer treatment. RRM2 downregulation can overturn AKT-induced tamoxifen resistance and increase therapeutic efficacy in breast carcinoma [35].
RRM2 gene expression and functions in carcinoma have been recently reported [36–38]. However, the significance of its expression in prognosis in patients with LUAD is largely unclear. In the current study, we analyzed the RRM2 expression profile in numerous human solid tumors via using Oncomine database. the results demonstrated RRM2 gene expression was higher in lung cancer, colorectal cancer, breast cancer, bladder cancer, sarcoma cancer, liver cancer, and others than in their matched adjacent normal tissues. RRM2 gene expression and its potential prognostic impact on patients with LUAD have not been evaluated. In 2015, Mah et al. explored the expression level of RRM2 in an NSCLC stratification subgroup based on gender and smoking status to predict survival outcomes. the results revealed high RRM2 expression was associated with primarily women and non-smoking patients [39]. Toffalorio et al. investigated the expression levels of seven genes involved in gemcitabine metabolism in advanced NSCLC, including the RRM2 gene; the results revealed RRM2 gene expression was not associated with patients with advanced NSCLC treated with gemcitabine [40]. This is the first comprehensive study to evaluate RRM2 gene expression in the prognosis of patients with LUAD. In the present study, we evaluated the RRM2 gene expression profile via bioinformatic analysis using TCGA database. With respect to matched normal lung tissues, RRM2 gene expression levels were significantly higher in patients with LUAD and the result has been confirmed by qRT-PCR. Kaplan-Meier survival analysis revealed that patients with RRM2 high expression had shorter OS (p < 0.05). This finding was validated in other independent external datasets (all p < 0.05). Multivariate Cox analysis further confirmed that RRM2 high expression was an independent risk factor for OS in patients with LUAD; other clinicopathologic features were also associated with worse prognosis in LUAD, including advanced stage, lymph nodes metastases, with tumor, as suggested by the forest plot. ROC analysis also verified the diagnostic value. At present, a predictive nomogram for LUAD by combining the expression value of RRM2 with clinical variables has not been reported. Therefore, we constructed a prognostic nomogram by integrating clinical factors and gene expression via TCGA dataset to enable clinicians to predict the risk of individual patient death and guide patient assessment and therapeutic decision-making.
We found that the high RRM2 expression phenotype was associated with the cell cycle, p53 signaling pathway, DNA replication, small cell lung cancer, apoptosis, and pathways in cancer by GSEA. DNA replication ensures that cellular genetic information is accurately copied and correctly transmitted to offspring cells [41, 42]. However, DNA replication is prone to interference and damage under various pressures in the body, leading to stagnant of DNA replication, affecting genome stability and even inducing apoptosis, necrosis, and carcinogenesis. p53 is a transcription factor that specifically binds to DNA [43]. It can regulate specific gene expression and induce cell cycle suspension, DNA repair, and apoptosis. Pathway enrichment analysis suggested that RRM2 affects the pathogenesis of proliferation and invasion in lung carcinoma through the above pathways. Han et al. found that RRM2-c2orf48 over-expression induced epithelial-mesenchymal transition in nasopharyngeal carcinoma cells results in the down-regulation of E-cadherin and promoted nasopharyngeal carcinoma cell migration and invasion [44]. Li et al. demonstrated that RRM2 is over-expressed in glioblastoma and this over-expression can promote the proliferation, migrative, and invasive abilities, whereas suppress cell apoptosis of glioblastoma cells both in vivo and in vitro [45]. Shah et al. demonstrated that nuclearfactor-kappaB (NF-κB), MAPK/JNK, and EGFR are the major signaling pathways that are affected by the over-expression of RRM2 and this overexpression increased gene expression of EGFR, Bcl-2, and MMP9 and decreased gene expression of p53, CDKN1A, and CDKN2A [46]. Furthermore, RRM2 over-expression promoted the proliferative activity, migratory and invasive capabilities of breast cancer cells. Several studies have also found RRM2 protein interact with key cell cycle genes and signaling pathway proteins, such as p53, PI3K, hypoxia inducible factor-1α, Bax, and cyclin D1, to regulate tumor cell proliferation, migratory, and invasive abilities and cell cycle progression [45–48]. Our results, partly in line with the findings in the above studies, showed that RRM2 promoted lung cancer cell proliferation and invasion and cell cycle progression. However, such mechanisms require further investigation.
In summary, we showed that RRM2 is upregulated in LUAD, and high RRM2 expression was correlated with clinical progression and considered as an independent risk factor for OS in patients with LUAD. We also found that RRM2 promotes the proliferative activity and invasive capabilities of lung cancer cells; suggesting that RRM2 play a crucial role in tumor initiation, development and malignant behavior and may be used as biomarker in the diagnosis and prognosis of patients with lung adenocarcinoma. Moreover, the p53 signaling pathway, cell cycle, DNA replication, small cell lung cancer, apoptosis, and pathways in cancer may be pivotal pathways regulated by RRM2 in LUAD. RRM2 expression may be an important prognostic factor in patients with LUAD.
Materials and Methods
Patient data sets
mRNA expression data (535 samples, Workflow Type: HTSeq-FPKM) and clinical information were downloaded from TCGA database (https://cancergenome.nih.gov). The following samples were excluded: (1) “0” gene expression value and (2) insufficient survival information. A total of 503 patients with LUAD with the corresponding clinical features were enrolled in this study.
Gene set enrichment analysis (GSEA)
GSEA is a computational method determines whether a previously defined set of genes have significant statistical and concordant differences in two biological states [49]. GSEA was performed to identify all genes found to be correlated with RRM2 gene expression in recent studies and to examine the significant survival differences observed between the high- and low-RRM2 groups. For each analysis, gene set permutation was performed 1000 times. Gene sets with a normal p-vale less than 5% and false discovery rate less than 25% were considered as significantly enriched.
Sample collection
LUAD and adjacent tissues were collected from 40 patients immediately stored in liquid nitrogen, and preserved at -80° C. The use of all samples conformed to the Declaration of Helsinki. The present study was approved by the Ethics Committee of People’s Hospital of Xinjiang Uygur Autonomous Region
Cell culture and transfection
Human normal lung epithelial cell line (BEAS-2B), human immortalized keratinocytes cell line (HaCaT; normal control), and human lung cancer cell lines (A549, SPCA-1, 95-D, and NCI-H292) were obtained from the cell bank of the Chinese Academy of Sciences in Shanghai (Shanghai, China), and PG-49 was obtained from American Tissue Culture Collection (ATCC; Manassas, VA, USA). All cells were cultured in Dulbecco's Modified Eagle's medium (DMEM; Gibco, Gran Island, NY, USA) supplemented with 10% fetal bovine serum (FBS; Gibco) and antibiotics (100 units/ml penicillin and 100 ug/ml streptomycin; Gibco), except SPCA-1, PG49, and HaCaT, which were cultured in Roswell Park Memorial Institute-1640 (RPMI-1640; Gibco). All cells were cultured at 37° C, 5% CO2 in a humidified atmosphere incubator.
The lentiviral vector containing RRM2 small interfering RNA (siRNA) was constructed by GeneChem Co., Ltd (Shanghai, China). siRNA targeting RRM2 (NM_001034) sequences was 5'-GGAGCGAUUUAGCCAAGAAGU-3'. Four groups were constructed as follows: si-RRM2 transfected group (si-RRM2), RRM2 overexpressed group (O-RRM2), an empty lentiviral vector was regarded as a negative control (si-NC), and un-transfected group (O-Control). Transfection was performed as described previously [50]. The efficiency of over-expression and knockdown were validated by qRT-PCR. Finally, the transfected A549 lung cancer cells were collected for subsequent experiments.
Quantitative real-time polymerase chain reaction (PCR) of tissues and cell lines
Total RNA was extracted from cell lines or tissue specimens using TRIzol reagent (Invitrogen, Thermo Fisher Scientific, Shanghai, China) according to the manufacturer’s instructions, and RNA was reversely transcribed into cDNA using Transcription First Strand cDNA synthesis kit (Roche, Basel, Switzerland). Quantitative real-time PCR (qRT-PCR) analyses were quantified with SYBR® Green (Roche, Basel, Switzerland). The relative expression of RRM2 was calculated based on the 2-ΔΔCt method with β-actin as an internal reference. qRT-PCR primers used in the present study were as follows: RRM2 forward primer, 5’-ACGGAGACTCACCAGTTGG-3’; RRM2 reverse primer, 5’-GCACGACGCTGAGGATCAA-3’; β-actin forward primer, 5’-CTCCATCCTGGCCTCGCTGT-3’; β-actin reverse primer, 5’-GCTGTCACCTTCACCGTTCC-3’.
Cell proliferation and invasion assay
To evaluate the proliferative activity of lung cancer cells, a Cell Counting Kit-8 (CCK-8; Dojindo, Kumamoto, Japan) was performed according to the manufacturer’s instructions. Briefly, A549 cells were plated in 96-well plates (Density: 3 × 10³ cells per well) and incubated overnight. Absorbance of 450 nm was measured using a microplate reader (Thermo Fisher Scientific, Shanghai, China) daily for four days. The experiment was independently repeated three times. Transwell chamber assays were performed to assess the invasive ability of lung cancer cells according to the manufacturer’s instructions.
Western blot assay and antibody
RIPA lysis buffer (Thermo Fisher Scientific, Shanghai, China) containing protease and phosphatase inhibitors was used to lyse lung cancer cells. Protein lysates were separated by SDS-PAGE gels (Thermo Fisher Scientific, Shanghai, China), blotted onto PVDF membrane (Roche, Basel, Switzerland) for analysis and incubated at 4° C for overnight with the following primary antibodies: anti-p53 antibody (1:3000 dilution; #10442-A-AP, Sanying Biotechnology, Wuhan, China), anti-Bcl-2 antibody (1:1000 dilution; #ab32124, Abcam, Cambridge, MA, USA), anti-Livin antibody (1:1000 dilution; #ab97350, Abcam, Cambridge, MA, USA), anti-E-Cadherin antibody (1:2000 dilution; #20874-1-AP, Sanying Biotechnology, Wuhan, China), and anti-GAPDH antibody (1:5000 dilution; #HRP-60004, Sanying Biotechnology, Wuhan, China). The results of the western blot analyses were performed with Image J software.
Cell cycle assay
A549 cells were plated in six-well plates (Density: 2 × 10⁵ cells per well) and incubated for 12 h. A549 cells were incubated to 80-90% confluency and then washed two times with PBS and fixed with 70% precooled ethanol at 4° C for 12 h. A549 cells were re-washed two times with PBS and cultured with 500 μl propidium iodide (PI)/RNase staining buffer (Cell Signaling Technology, Inc, Danvers, MA, USA) for 30 minutes away from light. The distribution of cells in G0/G1, G2/M, and S phases of the cell cycle was determined by flow cytometry (Beckman Coulter Quanta SC System).
Statistical analysis
The expression level of the RRM2 gene in patients with LUAD was evaluated by using box plots. The cut-off value of RRM2 expression was selected as the median method of gene expression. Wilcoxon signed-rank test and logistic regression were performed to analyze the association between clinical features and RRM2 expression in LUAD. Kaplan-Meier analysis was performed to compare the overall survival (OS) rate between the high and low RRM2 gene expression groups using the p-value determined in the log-rank test. A received operating characteristic (ROC) curve was applied to assess the diagnostic value of RRM2 gene expression, with the area under the ROC curve used as the diagnostic value. Use univariate Cox analysis to screen potential prognostic factors, and multivariate Cox analysis to verify the effect of RRM2 expression on survival along with other clinical variables. A nomogram was constructed to predict 1-, 3- and 5-year LUAD overall survival by combining the expression value of RRM2 with clinical variables. External validation was applied via using two other independent external datasets (GSE30219 and GSE50081). The expression level of RRM2 in patients with LUAD and normal individuals was further validated in the Oncomine database (https://www.oncomine.org/resource/main.html) and TIMER database (https://cistrome.shinyapps.io/timer/). All statistical analyses were performed using R statistical software (version 3.5.3), SPSS software (version 24.0), or MedCalc software (version 19.1). A p-value less than 0.05 is considered as statistically significant.
Supplementary Materials
Author Contributions
J.C.Y., and Z.Y.X designed this study and had full access to all of data in the study; J.C.Y., and D.L. extracted the data; N.E.L.A.H., and W.X.L. analyzed and interpreted the data; Y.Y.W., and G.R. wrote the paper. All authors reviewed the manuscript.
Conflicts of Interest
The authors have no conflicts of interest.
References
- 1. Bray F, Ferlay J, Soerjomataram I, Siegel RL, Torre LA, Jemal A. Global cancer statistics 2018: GLOBOCAN estimates of incidence and mortality worldwide for 36 cancers in 185 countries. CA Cancer J Clin. 2018; 68:394–424. https://doi.org/10.3322/caac.21492 [PubMed]
- 2. Hirsch FR, Scagliotti GV, Mulshine JL, Kwon R, Curran WJ
Jr , Wu YL, Paz-Ares L. Lung cancer: current therapies and new targeted treatments. Lancet. 2017; 389:299–311. https://doi.org/10.1016/S0140-6736(16)30958-8 [PubMed] - 3. Siegel RL, Miller KD, Jemal A. Cancer statistics, 2018. CA Cancer J Clin. 2018; 68:7–30. https://doi.org/10.3322/caac.21442 [PubMed]
- 4. Moreira AL, Eng J. Personalized therapy for lung cancer. Chest. 2014; 146:1649–57. https://doi.org/10.1378/chest.14-0713 [PubMed]
- 5. Soda M, Choi YL, Enomoto M, Takada S, Yamashita Y, Ishikawa S, Fujiwara S, Watanabe H, Kurashina K, Hatanaka H, Bando M, Ohno S, Ishikawa Y, et al. Identification of the transforming EML4-ALK fusion gene in non-small-cell lung cancer. Nature. 2007; 448:561–66. https://doi.org/10.1038/nature05945 [PubMed]
- 6. Woo CG, Seo S, Kim SW, Jang SJ, Park KS, Song JY, Lee B, Richards MW, Bayliss R, Lee DH, Choi J. Differential protein stability and clinical responses of EML4-ALK fusion variants to various ALK inhibitors in advanced ALK-rearranged non-small cell lung cancer. Ann Oncol. 2017; 28:791–97. https://doi.org/10.1093/annonc/mdw693 [PubMed]
- 7. Jia XL, Chen G. EGFR and KRAS mutations in Chinese patients with adenosquamous carcinoma of the lung. Lung Cancer. 2011; 74:396–400. https://doi.org/10.1016/j.lungcan.2011.04.005 [PubMed]
- 8. Tanaka T, Matsuoka M, Sutani A, Gemma A, Maemondo M, Inoue A, Okinaga S, Nagashima M, Oizumi S, Uematsu K, Nagai Y, Moriyama G, Miyazawa H, et al. Frequency of and variables associated with the EGFR mutation and its subtypes. Int J Cancer. 2010; 126:651–55. https://doi.org/10.1002/ijc.24746 [PubMed]
- 9. Kobayashi Y, Mitsudomi T. Not all epidermal growth factor receptor mutations in lung cancer are created equal: perspectives for individualized treatment strategy. Cancer Sci. 2016; 107:1179–86. https://doi.org/10.1111/cas.12996 [PubMed]
- 10. Tan CS, Cho BC, Soo RA. Next-generation epidermal growth factor receptor tyrosine kinase inhibitors in epidermal growth factor receptor -mutant non-small cell lung cancer. Lung Cancer. 2016; 93:59–68. https://doi.org/10.1016/j.lungcan.2016.01.003 [PubMed]
- 11. Karachaliou N, Santarpia M, Gonzalez Cao M, Teixido C, Sosa AE, Berenguer J, Rodriguez Capote A, Altavilla G, Rosell R. Anaplastic lymphoma kinase inhibitors in phase I and phase II clinical trials for non-small cell lung cancer. Expert Opin Investig Drugs. 2017; 26:713–22. https://doi.org/10.1080/13543784.2017.1324572 [PubMed]
- 12. Lin JJ, Riely GJ, Shaw AT. Targeting ALK: precision medicine takes on drug resistance. Cancer Discov. 2017; 7:137–55. https://doi.org/10.1158/2159-8290.CD-16-1123 [PubMed]
- 13. Sacco JJ, Al-Akhrass H, Wilson CM. Challenges and strategies in precision medicine for non-small-cell lung cancer. Curr Pharm Des. 2016; 22:4374–85. https://doi.org/10.2174/1381612822666160603014932 [PubMed]
- 14. Nordlund P, Reichard P. Ribonucleotide reductases. Annu Rev Biochem. 2006; 75:681–706. https://doi.org/10.1146/annurev.biochem.75.103004.142443 [PubMed]
- 15. Grolmusz VK, Karászi K, Micsik T, Tóth EA, Mészáros K, Karvaly G, Barna G, Szabó PM, Baghy K, Matkó J, Kovalszky I, Tóth M, Rácz K, et al. Cell cycle dependent RRM2 may serve as proliferation marker and pharmaceutical target in adrenocortical cancer. Am J Cancer Res. 2016; 6:2041–53. [PubMed]
- 16. Grossi F, Dal Bello MG, Salvi S, Puzone R, Pfeffer U, Fontana V, Alama A, Rijavec E, Barletta G, Genova C, Sini C, Ratto GB, Taviani M, et al. Expression of ribonucleotide reductase subunit-2 and thymidylate synthase correlates with poor prognosis in patients with resected stages I-III non-small cell lung cancer. Dis Markers. 2015; 2015:302649. https://doi.org/10.1155/2015/302649 [PubMed]
- 17. Lu AG, Feng H, Wang PX, Han DP, Chen XH, Zheng MH. Emerging roles of the ribonucleotide reductase M2 in colorectal cancer and ultraviolet-induced DNA damage repair. World J Gastroenterol. 2012; 18:4704–13. https://doi.org/10.3748/wjg.v18.i34.4704 [PubMed]
- 18. Fatkhutdinov N, Sproesser K, Krepler C, Liu Q, Brafford PA, Herlyn M, Aird KM, Zhang R. Targeting RRM2 and mutant BRAF is a novel combinatorial strategy for melanoma. Mol Cancer Res. 2016; 14:767–75. https://doi.org/10.1158/1541-7786.MCR-16-0099 [PubMed]
- 19. Hsu NY, Wu JY, Liu X, Yen Y, Chen CY, Chou MC, Lin CH, Lee H, Cheng YW. Expression status of ribonucleotide reductase small subunits hRRM2/p53R2 as prognostic biomarkers in stage I and II non-small cell lung cancer. Anticancer Res. 2011; 31:3475–81. [PubMed]
- 20. Garber ME, Troyanskaya OG, Schluens K, Petersen S, Thaesler Z, Pacyna-Gengelbach M, van de Rijn M, Rosen GD, Perou CM, Whyte RI, Altman RB, Brown PO, Botstein D, Petersen I. Diversity of gene expression in adenocarcinoma of the lung. Proc Natl Acad Sci USA. 2001; 98:13784–89. https://doi.org/10.1073/pnas.241500798 [PubMed]
- 21. Hou J, Aerts J, den Hamer B, van Ijcken W, den Bakker M, Riegman P, van der Leest C, van der Spek P, Foekens JA, Hoogsteden HC, Grosveld F, Philipsen S. Gene expression-based classification of non-small cell lung carcinomas and survival prediction. PLoS One. 2010; 5:e10312. https://doi.org/10.1371/journal.pone.0010312 [PubMed]
- 22. Landi MT, Dracheva T, Rotunno M, Figueroa JD, Liu H, Dasgupta A, Mann FE, Fukuoka J, Hames M, Bergen AW, Murphy SE, Yang P, Pesatori AC, et al. Gene expression signature of cigarette smoking and its role in lung adenocarcinoma development and survival. PLoS One. 2008; 3:e1651. https://doi.org/10.1371/journal.pone.0001651 [PubMed]
- 23. Okayama H, Kohno T, Ishii Y, Shimada Y, Shiraishi K, Iwakawa R, Furuta K, Tsuta K, Shibata T, Yamamoto S, Watanabe S, Sakamoto H, Kumamoto K, et al. Identification of genes upregulated in ALK-positive and EGFR/KRAS/ALK-negative lung adenocarcinomas. Cancer Res. 2012; 72:100–11. https://doi.org/10.1158/0008-5472.CAN-11-1403 [PubMed]
- 24. Su LJ, Chang CW, Wu YC, Chen KC, Lin CJ, Liang SC, Lin CH, Whang-Peng J, Hsu SL, Chen CH, Huang CY. Selection of DDX5 as a novel internal control for Q-RT-PCR from microarray data using a block bootstrap re-sampling scheme. BMC Genomics. 2007; 8:140. https://doi.org/10.1186/1471-2164-8-140 [PubMed]
- 25. Torrents E, Aloy P, Gibert I, Rodríguez-Trelles F. Ribonucleotide reductases: divergent evolution of an ancient enzyme. J Mol Evol. 2002; 55:138–52. https://doi.org/10.1007/s00239-002-2311-7 [PubMed]
- 26. Tanaka H, Arakawa H, Yamaguchi T, Shiraishi K, Fukuda S, Matsui K, Takei Y, Nakamura Y. A ribonucleotide reductase gene involved in a p53-dependent cell-cycle checkpoint for DNA damage. Nature. 2000; 404:42–49. https://doi.org/10.1038/35003506 [PubMed]
- 27. Pontarin G, Ferraro P, Bee L, Reichard P, Bianchi V. Mammalian ribonucleotide reductase subunit p53R2 is required for mitochondrial DNA replication and DNA repair in quiescent cells. Proc Natl Acad Sci USA. 2012; 109:13302–07. https://doi.org/10.1073/pnas.1211289109 [PubMed]
- 28. Niida H, Shimada M, Murakami H, Nakanishi M. Mechanisms of dNTP supply that play an essential role in maintaining genome integrity in eukaryotic cells. Cancer Sci. 2010; 101:2505–09. https://doi.org/10.1111/j.1349-7006.2010.01719.x [PubMed]
- 29. Lin ZP, Belcourt MF, Cory JG, Sartorelli AC. Stable suppression of the R2 subunit of ribonucleotide reductase by R2-targeted short interference RNA sensitizes p53(-/-) HCT-116 colon cancer cells to DNA-damaging agents and ribonucleotide reductase inhibitors. J Biol Chem. 2004; 279:27030–38. https://doi.org/10.1074/jbc.M402056200 [PubMed]
- 30. Alvarez-Salas LM. Nucleic acids as therapeutic agents. Curr Top Med Chem. 2008; 8:1379–404. https://doi.org/10.2174/156802608786141133 [PubMed]
- 31. Zuckerman JE, Gritli I, Tolcher A, Heidel JD, Lim D, Morgan R, Chmielowski B, Ribas A, Davis ME, Yen Y. Correlating animal and human phase ia/ib clinical data with CALAA-01, a targeted, polymer-based nanoparticle containing siRNA. Proc Natl Acad Sci USA. 2014; 111:11449–54. https://doi.org/10.1073/pnas.1411393111 [PubMed]
- 32. Duxbury MS, Ito H, Zinner MJ, Ashley SW, Whang EE. RNA interference targeting the M2 subunit of ribonucleotide reductase enhances pancreatic adenocarcinoma chemosensitivity to gemcitabine. Oncogene. 2004; 23:1539–48. https://doi.org/10.1038/sj.onc.1207272 [PubMed]
- 33. Grade M, Hummon AB, Camps J, Emons G, Spitzner M, Gaedcke J, Hoermann P, Ebner R, Becker H, Difilippantonio MJ, Ghadimi BM, Beissbarth T, Caplen NJ, Ried T. A genomic strategy for the functional validation of colorectal cancer genes identifies potential therapeutic targets. Int J Cancer. 2011; 128:1069–79. https://doi.org/10.1002/ijc.25453 [PubMed]
- 34. Su YF, Wu TF, Ko JL, Tsai HT, Tee YT, Chien MH, Chou CH, Lin WL, Low HY, Chou MY, Yang SF, Wang PH. The expression of ribonucleotide reductase M2 in the carcinogenesis of uterine cervix and its relationship with clinicopathological characteristics and prognosis of cancer patients. PLoS One. 2014; 9:e91644. https://doi.org/10.1371/journal.pone.0091644 [PubMed]
- 35. Shah KN, Mehta KR, Peterson D, Evangelista M, Livesey JC, Faridi JS. AKT-induced tamoxifen resistance is overturned by RRM2 inhibition. Mol Cancer Res. 2014; 12:394–407. https://doi.org/10.1158/1541-7786.MCR-13-0219 [PubMed]
- 36. Lu H, Lu S, Yang D, Zhang L, Ye J, Li M, Hu W. MiR-20a-5p regulates gemcitabine chemosensitivity by targeting RRM2 in pancreatic cancer cells and serves as a predictor for gemcitabine-based chemotherapy. Biosci Rep. 2019; 39:BSR20181374. https://doi.org/10.1042/BSR20181374 [PubMed]
- 37. Mazzu YZ, Armenia J, Chakraborty G, Yoshikawa Y, Coggins SA, Nandakumar S, Gerke TA, Pomerantz MM, Qiu X, Zhao H, Atiq M, Khan N, Komura K, et al. A novel mechanism driving poor-prognosis prostate cancer: overexpression of the DNA repair gene, ribonucleotide reductase small subunit M2 (RRM2). Clin Cancer Res. 2019; 25:4480–92. https://doi.org/10.1158/1078-0432.CCR-18-4046 [PubMed]
- 38. Sun H, Yang B, Zhang H, Song J, Zhang Y, Xing J, Yang Z, Wei C, Xu T, Yu Z, Xu Z, Hou M, Ji M, Zhang Y. RRM2 is a potential prognostic biomarker with functional significance in glioma. Int J Biol Sci. 2019; 15:533–43. https://doi.org/10.7150/ijbs.30114 [PubMed]
- 39. Mah V, Alavi M, Márquez-Garbán DC, Maresh EL, Kim SR, Horvath S, Bagryanova L, Huerta-Yepez S, Chia D, Pietras R, Goodglick L. Ribonucleotide reductase subunit M2 predicts survival in subgroups of patients with non-small cell lung carcinoma: effects of gender and smoking status. PLoS One. 2015; 10:e0127600. https://doi.org/10.1371/journal.pone.0127600 [PubMed]
- 40. Toffalorio F, Santarpia M, Radice D, Jaramillo CA, Spitaleri G, Manzotti M, Catania C, Jordheim LP, Pelosi G, Peters GJ, Tibaldi C, Funel N, Spaggiari L, et al. 5'-nucleotidase cN-II emerges as a new predictive biomarker of response to gemcitabine/platinum combination chemotherapy in non-small cell lung cancer. Oncotarget. 2018; 9:16437–50. https://doi.org/10.18632/oncotarget.24505 [PubMed]
- 41. Mazouzi A, Velimezi G, Loizou JI. DNA replication stress: causes, resolution and disease. Exp Cell Res. 2014; 329:85–93. https://doi.org/10.1016/j.yexcr.2014.09.030 [PubMed]
- 42. Sacco E, Hasan MM, Alberghina L, Vanoni M. Comparative analysis of the molecular mechanisms controlling the initiation of chromosomal DNA replication in yeast and in mammalian cells. Biotechnol Adv. 2012; 30:73–98. https://doi.org/10.1016/j.biotechadv.2011.09.009 [PubMed]
- 43. Sakaguchi K, Herrera JE, Saito S, Miki T, Bustin M, Vassilev A, Anderson CW, Appella E. DNA damage activates p53 through a phosphorylation-acetylation cascade. Genes Dev. 1998; 12:2831–41. https://doi.org/10.1101/gad.12.18.2831 [PubMed]
- 44. Han P, Chen RH, Wang F, Zeng JY, Yu ST, Xu LH, Cai Q, Liang FY, Xia TL, Lin ZR, Zhong Q, Huang XM. Novel chimeric transcript RRM2-c2orf48 promotes metastasis in nasopharyngeal carcinoma. Cell Death Dis. 2017; 8:e3047. https://doi.org/10.1038/cddis.2017.402 [PubMed]
- 45. Li C, Zheng J, Chen S, Huang B, Li G, Feng Z, Wang J, Xu S. RRM2 promotes the progression of human glioblastoma. J Cell Physiol. 2018; 233:6759–67. https://doi.org/10.1002/jcp.26529 [PubMed]
- 46. Shah KN, Wilson EA, Malla R, Elford HL, Faridi JS. Targeting ribonucleotide reductase M2 and NF-κB activation with didox to circumvent tamoxifen resistance in breast cancer. Mol Cancer Ther. 2015; 14:2411–21. https://doi.org/10.1158/1535-7163.MCT-14-0689 [PubMed]
- 47. Rahman MA, Amin AR, Wang D, Koenig L, Nannapaneni S, Chen Z, Wang Z, Sica G, Deng X, Chen ZG, Shin DM. RRM2 regulates bcl-2 in head and neck and lung cancers: a potential target for cancer therapy. Clin Cancer Res. 2013; 19:3416–28. https://doi.org/10.1158/1078-0432.CCR-13-0073 [PubMed]
- 48. Wang N, Li Y, Zhou J. Downregulation of ribonucleotide reductase subunits M2 induces apoptosis and G1 arrest of cervical cancer cells. Oncol Lett. 2018; 15:3719–25. https://doi.org/10.3892/ol.2018.7806 [PubMed]
- 49. Subramanian A, Tamayo P, Mootha VK, Mukherjee S, Ebert BL, Gillette MA, Paulovich A, Pomeroy SL, Golub TR, Lander ES, Mesirov JP. Gene set enrichment analysis: a knowledge-based approach for interpreting genome-wide expression profiles. Proc Natl Acad Sci USA. 2005; 102:15545–50. https://doi.org/10.1073/pnas.0506580102 [PubMed]
- 50. Xiong HG, Li H, Xiao Y, Yang QC, Yang LL, Chen L, Bu LL, Zhang WF, Zhang JL, Sun ZJ. Long noncoding RNA MYOSLID promotes invasion and metastasis by modulating the partial epithelial-mesenchymal transition program in head and neck squamous cell carcinoma. J Exp Clin Cancer Res. 2019; 38:278. https://doi.org/10.1186/s13046-019-1254-4 [PubMed]