ESRP1 positively correlates with the survival of patients with SCLC
To clarify the role of ESRP1 in SCLC, we examined its clinical relevance in patients with SCLC. We first analyzed the differential expression of ESRP1 in the tumor and adjacent normal tissues from five patients by Western blot, which revealed that the expression of ESRP1 was significantly decreased in SCLC tumor tissues as compared with corresponding adjacent normal tissues (Figure 1A). Then, we investigated levels of ESRP1 mRNA expression in 56 human SCLC and 13 normal lung tissue samples by qRT-PCR. The results of this analysis revealed lower ESRP1 mRNA expression in SCLC tissues than in normal tissues (Figure 1B). Moreover, analysis of the results showed that low expression levels of ESRP1 was significantly associated with smoking history, extensive disease, and worse status in patients with SCLC (Table 1). Kaplan-Meier analysis revealed that low ESRP1 mRNA levels in SCLC tissues correlated with reduced overall survival (Figure 1C). The univariate analysis showed that ESRP1 expression levels correlated with disease stage and survival in SCLC, whereas the multivariate analysis suggested that ESRP1 was not an independent predictor of prognosis in these patients (Table 2). Overall, the above analysis indicated that ESRP1 was down-regulated in SCLC chemoresistant cells and tumor tissues, and that the expression of ESRP1 was correlated with the overall survival of SCLC patients.
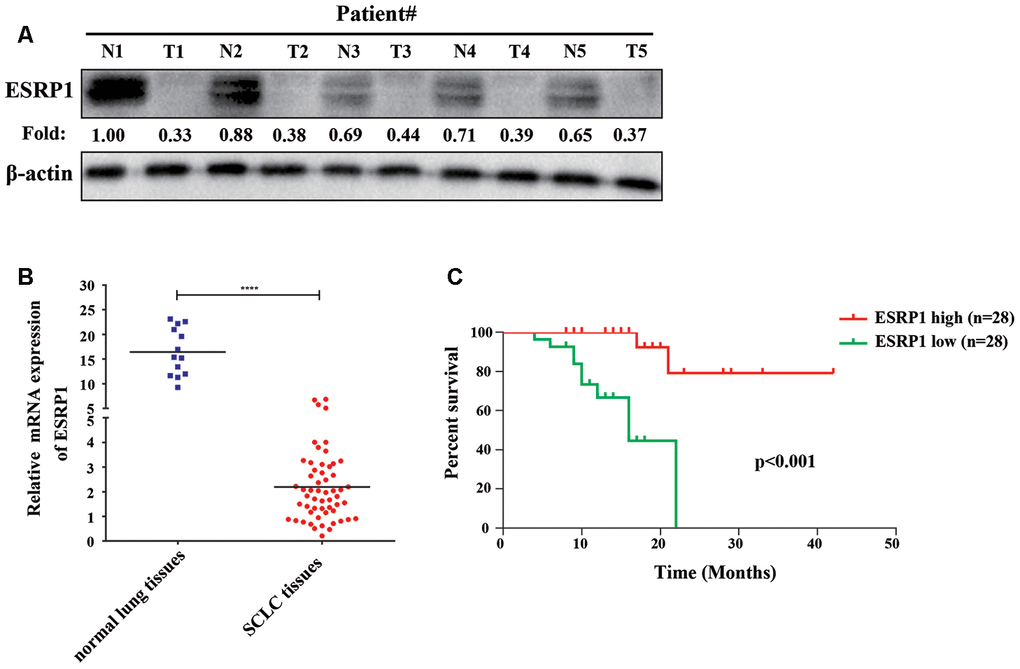
Figure 1. ESRP1 positively correlates with overall survival. (A) ESRP1 levels from five paired SCLC tumors (T) and normal (N) tissues were analyzed by western blotting. (B) ESRP1 mRNA levels in SCLC tissues and adjacent noncancerous lung tissues. (C) Kaplan–Meier analyses of the correlations between ESRP1 mRNA level and overall survival in SCLC patients. *, p<0.05; **, p <0.01; ***, p <0.001; ****, p <0.0001.
Table 1. Clinical characteristics of 56 patients with SCLC according to the ESRP1 expression level.
| Variable | ESRP1 | p value |
| Low | High |
| Age, years, ≤62: >62 | 8:20 | 9:19 | | 0.084 |
| Sex, male: female | 21:7 | 23:5 | | 0.424 |
| Smoking history, Yes: No | 17:11 | 17:11 | | 0.000* |
| Disease stage, LD: ED | 15:13 | 15:13 | | 0.000* |
| Status, Survival: Death | 18:10 | 26:2 | | 0.02* |
| Used χ2 test to test the correlation between two variables (*represents statistically significant differences (p < 0.05)). |
| LD limited-stage diseases, ED extensive-stage disease. |
Table 2. Univariate and multivariate Cox-regression analysis of various prognostic parameters in patients with SCLC.
| Variable | Univariate analysis | | Multivariate analysis |
| p | HR (95%CI) | | p | HR (95%CI) |
| ESRP1 | 0.02* | 0.52(0.30-0.90) | | 0.193 | 0.59(0.27-1.30) |
| Age | 0.766 | 0.99(0.90-1.08) | | 0.423 | 1.05(0.93-1.18) |
| Sex | 0.417 | 1.79(0.44-7.30) | | 0.653 | 0.62(0.07-5.08) |
| Disease stage | 0.002* | 27.54(3.32-228.5) | | 0.016* | 17.81(1.72-184.9) |
| Smoking history | 0.155 | 2.78(0.68-11.34) | | 0.065 | 9.38(0.87-100.9) |
| (*represents statistically significant differences (p < 0.05)). |
ESRP1 is reduced in chemoresistant SCLC cells and inhibits chemoresistance of SCLC cells in vitro and in vivo
Previous research by our group showed that the expression of circular RNA cESRP1 in SCLC chemoresistant cells was significantly lower than that in chemosensitive cells and suggested that cESRP1 promotes chemosensitivity of SCLC by inhibiting the TGF-β signaling pathway [20]. Therefore, we speculated whether the ESRP1 protein formed by the same precursor RNA may also participate in the chemoresistance of SCLC. To confirm this hypothesis, we evaluated the mRNA and protein expression levels of ESRP1 in SCLC chemoresistant and chemosensitive cells. We found decreased expression of ESRP1 in H69AR and H446DDP cells compared with H69 and H446 cells, this result was in concordance with their higher IC50 values for chemotherapeutic drugs (Figure 2A–2C).
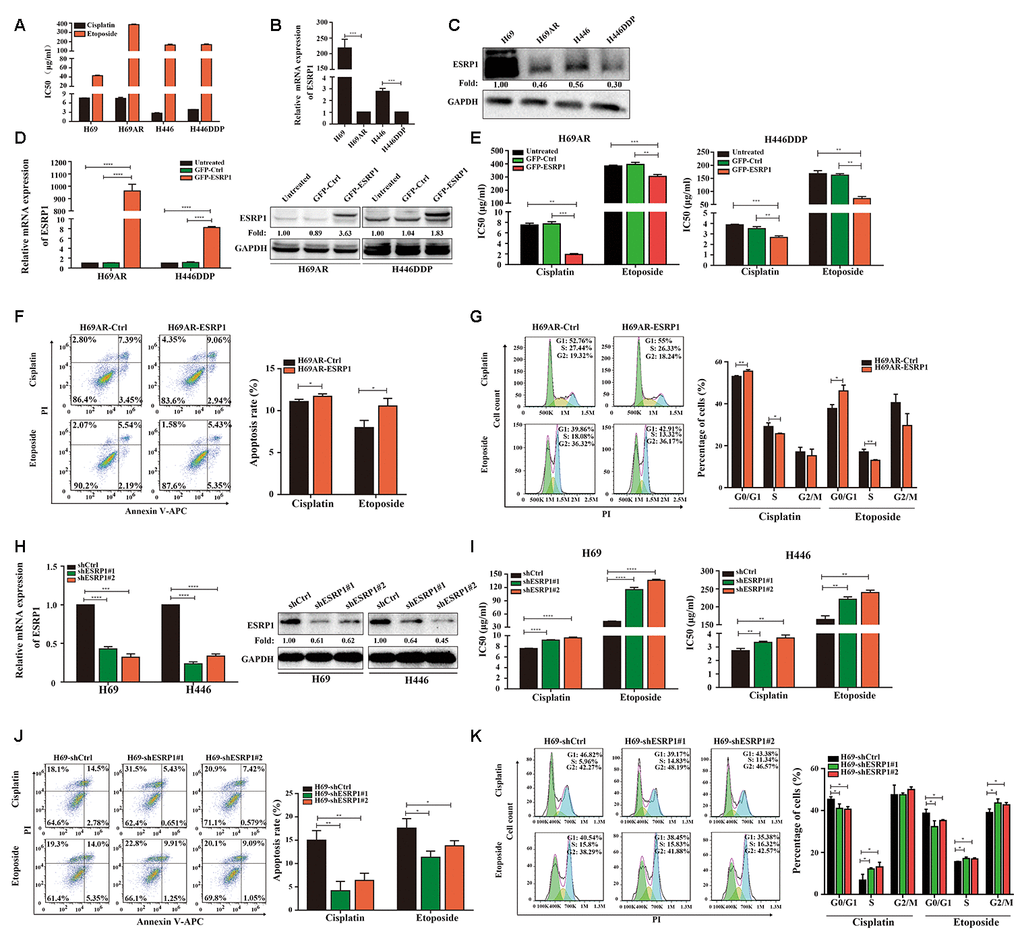
Figure 2. ESRP1 is reduced in chemoresistant SCLC cells and inhibits chemoresistance of SCLC in vitro. (A) IC50 values of cisplatin and etoposide in SCLC cells. (B) Differential expression of ESRP1 in SCLC chemoresistant cells (H69AR and H446DDP) and chemosensitive cells (H69 and H446) at transcriptional level. (C) Differential expression of ESRP1 in SCLC chemoresistant cells (H69AR and H446DDP) and chemosensitive cells (H69 and H446) at translational level. (D) Detection of ESRP1 up-regulation efficiency in H69AR and H446DDP cells at the transcriptional level and translational level. (E) CCK8 assay to detect IC50 value of cisplatin and etoposide after overexpressing ESRP1 in H69AR and H446DDP cells. (F) Cells apoptosis was analyzed by flow cytometry after treatment with cisplatin and etoposide for 24 hours in ESRP1 overexpressed cells. (G) Cells cycle arrest was analyzed by flow cytometry after treatment with cisplatin and etoposide for 24 hours in ESRP1overexpressed cells. (H) Detection of ESRP1 down-regulation efficiency in H69 and H446 cells at the transcriptional level and translational level. (I) CCK8 assay to detect IC50 value of cisplatin and etoposide after down-regulation of ESRP1 in H69 and H446 cells. (J) Cell apoptosis was analyzed by flow cytometry after treatment with cisplatin and etoposide for 24 hours in ESRP1-downregulated cells. (K) Cells cycle arrest was analyzed by flow cytometry after treatment with cisplatin and etoposide for 24 hours in ESRP1-downregulated cells. *, p<0.05; **, p <0.01; ***, p <0.001; ****, p <0.0001.
In order to clarify the role of ESRP1 in chemoresistance of SCLC, we transfected H69AR and H446DDP cells with lentivirus to stably overexpress ESRP1. The qRT-PCR and western blot assays were performed to judge vector transfection efficiency (Figure 2D). CCK8 assays were conducted to detect the chemosensitivity of SCLC cells to cisplatin and etoposide. The results showed that overexpression of ESRP1 increased chemosensitivity, with significant decreases in the IC50 values (Figure 2E). In addition, we also examined the effects of ESRP1 on cell apoptosis and cell cycle exposure to chemotherapeutic drugs. Compared with the control group, overexpression of ESRP1 significantly increased cell apoptosis and cell cycle arrest (Figure 2F, 2G).
Then we further verified the effect of ESRP1 on chemoresistance of SCLC in the parental sensitive H69 and H446 cells. We established stable ESRP1 knockdown in H69 and H446 cells, and through qRT-PCR and western blot experiments verified the knockdown efficiency of ESRP1 (Figure 2H). Contrary to the results of chemoresistant cells, decreased expression of ESRP1 resulted in promotion of SCLC chemoresistance (Figure 2I). Similarly, we confirmed the effect of ESRP1 knockdown on cell apoptosis and cell cycle. Contrary to the upregulation of ESRP1, the cell apoptosis and cell cycle arrest were reduced significantly (Figure 2J, 2K).
To further assess whether ESRP1 influenced chemoresistance of SCLC in vivo, we subcutaneously transplanted H69AR and H69 with altered ESRP1 expression into nude mice (Figure 3A, 3D). Consistent with our in vitro findings, overexpression of ESRP1 significantly reduced tumor volume and weight compared with those of the paired control group (Figure 3B, 3C), whereas knockdown of ESRP1 led to the opposite results (Figure 3E, 3F). These results indicate that ESRP1 promotes chemosensitivity and inhibits the growth of SCLC in vitro and in vivo.
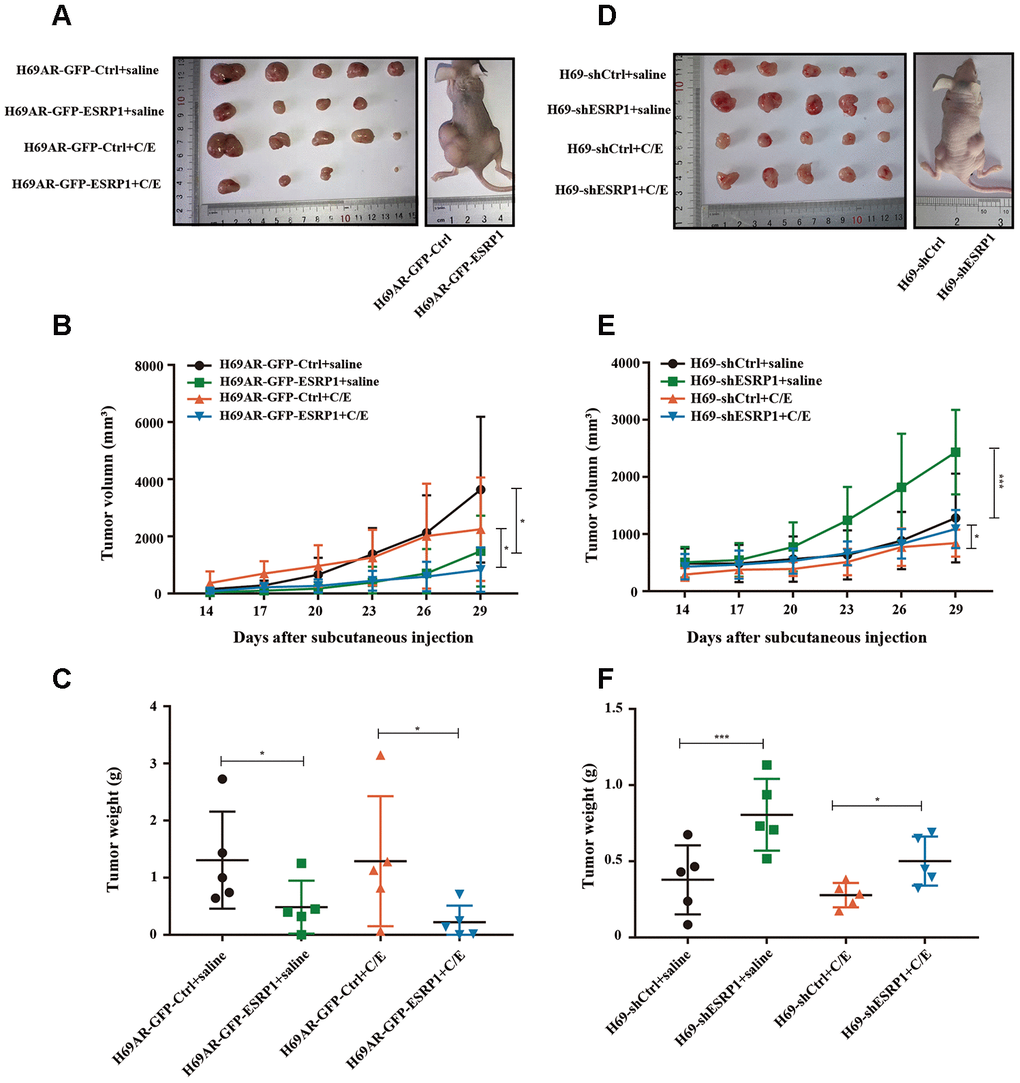
Figure 3. ESRP1 inhibits the growth and chemoresistance of SCLC in vivo. (A) Tumor formation of H69AR cells stably with up-regulated ESRP1 or the vector control (n = 5 nudes for each group). (B) Growth curve of tumor volumes. (C) Tumor weight taken from nude mice. (D) Tumors formation of H69 cells stably with down-regulated ESRP1 or the vector control (n = 5 nudes for each group). (E) Growth curve of tumor volumes. (F) Tumor weight taken from nude mice. *, p<0.05; ***, p <0.001.
ESRP1 mediates chemoresistance of SCLC by regulating alternative splicing of CARM1
To clarify the mechanism by which ESRP1 reversed SCLC chemoresistance, we conducted mRNA transcriptome sequencing with H69AR cells that stably overexpressed ESRP1. We identified 283 ESRP1-regulated AS events and found that various types of AS could be regulated by ESRP1, including skipped exon (SE), alternative 5′ss exon (A5SS), alternative 3′ss exon(A3SS), retained intron (RI), and mutually exclusive exons (MXEs) (Figure 4A and Supplementary Table 2). Then, we analyzed cellular functions of ESRP1-regulated AS events using gene ontology (GO) and found that ESRP1 affected genes in the RNA processing pathway, including mRNA splicing and mRNA metabolic processes (Figure 4B). Moreover, ESRP1 targets were also enriched with drug resistance-related functions, such as transmembrane receptor protein tyrosine kinase signaling pathway and Rho GTPase binding. Intriguingly, several ESRP1-regulated AS events were found to regulate the response to the chemical stimulus pathway. Although this enrichment of response to chemical stimulus was slightly below our significance cut-off, the changes in exon inclusion ratios were fairly large and, therefore, may have significant functional effects on consequences of drug resistance. Many of the ESRP1-regulated splicing targets were functionally connected to well-linked interaction networks, as judged by the Search Tool for the Retrieval of Interacting Genes/Proteins (STRING) (Figure 4C). As expected, a large subgroup of ESRP1 targets contained genes involved in RNA processing. Surprisingly, the other two subgroups included many genes involved in cell migration and cell cycle. Taken together, these results suggest that the biological processes affected by ESRP1 are related to apoptosis, proliferation, migration, and tumorigenesis. We subsequently validated mRNA-seq results by measuring splicing change in five newly identified targets that were selected arbitrarily to include genes with a drug resistance-related function (Figure 4E). We confirmed that ESRP1 either positively or negatively controlled all endogenous AS events tested and that the relative changes in exon inclusion ratio obtained from RT-PCR were highly consistent with mRNA-seq (Figure 4D). Taken together, these data imply that ESRP1 may be a key regulator that controls cancer progression.
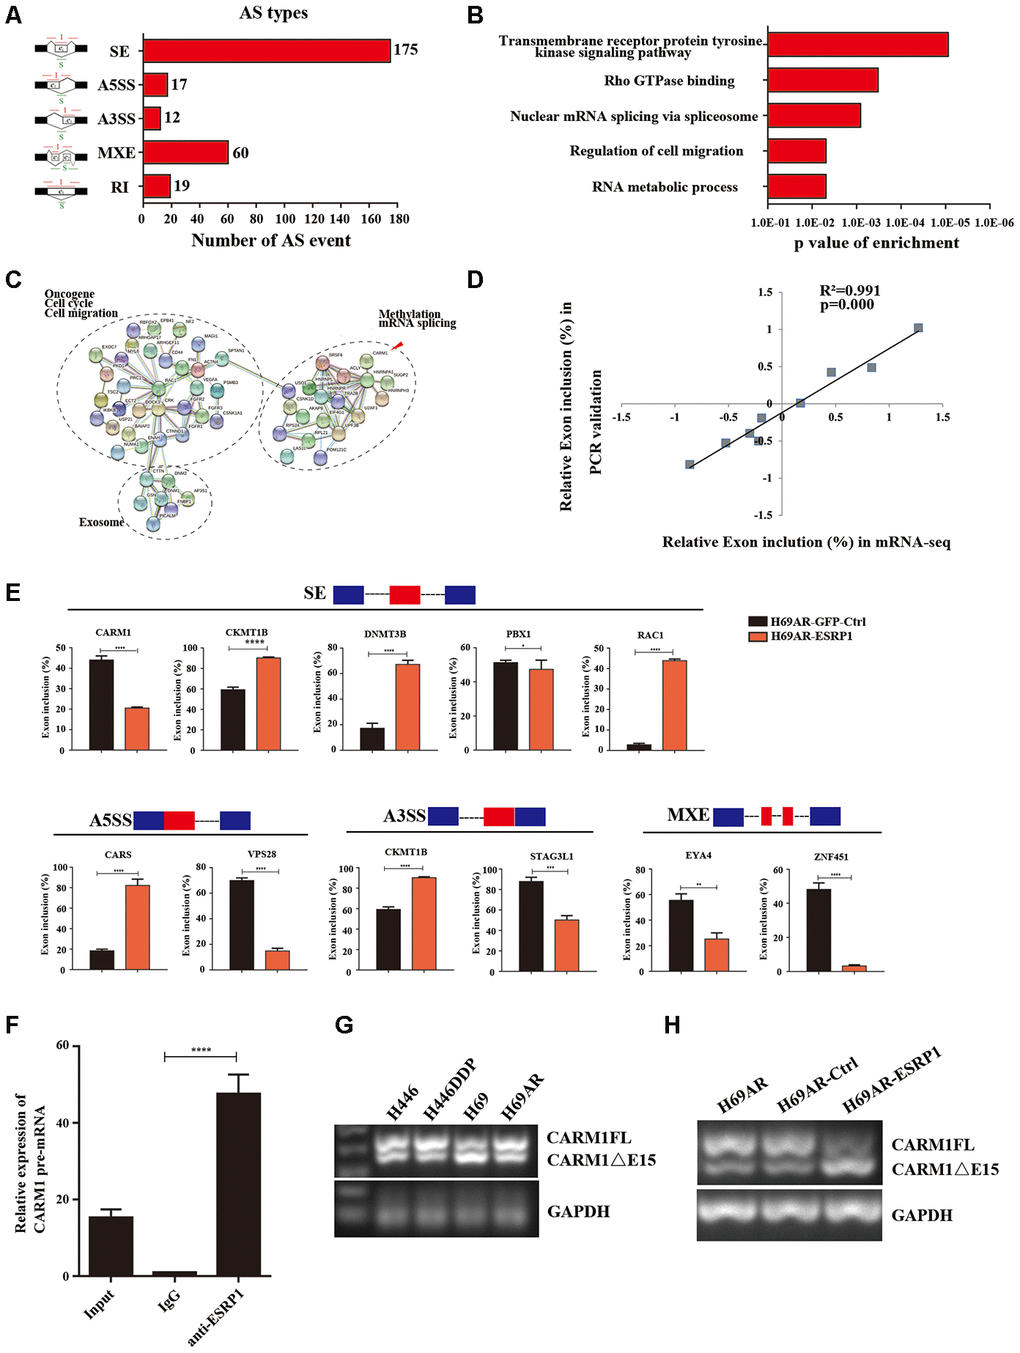
Figure 4. Global regulation of the transcriptome by ESRP1 in SCLC chemoresistance-related genes. (A) Quantification of the different AS events affected by ESRP1. (B) Gene ontology of ESRP1-regulated AS targets. Fisher exact p values were plotted for each enriched functional category. (C) Functional association network of ESRP1-regulated AS targets. The genes in (C) were analyzed using the STRING database, and subgroups are marked according to their functions. (D) Correlation between the relative changes in Exon inclusion ratio values observed by RNA-seq vs RT-PCR confirmation. (E) Validation of different types of ESRP1-regulated AS events by semiquantitative RT-PCR using H69AR cells transfected with ESRP1 or control vectors. The mean ± SD of Exon inclusion Ratio from three experiments were plotted. (F) The expression of CARM1 pre-mRNAs with ESRP1 was detected by RNA immunoprecipitation (RIP) assay in H69 cells. (G) Representative ethidium bromide stained agarose gel photo showing expression of CARM1FL and CARM1ΔE15 in chemoresistant and chemosensitive cells. (H) Representative ethidium bromide stained agarose gel photo showing expression of CARM1FL and CARM1ΔE15 after overexpressing ESRP1 in H69AR cells. *, p<0.05; **, p <0.01; ***, p <0.001; ****, p <0.0001.
We then explored the downstream splicing targets of ESRP1. Studies show that CARM1 methylated MED12 can increase chemosensitivity of breast cancer cells [26]. Wang et al. have confirmed that there are two major splice variants of CARM1 produced by AS, which are the full-length transcript of CARM1 (CARM1FL) and the deletion of exon 15 transcript (CARM1ΔE15). It has been confirmed that the deletion of exon 15 of CARM1 could block the self-methylation of CARM1, which in turn affects the transcriptional regulation of CARM1 on estrogen receptor-α (ERα). The CARM1 self-methylation site R511 is located on the fifteenth exon, and the self-methylation defect of CARM1 reduces the activity of CARM1 on the methylation of some protein substrates [27]. Therefore, we hypothesized that ESRP1 may regulate AS of CARM1 to affect SCLC chemoresistance. We performed a RIP assay using ESRP1 monoclonal antibody and found that ESRP1 enriched the pre-mRNA of CARM1 (Figure 4F). We detected the content of two splice isoforms of CARM1 in SCLC cells, and found that the content of CARM1FL in chemoresistant cells was significantly higher than that in chemosensitive cells, whereas the content of CARM1ΔE15 was completely opposite; this suggested that the alternative splicing of CARM1 is related to the chemoresistance of SCLC (Figure 4G). The RT-PCR results showed that ESRP1 increased the proportion of CARM1ΔE15 and decreased the proportion of CARM1FL (Figure 4H).
Since ESRP1 reduced the ratio of CARM1FL to CARM1ΔE15, in order to further examine the different roles of CARM1FL and CARM1ΔE15 in regulating chemoresistance of SCLC, we designed specific siRNAs targeting CARM1FL and CARM1ΔE15 transcripts respectively. We transfected siRNA in H69AR cells and verified the knockdown efficiency by qRT-PCR (Figure 5A). The CCK8 assay showed that the IC50 value was significantly decreased after CARM1FL or CARM1 knockdown, whereas the IC50 value did not change significantly after CARM1ΔE15 down-regulation (Figure 5B). These results suggested that knockdown of CARM1FL inhibits chemoresistance, CARM1ΔE15 may have no effect on chemoresistance of SCLC. To further demonstrate that ESRP1 affects chemoresistance of SCLC by regulating the content of different transcripts of CARM1, we performed rescue experiments in H69AR and H446DDP cells. We overexpressed CARM1FL or CARM1ΔE15 by using transfection plasmids and confirmed overexpression efficiency by qRT-PCR (Figure 5C and Supplementary Figure 1A). The CCK8 assays were performed in ESRP1-overexpressing cells with up-regulation of CARM1FL or CARM1ΔE15. The results showed significantly decreased IC50 values in ESRP1 overexpressing cells compared with the control group; upregulation of CARM1FL in ESRP1 overexpressing cells could reverse the decrease in IC50 values mediated by ESRP1 overexpression, whereas upregulation of CARM1ΔE15 cannot reverse the IC50 values (Figure 5D and Supplementary Figure 1B). Next, we conducted apoptosis and cell cycle cytometry analyses. We found that increased cell apoptosis and cell cycle arrest in ESRP1 overexpressing cells, and upregulation of CARM1FL in ESRP1 overexpressing cells could rescue the increase in cell apoptosis and cell cycle arrest regulated by ESRP1 overexpression. Similarly, upregulation of CARM1ΔE15 in ESRP1 overexpressing cells cannot rescue these (Figure 5F, 5G and Supplementary Figure 1C, 1D). In addition, western blot experiments showed that the changes to the expression levels of apoptotic proteins PARP and BAX are consistent with the results of flow cytometry (Figure 5E). These results demonstrate that ESRP1 affects chemoresistance of SCLC by reducing the proportion of CARM1FL, whereas CARM1ΔE15 has no effect on chemoresistance.
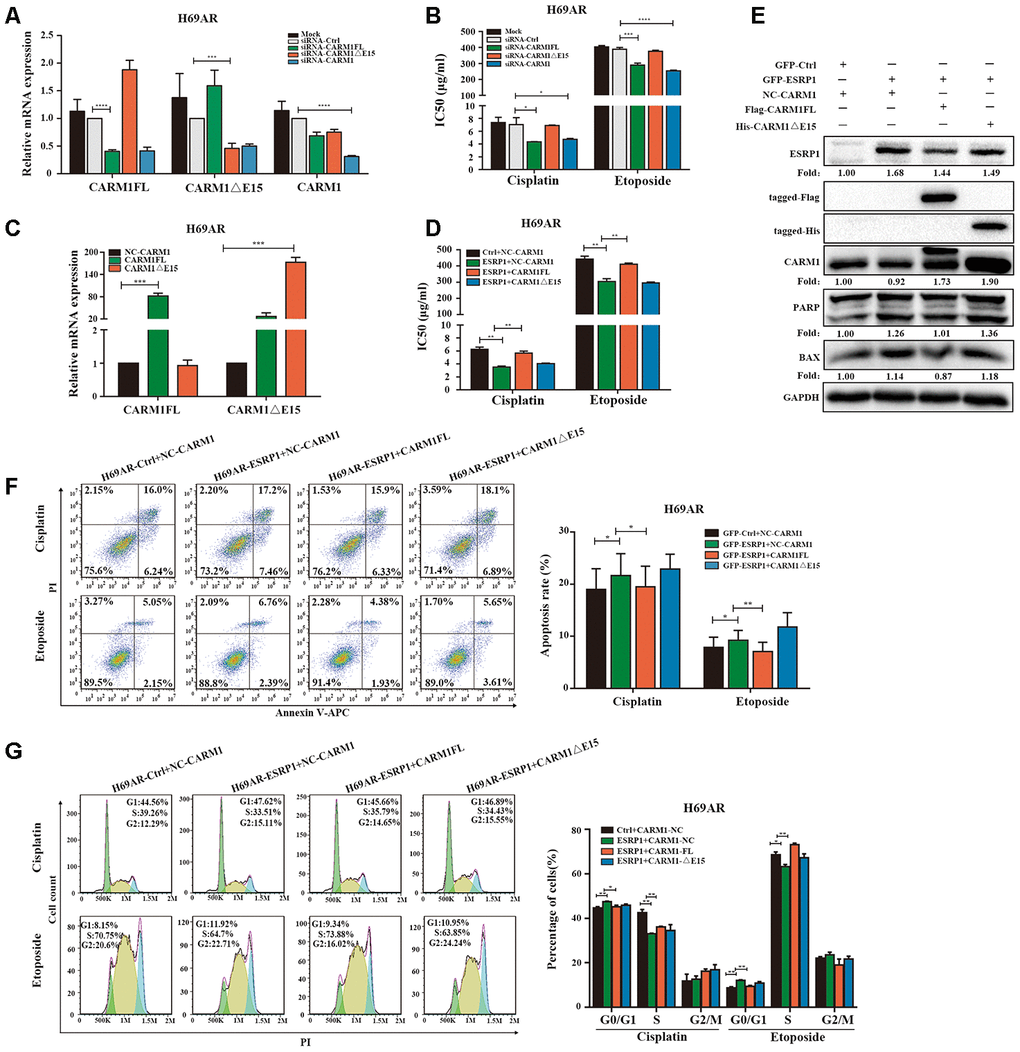
Figure 5. ESRP1 mediates chemoresistance of SCLC by regulating alternative splicing of CARM1. (A) Transfection of siRNA in H69AR cells and qRT-PCR assay to detect down-regulation efficiency. (B) Through CCK8 assay to detect IC50 value of cisplatin and etoposide after down-regulation of CARM1 in H69AR cells. (C) Transfected plasmids in H69AR and H446DDP cells to up-regulate the expression of CARM1FL and CARM1ΔE15, using qRT-PCR assay to detect down-regulation efficiency. (D) Through CCK8 assay to detect IC50 value of cisplatin and etoposide after up-regulation of CARM1 in H69AR cells. (E) Western blot assay was used to detect the expression of apoptosis-related proteins after H69AR cells were treated with cisplatin for 24 hours. (F) Cell apoptosis was analyzed by flow cytometry after H69AR cells were treated with cisplatin or etoposide for 24 hours. (G) Cell cycle arrest was analyzed by flow cytometry after H69AR cells were treated with cisplatin or etoposide for 24 hours. *, p<0.05; **, p <0.01; ***, p <0.001; ****, p <0.0001.
CARM1 activates TGF-β/Smad signaling pathway by regulating Smad7 arginine methylation CARM1 belongs to the PRMT proteins family, PRMTs can methylate arginine residues in histones, epigenetically control the expression of a series of genes, and can also modify non-histone proteins, including signal-conducting systems, to regulate their functions [28, 29]. Now that CARM1 has been shown to be regulated by ESRP1 and affects chemoresistance in SCLC, then we need to explore the mechanism through which CARM1 works. We used the pMeS database to predict genes that may undergo arginine methylation and found that there were 17 arginine methylation sites in the sequence of Smad7 (Table 3). Research by Katsuno et al. found that PRMT1 can methylate Smad6 and Smad7, promote the separation of Smad6/Smad7 from the receptor, and activate BMP-induced Smad1/Smad5 and TGF-β-induced Smad2/Smad3 [25, 30]. Furthermore, our group’s previous research already has shown that Smad7 can participate in chemoresistance in SCLC [20]. Therefore, we speculated that CARM1 could regulate arginine methylation of Smad7 to activate the TGF-β/Smad signaling pathway thereby promoting the chemoresistance of SCLC. To confirm the relationship between CARM1 and Smad7, we performed a Co-IP assay in H69AR cells and found that CARM1 physically interacted with Smad7 (Figure 6A). Then we used methyltransferase inhibitor ADOX to treat H69AR cells and observed the IC50 values by CCK8 assay (Figure 6B). The results showed that the IC50 value significantly decreased after inhibiting the effect of methyltransferase, thereby suggesting that CARM1 indeed promoted SCLC chemoresistance by methylating Smad7.
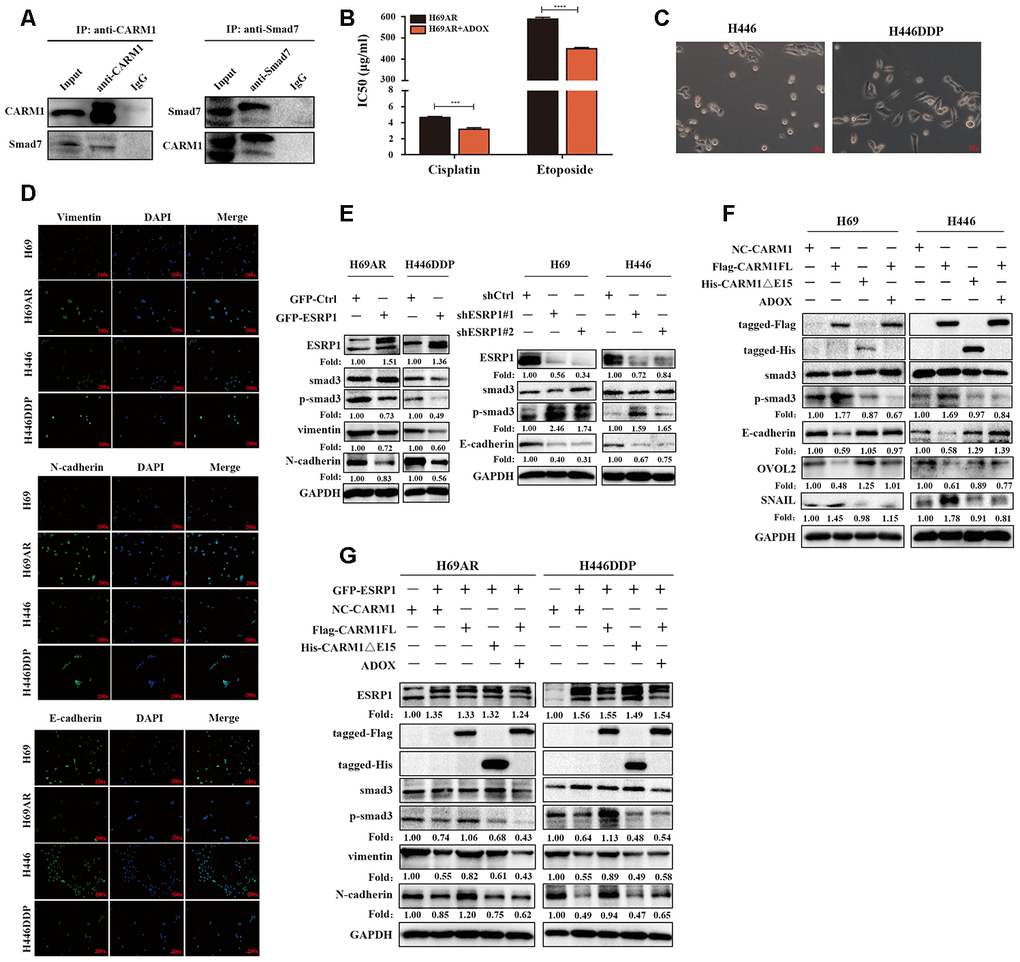
Figure 6. CARM1 activates TGF-β/Smad signaling pathway by regulating arginine methylation of Smad7. (A) Co-IP assays were conducted with specific CARM1 antibody and Smad7 antibody in H69AR cells. (B) H69AR cells were treated with 5 μM ADOX for 48 hours, then cells were exposed to cisplatin or etoposide for 24 hours, and IC50 values were measured by CCK8 assays. (C) Comparison of the basic morphology of chemosensitive cells and chemoresistant cells by optical microscope. (D) Immunofluorescence staining shows the expression of EMT marker protein. (E) The expression of ESRP1, Smad3, p-Smad3 and EMT-related proteins in stably upregulated or downregulated SCLC cells was detected by western blot assay. (F) Overexpressed CARM1FL or CARM1ΔE15 in H69 and H446 cells or treated cells with ADOX for 48 hours, western blot assay was performed to detect the expression of tag antibodies, Smad3, p-Smad3 and EMT-related proteins. (G) Overexpressed CARM1FL or CARM1ΔE15 in ESRP1-upregulated H69AR and H446DDP cells or treated cells with ADOX for 48 hours, western blot assay was performed to detect the expression of tag antibodies, Smad3, p-Smad3 and EMT-related proteins. *, p<0.05; **, p <0.01; ***, p <0.001; ****, p <0.0001.
Table 3. Prediction site of arginine methylation in Smad7 protein structure.
| Seq ID | R site | Peptides | Prediction score |
| Sequence | 3 | XXXXXXXMFRTKRSALVRR | 0.589355 |
| Sequence | 6 | XXXXMFRTKRSALVRRLWR | 0.640048 |
| Sequence | 11 | FRTKRSALVRRLWRSRAPG | 0.74468 |
| Sequence | 12 | RTKRSALVRRLWRSRAPGG | 0.921869 |
| Sequence | 15 | RSALVRRLWRSRAPGGEDE | 0.909561 |
| Sequence | 17 | ALVRRLWRSRAPGGEDEEE | 0.916009 |
| Sequence | 38 | GGGGGGGELRGEGATDSRA | 0.999324 |
| Sequence | 46 | LRGEGATDSRAHGAGGGGP | 0.99441 |
| Sequence | 57 | HGAGGGGPGRAGCCLGKAV | 0.99649 |
| Sequence | 67 | AGCCLGKAVRGAKGHHHPH | 0.973657 |
| Sequence | 118 | ELLLQAVESRGGTRTACLL | 0.9797 |
| Sequence | 122 | QAVESRGGTRTACLLLPGR | 0.953773 |
| Sequence | 131 | RTACLLLPGRLDCRLGPGA | 0.943454 |
| Sequence | 135 | LLLPGRLDCRLGPGAPAGA | 0.975753 |
| Sequence | 169 | CKVFRWPDLRHSSEVKRLC | 0.53692 |
| Sequence | 200 | VCCNPHHLSRLCELESPPP | 0.58066 |
| sequence | 213 | LESPPPPYSRYPMDFLKPT | 0.668651 |
In order to explore the relationship between chemoresistance and EMT phenotype, we first detected the basic morphology of chemoresistant cell H446DDP and chemosensitive cell H446. The results showed that H446 cells showed an epithelial phenotype, whereas H446DDP cells showed more of a mesenchymal phenotype (Figure 6C). Moreover, we analyzed the expression levels of EMT markers in chemoresistant cells and chemosensitive cells via immunofluorescence, we found that the expression levels of the mesenchymal markers vimentin and N-cadherin in chemoresistant cells H69AR and H446DDP were significantly higher than those of chemosensitive cells, whereas the expression level of epithelial marker E-cadherin was completely opposite (Figure 6D). We subsequently conducted rescue experiments to explore the mechanism by which the ESRP1/CARM1 axis involved in regulating the TGF-β/Smad signaling pathway and EMT. Overexpression of ESRP1 reduced the expression of phosphorylated-Smad3(p-Smad3), vimentin and N-cadherin; silencing of ESRP1 resulted in the opposite effects (Figure 6E). Overexpression of CARM1FL increased the expression of p-Smad3, EMT-inducing TF snail and reduced the expression of E-cadherin, EMT-inhibiting TF OVOL2, but the results could be rescued by addition of ADOX; Overexpression of CARM1ΔE15 had no effect on the protein expression (Figure 6F). Finally, we overexpressed ESRP1 in combination with upregulation of CARM1FL or CARM1ΔE15 in cells. We found that compared with overexpression of ESRP1 alone, simultaneous overexpression of ESRP1 and CARM1FL increased the expression of p-Smad3, vimentin, and N-cadherin. However, this effect was reversed after the addition of ADOX. Overexpression of ESRP1 and CARM1ΔE15 at the same time had no significant effects on the TGF-β/Smad signaling pathway and EMT compared with ESRP1 overexpression alone (Figure 6G). These results were consistent with previous functional experimental results, and proved that ESRP1 inhibits the activation of TGF-β/Smad signaling pathway by reducing the content of CARM1FL and thereby enhancing chemosensitivity of SCLC.