


Introduction
Socioeconomic inequalities in health are consistently observed and appear to persist into older ages [1, 2]. Socioeconomic status (SES) is a multifaceted concept incorporating multiple aspects of the social stratification process, including resource availability, power, and prestige [3]. Conventionally, SES has been captured using inter-related, yet conceptually distinct indicators, such as education, occupational class, or income, which influence health outcomes through different mechanistic pathways [4, 5]. However, other indicators of SES such as financial strain and wealth capture different dimensions of SES which may be especially relevant for older adults after retirement. Moreover, socioeconomic circumstances in childhood have been identified as important for health outcomes in old age [6], both through direct influences on late-life health, and indirect effects on downstream SES [7]. Nevertheless, much of the previous literature on health inequalities in older adults has not adequately considered the full complexity of SES, focusing only on a limited number of indicators and neglecting to consider the development of SES across multiple time-points throughout the life-course [7].
A life-course approach embraces the complexity of SES for understanding health in old age. It acknowledges that indicators are intertwined chronologically and that dynamic changes in SES may have important consequences for health in late life. Holistic assessments of SES throughout life are being increasingly used, with several recent studies highlighting the importance of childhood and adulthood SES indicators, and their interplay across life, for several health outcomes including disability, self-rated health, depression and cognition in old age [8–12]. Yet, even in life-course studies, SES measures from different life stages are often treated as distinct entities and their contribution to old-age health is estimated net of other life-course measures [11, 13]. However, given the inherent interrelatedness of socioeconomic indicators throughout life, investigating the joint effects of multiple SES indicators and their lifelong trajectories may be more informative than estimating the independent contribution of separate SES indicators.
In this study we use latent class analysis to identify people with similar socioeconomic profiles according to SES indicators spanning early life (childhood financial strain; parental occupational class), midlife (education, occupational class); and late life (homeownership, lack of financial assets, financial strain). Latent class analysis enables capturing the complexity of social position by simultaneously considering multiple socioeconomic indicators and identifying groups of individuals who share similar combinations of SES factors throughout life. To comprehensively capture health in old age, we investigate changes in the Health Assessment Tool (HAT) over 12 years, an integrated health measure in old age incorporating information not only on chronic disease, but also physical and cognitive function. Given the biological complexity and the heterogeneity of the ageing process, using multiple measures to reliably gauge health changes is crucial [14]. Our specific aims in this study were: 1) to identify distinct SES groups over the life-course; 2) to examine the association between the life-course SES groups and health changes over 12 years in individuals aged 60 years and older; and 3) to explore lifestyle factors and depressive symptoms as potential mechanisms in explaining any observed social gradient in older adults’ health.
Results
When deriving latent classes of lifelong socioeconomic position, the Akaike Information Criterion and Bayesian Information Criterion improved until the 4-class solution, and p-values for the Likelihood-Ratio test comparing the model to the saturated model increased substantially at 4-classes, indicating better model fit (Table 1). Given that the Bayesian Information Criterion did not improve further for five classes, and since the classes derived from the 4-class solution were more theoretically meaningful, we opted for four classes.
Table 1. Goodness-of-fit indices of latent class models with 2-5 classes.
| AIC | BIC | X2 (p-value) | |||||||||||||||||||||||||||||||||||||||||||||||||||||||||||||||||||||||||||||||||||||||||||||||||
| 2-class solution | 24 753.52 | 24 877.90 | 897.74 (p<0.001) | ||||||||||||||||||||||||||||||||||||||||||||||||||||||||||||||||||||||||||||||||||||||||||||||||
| 3-class solution | 24 483.91 | 24 673.45 | 606.13 (p<0.001) | ||||||||||||||||||||||||||||||||||||||||||||||||||||||||||||||||||||||||||||||||||||||||||||||||
| 4-class solution | 24 293.95 | 24 548.64 | 394.17 (p=0.404) | ||||||||||||||||||||||||||||||||||||||||||||||||||||||||||||||||||||||||||||||||||||||||||||||||
| 5-class solution | 24 268.82 | 24 588.66 | 347.04 (p=0.864) | ||||||||||||||||||||||||||||||||||||||||||||||||||||||||||||||||||||||||||||||||||||||||||||||||
| Note: AIC, Akaike Information Criterion; BIC, Bayesian Information Criterion where smaller values indicate improved model fit; X2 statistic obtained from Likelihood-Ratio against saturated model, where p-values >0.05 indicate that the model fits as well as the saturated model. | |||||||||||||||||||||||||||||||||||||||||||||||||||||||||||||||||||||||||||||||||||||||||||||||||||
Post-hoc posterior probabilities assigned individuals to four mutually exclusive SES groups labelled: High SES (n=795, 28.8%), Middle SES (n=1290, 46.7%), Low SES (n=572, 20.7%) and Mixed SES (n=103, 3.7%) (Table 2). The High SES group was characterized by professional parental occupations, postsecondary education (total: 97.2%; 6.6%, one or more years of higher education without university degree; 82.8%, undergraduate degree; 7.8%, postgraduate degree), professional occupations in mid-life, and limited financial difficulty in old age. The Middle SES group was characterized by parental non-manual occupations, high school education, non-manual midlife occupations, and limited financial difficulty in late life. Compared to High and Middle SES, twice as many in the Low SES group reported childhood financial strain. Most had parents with manual occupations, manual occupations themselves, and elementary education. The Mixed SES group was characterized by very high levels of financial strain, both in childhood and in older age, and had a substantially higher proportion of individuals reporting lack of financial assets and lack of homeownership compared to the other SES groups. However, their SES was mixed according to other indicators. In terms of parental occupational class and occupational class of the individual, the Mixed SES group slotted between the Middle and the Low SES group. Almost one-third of the Mixed group had postsecondary education – nearly double the proportion in the Middle SES group. Still a substantial proportion of the Mixed SES group also had elementary education (see Table 2 for detail).
Table 2. Distribution of socioeconomic indicators in the full sample and by the identified latent SES classes.
| Full sample (N=2760) | High SES (n=795, 28.8%) | Middle SES (n=1290, 46.7%) | Low SES (n=572, 20.7%) | Mixed SES (n=103, 3.7%) | ||||||
| n | % | n | % | n | % | n | % | n | % | |
| Childhood financial strain | ||||||||||
| No | 2082 | 75.4 | 654 | 82.3 | 1042 | 80.8 | 338 | 59.1 | 48 | 46.6 |
| Yes | 678 | 24.6 | 141 | 17.7 | 248 | 19.2 | 234 | 40.9 | 55 | 53.4 |
| Parental occupational class | ||||||||||
| Manual | 1056 | 38.3 | 96 | 12.1 | 496 | 38.5 | 411 | 71.8 | 53 | 51.5 |
| Non-manual | 1246 | 45.1 | 403 | 50.7 | 645 | 50.0 | 160 | 28.0 | 38 | 36.9 |
| Professional | 458 | 16.6 | 296 | 37.2 | 149 | 11.5 | 1 | 0.2 | 12 | 11.6 |
| Education | ||||||||||
| Elementary | 390 | 14.1 | 3 | 0.4 | 0 | - | 369 | 64.5 | 18 | 17.5 |
| High school | 1365 | 49.5 | 19 | 2.4 | 1089 | 84.4 | 203 | 35.5 | 54 | 52.4 |
| University (incl. incomplete) | 1005 | 36.4 | 773 | 97.2 | 201 | 15.6 | 0 | - | 31 | 30.1 |
| Occupational class | ||||||||||
| Manual | 564 | 20.4 | 0 | - | 133 | 10.3 | 387 | 67.7 | 44 | 42.7 |
| Non-manual | 1428 | 51.7 | 211 | 26.5 | 997 | 77.3 | 175 | 30.6 | 45 | 43.7 |
| Professional | 768 | 27.8 | 584 | 73.5 | 160 | 12.4 | 10 | 1.8 | 14 | 13.6 |
| Lack of financial assets | ||||||||||
| No | 2576 | 93.3 | 790 | 99.4 | 1277 | 99.0 | 484 | 84.6 | 25 | 24.3 |
| Yes | 184 | 6.7 | 5 | 0.6 | 13 | 1.0 | 88 | 15.4 | 78 | 75.7 |
| Financial strain | ||||||||||
| No | 2610 | 94.6 | 777 | 97.7 | 1253 | 97.1 | 571 | 99.8 | 9 | 8.7 |
| Yes | 150 | 5.4 | 18 | 2.3 | 37 | 2.9 | 1 | 0.2 | 94 | 91.3 |
| Homeownership | ||||||||||
| Rental/other | 1364 | 49.4 | 198 | 24.9 | 691 | 53.6 | 383 | 67.0 | 92 | 89.3 |
| Ownership | 1396 | 50.6 | 597 | 75.1 | 599 | 46.4 | 189 | 33.0 | 11 | 10.7 |
Table 3 presents baseline characteristics of the study population according to SES groups. Notable differences across SES groups were observed with respect to sex, baseline age, civil status, country of birth, lifestyle factors, and depressive symptoms
Table 3. Baseline characteristics of the full sample and by latent SES groups.
| Full sample (N=2760) | High SES (n=963, 34.9%) | Middle SES (n=1109, 40.2%) | Low SES (n=583, 21.2%) | Mixed SES (n=106, 3.8%) | |||||||||||||||||||||||||||||||||||||||||||||||||||||||||||||||||||||||||||||||||||||||||||||||
| n | % | n | % | N | % | n | % | n | % | pa | |||||||||||||||||||||||||||||||||||||||||||||||||||||||||||||||||||||||||||||||||||||||||
| Sex | <0.001 | ||||||||||||||||||||||||||||||||||||||||||||||||||||||||||||||||||||||||||||||||||||||||||||||||||
| Men | 1048 | 38.0 | 408 | 51.3 | 410 | 31.8 | 197 | 34.4 | 33 | 32.0 | |||||||||||||||||||||||||||||||||||||||||||||||||||||||||||||||||||||||||||||||||||||||||
| Women | 1712 | 62.0 | 387 | 48.7 | 880 | 68.2 | 375 | 65.6 | 70 | 68.0 | |||||||||||||||||||||||||||||||||||||||||||||||||||||||||||||||||||||||||||||||||||||||||
| Age cohort | <0.001 | ||||||||||||||||||||||||||||||||||||||||||||||||||||||||||||||||||||||||||||||||||||||||||||||||||
| 60 | 708 | 25.7 | 307 | 38.6 | 287 | 22.3 | 78 | 13.6 | 36 | 35.0 | |||||||||||||||||||||||||||||||||||||||||||||||||||||||||||||||||||||||||||||||||||||||||
| 66 | 538 | 19.5 | 177 | 22.3 | 268 | 20.8 | 74 | 12.9 | 19 | 18.5 | |||||||||||||||||||||||||||||||||||||||||||||||||||||||||||||||||||||||||||||||||||||||||
| 72 | 431 | 15.6 | 121 | 15.2 | 205 | 15.9 | 84 | 14.7 | 21 | 20.4 | |||||||||||||||||||||||||||||||||||||||||||||||||||||||||||||||||||||||||||||||||||||||||
| 78, 81 | 598 | 21.7 | 116 | 14.6 | 314 | 24.3 | 152 | 26.6 | 16 | 15.5 | |||||||||||||||||||||||||||||||||||||||||||||||||||||||||||||||||||||||||||||||||||||||||
| 84+ | 485 | 17.6 | 74 | 9.3 | 216 | 16.7 | 184 | 32.2 | 11 | 10.7 | |||||||||||||||||||||||||||||||||||||||||||||||||||||||||||||||||||||||||||||||||||||||||
| Age, mean (SD) | 72.3 (10.1) | 68.7 (8.9) | 72.7 (9.7) | 77.1 (10.4) | 69.7 (9.1) | <0.001 | |||||||||||||||||||||||||||||||||||||||||||||||||||||||||||||||||||||||||||||||||||||||||||||
| Civil status | <0.001 | ||||||||||||||||||||||||||||||||||||||||||||||||||||||||||||||||||||||||||||||||||||||||||||||||||
| Married/partner | 1302 | 47.2 | 507 | 63.9 | 588 | 45.6 | 196 | 34.3 | 11 | 10.7 | |||||||||||||||||||||||||||||||||||||||||||||||||||||||||||||||||||||||||||||||||||||||||
| Unmarried | 457 | 16.6 | 109 | 13.7 | 214 | 16.6 | 102 | 17.8 | 32 | 31.1 | |||||||||||||||||||||||||||||||||||||||||||||||||||||||||||||||||||||||||||||||||||||||||
| Widowed/divorced | 998 | 36.2 | 178 | 22.4 | 486 | 37.7 | 274 | 47.9 | 60 | 58.3 | |||||||||||||||||||||||||||||||||||||||||||||||||||||||||||||||||||||||||||||||||||||||||
| Migrant | <0.001 | ||||||||||||||||||||||||||||||||||||||||||||||||||||||||||||||||||||||||||||||||||||||||||||||||||
| No | 2480 | 89.9 | 721 | 90.7 | 1174 | 91.0 | 501 | 87.6 | 84 | 81.6 | |||||||||||||||||||||||||||||||||||||||||||||||||||||||||||||||||||||||||||||||||||||||||
| Yes | 280 | 10.1 | 74 | 9.3 | 116 | 9.0 | 71 | 12.4 | 19 | 18.4 | |||||||||||||||||||||||||||||||||||||||||||||||||||||||||||||||||||||||||||||||||||||||||
| Smoking | 0.004 | ||||||||||||||||||||||||||||||||||||||||||||||||||||||||||||||||||||||||||||||||||||||||||||||||||
| Never smoked | 1250 | 45.5 | 330 | 41.6 | 587 | 45.7 | 292 | 51.3 | 41 | 40.2 | |||||||||||||||||||||||||||||||||||||||||||||||||||||||||||||||||||||||||||||||||||||||||
| Smoked ever | 1090 | 39.7 | 347 | 43.8 | 509 | 39.7 | 200 | 35.2 | 34 | 33.3 | |||||||||||||||||||||||||||||||||||||||||||||||||||||||||||||||||||||||||||||||||||||||||
| Current smoker | 407 | 14.8 | 116 | 14.6 | 187 | 14.6 | 77 | 13.5 | 27 | 26.5 | |||||||||||||||||||||||||||||||||||||||||||||||||||||||||||||||||||||||||||||||||||||||||
| Alcohol use | <0.001 | ||||||||||||||||||||||||||||||||||||||||||||||||||||||||||||||||||||||||||||||||||||||||||||||||||
| No or occasional | 729 | 30.2 | 111 | 15.7 | 331 | 29.1 | 245 | 50.5 | 42 | 50.0 | |||||||||||||||||||||||||||||||||||||||||||||||||||||||||||||||||||||||||||||||||||||||||
| Light or moderate | 1277 | 52.9 | 438 | 61.8 | 611 | 53.7 | 199 | 41.0 | 29 | 34.5 | |||||||||||||||||||||||||||||||||||||||||||||||||||||||||||||||||||||||||||||||||||||||||
| Heavy | 409 | 16.9 | 160 | 22.6 | 195 | 17.2 | 41 | 8.5 | 13 | 15.5 | |||||||||||||||||||||||||||||||||||||||||||||||||||||||||||||||||||||||||||||||||||||||||
| BMI, mean kg/m2 (SD) | 25.7 (4.1) | 25.6 (3.7) | 25.8 (4.2) | 25.8 (4.2) | 26.9 (4.9) | 0.016 | |||||||||||||||||||||||||||||||||||||||||||||||||||||||||||||||||||||||||||||||||||||||||||||
| Depressive symptoms, mean MADRS scoreb (SD) | 2.5 (3.7) | 2.1 (3.1) | 2.4 (3.6) | 2.8 (3.9) | 5.0 (6.1) | <0.001 | |||||||||||||||||||||||||||||||||||||||||||||||||||||||||||||||||||||||||||||||||||||||||||||
| ap-value for X2 tests for categorical variables and ANOVA tests for continuous variables. | |||||||||||||||||||||||||||||||||||||||||||||||||||||||||||||||||||||||||||||||||||||||||||||||||||
| bContinuous MADRS score ranging from 0-60 where higher scores indicate greater and more severe depressive symptoms. | |||||||||||||||||||||||||||||||||||||||||||||||||||||||||||||||||||||||||||||||||||||||||||||||||||
Baseline health by SES group and age is illustrated in Figure 1. The average health status of Mixed SES individuals at age 60 was comparable to the health of High SES individuals at the age of 78. Substantial cognitive and physical deficits indicated by HAT scores <7 were on average experienced by the Mixed SES group already at 72 years, the Low SES group at 78 years, and the High SES group at 84 years.
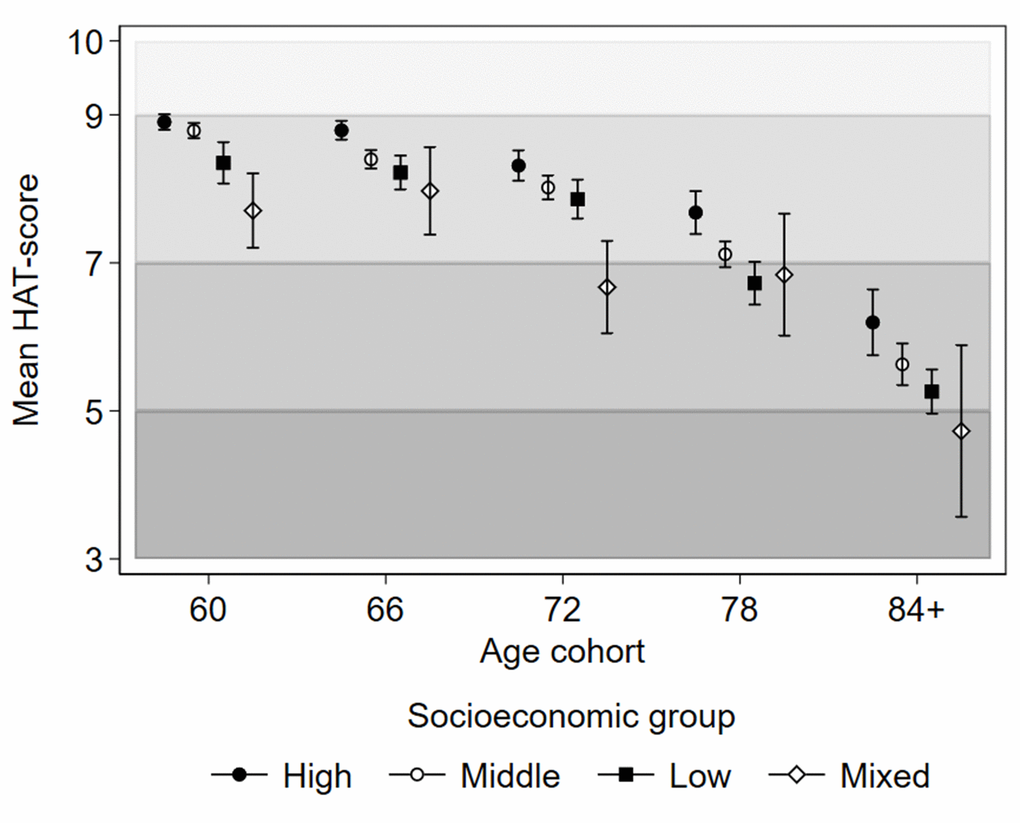
Figure 1. Baseline health status as indicated by mean HAT-scores with 95% confidence intervals by latent socioeconomic groups and age cohorts of the Swedish National Study on Aging and Care in Kungsholmen, Stockholm, Sweden. The shading of the graph represents the clinical characterization of HAT-scores: 3-4.9 mild functional dependence; 5-6.9 compromised physical functioning with multimorbidity with some cognitive deficits; 7-8.9 slight functional or cognitive impairments with some morbidities, and 9-10 good functioning and morbidity status.
Associations between SES groups and HAT over 12 years are presented in Table 4, and the predicted trajectories of health decline for SES groups are illustrated in Figure 2. In the age- and sex-adjusted model Mixed SES had the poorest health at baseline, followed by Low SES, relative to the High SES group, (Table 4, Model 1; Figure 2A). Low SES had the fastest health decline, and over time, the health trajectories of the Low and Mixed SES groups converged (Figure 2A), while the High and Middle SES groups had slower health deterioration.
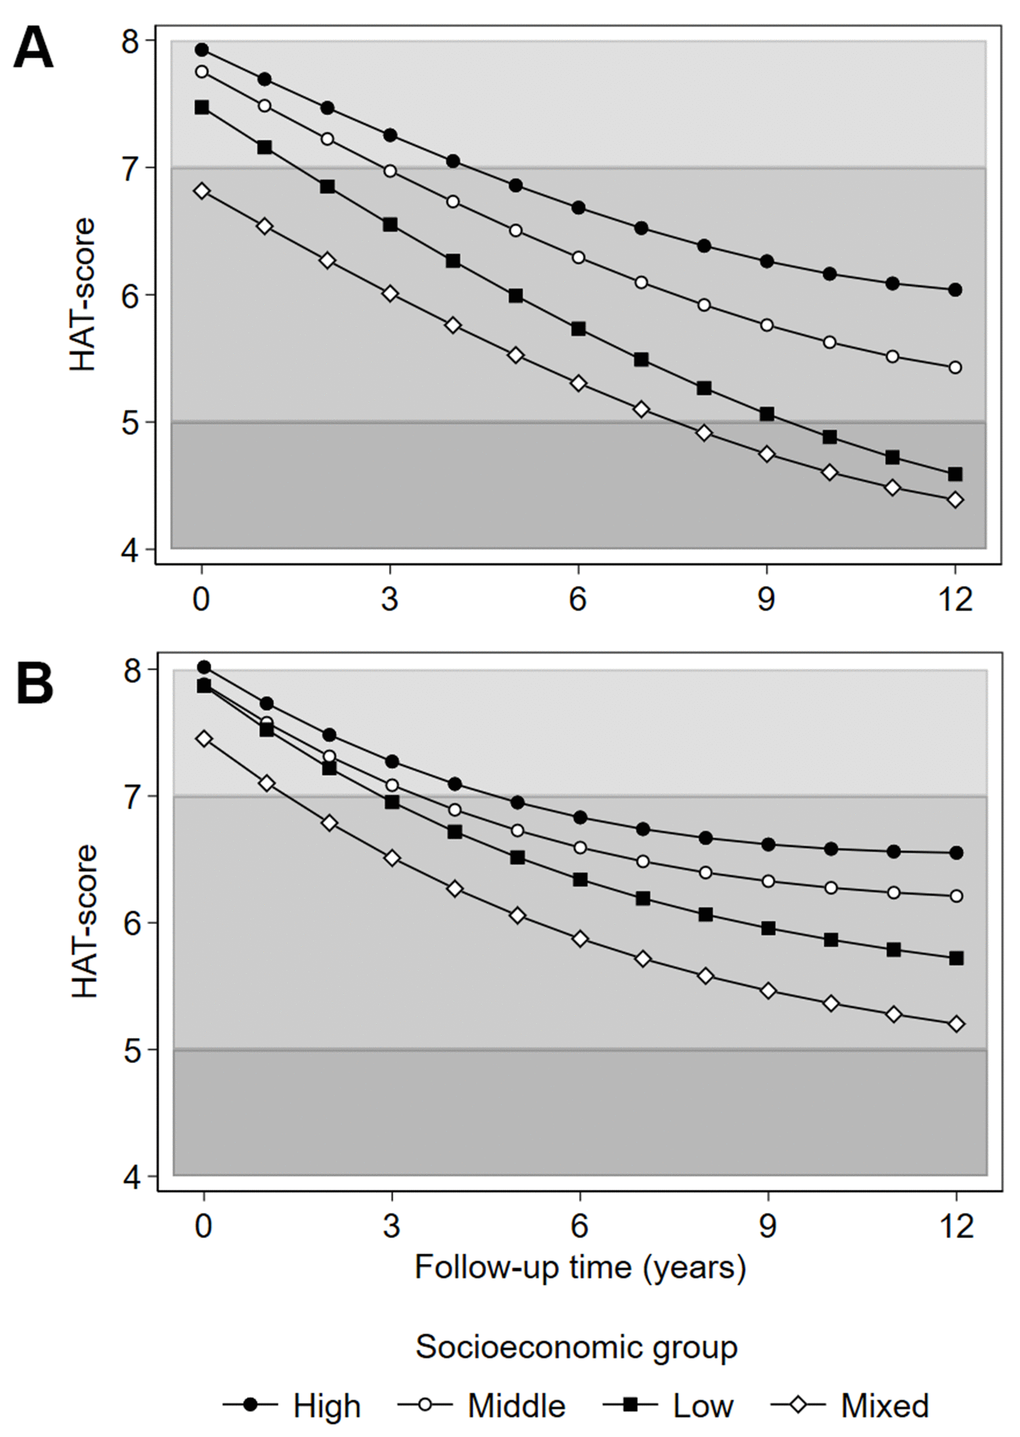
Figure 2. Predicted HAT-score over 12 years of follow-up by latent socioeconomic groups. (A) adjustment for age and sex; (B) adjustment for age, sex, civil status, migrant status, smoking, alcohol use, body mass index and depressive symptoms (Montgomery-Åsberg Depression Rating Scale score). Civil status, smoking, alcohol use, body mass index and depressive symptoms are time-varying covariates. The shading of the graph represents the clinical characterization of HAT-scores: 4-4.9 mild functional dependence; 5-6.9 compromised physical functioning with multimorbidity and some cognitive deficits; 7-8 slight functional or cognitive impairments with some morbidities.
Table 4. Associations between SES groups and health status at baseline (HAT-score) and HAT-score changes over 12 years.
| β (95% CI) | |||||||||||||||||||||||||||||||||||||||||||||||||||||||||||||||||||||||||||||||||||||||||||||||||||
| Model 1a | Model 2b | Model 3c | Model 4d | ||||||||||||||||||||||||||||||||||||||||||||||||||||||||||||||||||||||||||||||||||||||||||||||||
| HAT score at baseline (ref: High SES) | |||||||||||||||||||||||||||||||||||||||||||||||||||||||||||||||||||||||||||||||||||||||||||||||||||
| Middle SES | -0.17** | (-0.30 - -0.04) | -0.14** | (-0.27 - -0.01) | -0.11* | (-0.24 - 0.02) | -0.13** | (-0.26 - -0.01) | |||||||||||||||||||||||||||||||||||||||||||||||||||||||||||||||||||||||||||||||||||||||||||
| Low SES | -0.45*** | (-0.62 - -0.29) | -0.39*** | (-0.56 - -0.23) | -0.17* | (-0.33 - 0.00) | -0.15* | (-0.31 - 0.01) | |||||||||||||||||||||||||||||||||||||||||||||||||||||||||||||||||||||||||||||||||||||||||||
| Mixed SES | -1.11*** | (-1.41 - -0.81) | -0.97*** | (-1.27 - -0.66) | -0.71*** | (-1.02 - -0.40) | -0.56*** | (-0.87 - -0.26) | |||||||||||||||||||||||||||||||||||||||||||||||||||||||||||||||||||||||||||||||||||||||||||
| Slope of HAT score (ref: High SES) | |||||||||||||||||||||||||||||||||||||||||||||||||||||||||||||||||||||||||||||||||||||||||||||||||||
| Middle SES * time | -0.04*** | (-0.057 - -0.02) | -0.04*** | (-0.06 - -0.02) | -0.03*** | (-0.05 - -0.01) | -0.02** | (-0.03 - -0.001) | |||||||||||||||||||||||||||||||||||||||||||||||||||||||||||||||||||||||||||||||||||||||||||
| Low SES * time | -0.08*** | (-0.110 - -0.06) | -0.08*** | (-0.11 - -0.05) | -0.06*** | (-0.09 - -0.04) | -0.06*** | (-0.08 - -0.03) | |||||||||||||||||||||||||||||||||||||||||||||||||||||||||||||||||||||||||||||||||||||||||||
| Mixed SES * time | -0.05* | (-0.10 - 0.01) | -0.05* | (-0.10 - 0.01) | -0.06** | (-0.11 - -0.01) | -0.07*** | (-0.11 - -0.02) | |||||||||||||||||||||||||||||||||||||||||||||||||||||||||||||||||||||||||||||||||||||||||||
| Observations | 6,876 | 6,853 | 6,215 | 5,908 | |||||||||||||||||||||||||||||||||||||||||||||||||||||||||||||||||||||||||||||||||||||||||||||||
| Number of individual respondents | 2,716 | 2,715 | 2,493 | 2,467 | |||||||||||||||||||||||||||||||||||||||||||||||||||||||||||||||||||||||||||||||||||||||||||||||
| aAdjusts for age and sex. | |||||||||||||||||||||||||||||||||||||||||||||||||||||||||||||||||||||||||||||||||||||||||||||||||||
| bAdjusts for age, sex, civil status, and migrant status. | |||||||||||||||||||||||||||||||||||||||||||||||||||||||||||||||||||||||||||||||||||||||||||||||||||
| cAdjusts for age, sex, civil status, and migrant status, smoking, alcohol use, and BMI | |||||||||||||||||||||||||||||||||||||||||||||||||||||||||||||||||||||||||||||||||||||||||||||||||||
| dAdjusts for age, sex, civil status, and migrant status, smoking, alcohol use, BMI, and depressive symptoms | |||||||||||||||||||||||||||||||||||||||||||||||||||||||||||||||||||||||||||||||||||||||||||||||||||
| Note: civil status, smoking, alcohol use, BMI and mental health were time-varying covariates; all models additionally adjust for quadratic and cubic time. | |||||||||||||||||||||||||||||||||||||||||||||||||||||||||||||||||||||||||||||||||||||||||||||||||||
| *** p<0.01, ** p<0.05, * p<0.1. | |||||||||||||||||||||||||||||||||||||||||||||||||||||||||||||||||||||||||||||||||||||||||||||||||||
In models 2, 3 and 4 (Table 4) we performed stepwise adjustments to the association between SES groups and health. Civil status and migrant status only marginally affected the SES gradient. Lifestyle factors attenuated the health disadvantage of the Low, but not the Mixed SES group. Additional adjustment for depressive symptoms further attenuated the social gradient, although the health disadvantage of the Mixed SES group, both in terms of lowest baseline levels and fastest deterioration relative to the High SES group, remained (Table 4, Model 4; Figure 2B). Full model estimates are available in Supplementary Table 1.
We adjusted for time until study exit to examine whether selective attrition influenced observed associations. We also excluded those living in care homes, group living, or other institutional living arrangements (n=68; 2.5% of the sample). For both sets of sensitivity analyses, the principal results remained intact (analysis not shown).
We also attempted alternative clustering techniques using two unsupervised machine learning approaches: K-modes (with and without predefined starting vectors) and hierarchical clustering (divisive technique). A cluster representative of the Mixed SES group emerged in both K-modes with predefined starting vectors (selected based on the most prevalent SES characteristics in the four LCA groups), and in a hierarchical clustering approach. These additional analyses, however, proved sensitive to the selection of initializing points and introduced interpretational complexity by subdividing stable SES groups into theoretically unintuitive components. We opted for an LCA-based operationalization of SES groups, since it offers diagnostic statistics to identify the appropriate number of clusters, provides stronger interpretation ability, and easily incorporates variables at different scales.
Finally, we explored SES clustering with a data-dimension-reduction technique using multiple correspondence analysis. We also plotted the original data in a reduced two-dimensional grid (see Supplementary Figure 2). The results revealed that observations characterized by financial difficulty clustered in a distinctly different area of the 2-D grid compared to those defined by higher educational or occupational attainment. This analysis confirmed the importance of identifying a subset of the data defined by financial distress, which is also a defining characteristic of the Mixed SES group identified in LCA.
Discussion
In this longitudinal population-based study, we found four distinct SES groups: stable High, Middle and Low SES groups, and a Mixed SES group with varied education, occupational class, and parental occupational class, but distinctly characterized by financial difficulty in childhood and late life. Baseline health comparisons indicated that the Mixed SES group, on average, experienced substantial cognitive and physical deficits approximately 12 years earlier than the High SES group. Health trajectories over time followed an expected social gradient for the stable SES groups, while the Mixed SES group exhibited the fastest health decline. Lifestyle factors and depressive symptoms partially accounted for the health disadvantage of the Low SES group, while the Mixed SES group remained robust to adjustment for these factors. These results illustrate the importance of capturing socioeconomic heterogeneity across the life-course for understanding health inequalities in older age.
The three stable life-course SES groups were homogenous across all the socioeconomic indicators that we used, consistent with past research which has used similar methods to identify stable SES groups across the life-course [15]. We also identified a novel Mixed SES group which placed in between the Middle SES and Low SES groups on mid-life socioeconomic indicators but had the lowest SES according to all indicators captured in late life. This particular life-course SES trajectory has not yet been observed, but it is supported by previous research reporting that financial strain in childhood and across the life-course is important for health outcomes in old age [16, 17].
The observed health gradient across the stable High, Middle and Low SES groups is consistent with accumulating advantages and adversities over the life-course in relation to late-life health [6, 15, 18, 19]. The finding that health inequalities increased with age, contrasts some research reporting converging health trajectories between SES groups, a so-called leveling effect of age [2, 20]. Possible explanations may be that other studies relied on a limited number of conventional socioeconomic indicators such as education, occupational class and income that become increasingly irrelevant with age [4], used a unidimensional measure of health (e.g. morbidity), or had short follow-up durations. In contrast, our study used multiple socioeconomic indicators throughout life together with a health measure integrating cognitive and physical functioning, as well as morbidity, that was assessed over a prolonged period across a broad range of older ages.
The finding that the best health outcomes were observed in the High SES group, characterized by consistently high values across all life-course socioeconomic indicators, possibly suggests cumulative mechanisms of health advantage [18]. For example, high education is often a prerequisite for higher status occupations, providing a variety of health benefits, including health literacy, as well as avoidance of occupational health risks [3]. Furthermore, higher earnings from higher status occupations enable the accumulation of wealth, as evidenced by the large share of homeowners in the High SES group. Wealth, in turn, contributes to improved health not only through access to material resources, but also through avoidance of the psychosocial stress associated with socioeconomic deprivation [21].
The association between financial deprivation and poor health outcomes in older age has been reported previously [16, 17, 22, 23], especially in regions lacking universal health insurance [24]. It is, therefore, noteworthy that in the Swedish welfare context where state pensions and benefit systems ensure affordable medication and largely non-existent absolute poverty, the worst health outcomes were found in the Mixed SES group, predominantly characterized by financial strain. Already at baseline, the Mixed group had a mean score of HAT<7, indicating compromised physical functioning with multimorbidity and some cognitive deficits, while comparable health deficits occurred considerably later for the other SES groups. Given the steep rate of health deterioration, the Mixed SES group was also the first to cross the clinical HAT-threshold of 5, indicating functional dependence (a similar transition was only observed in the Low SES group, albeit one year later). Some have suggested that financial strain is especially detrimental to health in old age when it is persistent, as opposed to being experienced at critical windows [16], potentially reflecting the consequences of prolonged material and psychosocial deprivation [25]. Our results tentatively support this possibility, although we lacked an explicit measure of financial strain in midlife.
Lifestyle factors partially attenuated the health disadvantage of the stable Middle and Low SES groups (relative to High SES), which is consistent with the findings on the social patterning of behavioral risk factors [26]. Depressive symptoms also contributed to the health gradient across the stable SES groups, in line with prior findings that depression partially mediates health inequalities in older age [27]. In contrast, the health disadvantage of the Mixed SES group was robust to adjustment for covariates. One possibility could be stress and early adversity associated with childhood financial strain, which may have proximal consequences for health, as well as indirect influences on cascading social disadvantages in midlife [28]. Deprivation-driven psychosocial adversity and stress may further increase the likelihood of mental illness in adulthood [17, 29], whereas mental disorders are prospectively associated with both financial difficulty and poorer health in older age [30, 31]. While we adjusted for depressive symptoms in old age, depression earlier in life could nonetheless be a possibility. Finally, late-life social support and social network have been shown to influence health outcomes including multimorbidity, disability, and mortality in old age [32–35] and few in the Mixed SES group were married or had a partner. The interplay between financial loss, unemployment, or spousal loss could be a source of financial as well as psychosocial instability, especially considering the contrast between the Mixed and the Low SES group.
Our study has some limitations. The small size of the Mixed SES group combined with somewhat greater variability within the group, may have limited the precision of statistical comparisons. Notably, our results suggest that the difference between the Mixed and the High SES groups is substantial enough to be ascertained statistically, although there is a possibility that a less acute comparison between the Low and the Mixed group lacked power to be identified robustly. Importantly, our large overall sample enabled us to uncover this small, yet substantially disadvantaged group in terms of health outcomes. We encourage future studies with access to financial difficulty, both in childhood and late life, to verify our findings. The sample was obtained from a relatively affluent and homogenous area in Stockholm, Sweden. It is therefore likely that more heterogeneous classes would have been identified in a more diverse area, in line with research in urban areas [36]. Yet, even in this relatively homogenous sample we observed a clear social gradient, robust to adjustment of lifestyle factors and depressive symptoms. Self-reported measures of life-course SES may also be prone to recall bias, especially in elderly samples. We addressed this by excluding persons with diagnosed or probable dementia and cognitive impairment, but the possibility of misclassification remains. Furthermore, restricting the study population to cognitively intact participants without dementia, may have underestimated socioeconomic health inequalities, especially given the documented association between education and dementia [37]. Since we lacked information regarding midlife financial strain, this also limits any conclusions regarding the role of financial strain throughout the life-course. We also lacked information on health prior to old age and cannot rule out the possibility that poor health in childhood compromised socioeconomic attainment. One possibility could be to classify health status first and to search for matched SES characteristics within the HAT score strata, and other studies may consider exploring this approach.
Conclusions
We identified stable life-course SES groups which followed an expected gradient in health, and an atypical SES trajectory characterized by financial strain which had the poorest health of all SES groups. This health disadvantage was not explained by lifestyle factors or depressive symptoms, potentially pointing towards the importance of psychosocial aspects of financial strain. Our study highlights the relevance of considering multiple socioeconomic indicators over the life-course to understand social inequalities in older adults’ health.
Materials and Methods
Study design and population
We used data from the Swedish National study on Aging and Care, Kungsholmen, a population-based longitudinal study of adults aged 60 years or above living at home or in an institution in Kungsholmen, Stockholm, Sweden (N=3363) [38]. Participants were randomly sampled within 11 age-strata and assessed at baseline between 2001-2004 (participation rate: 73.3%) and at up to four follow-up points, equivalent to 12 years. We excluded those with dementia, intellectual disability, cognitive impairment (Mini-Mental State Exam scores <24) or with missing dementia information at baseline (n=380) to minimize recall bias. We subsequently excluded those with incomplete information on any of the SES indicators (n=223), producing an analytical sample of N=2760 (see Supplementary Figure 1). Ethical approval at each contact was obtained from the Regional Ethical Review Board in Stockholm. All study participants or their next of kin provided written informed consent.
Measures
Socioeconomic status (SES)
We used seven measures of life-course SES from the baseline nurse interview to derive the latent socioeconomic groups: financial strain and parental occupational class (childhood); education and occupational class (midlife); homeownership, lack of financial assets, and financial strain (late life). To measure childhood financial strain, participants were asked if their family struggled financially during their childhood (yes/no). The main occupations of participants’ parents until age 16 of participants were classified using the Swedish socioeconomic index of occupation, collapsing the derived categories into manual, non-manual, and professional, using the highest occupation of either parent. Education was categorized as elementary, secondary, or post-secondary/university. Participants’ longest held occupation was classified using the Swedish socioeconomic index and categorized into manual, non-manual, and professional. Lack of financial assets at the time of interview was captured by asking if respondents could pay an unexpected expense of 14,000 SEK (approximately €1330) within a week. Financial strain was assessed by inquiring about difficulties to keep up with payments (e.g. rent or bills) in the past 12 months. Homeownership distinguished between those owning their property versus rentals or other forms of housing.
Health
The Health Assessment Tool (HAT) provided a comprehensive assessment of older adults’ health [39, 40]. HAT combines five domains of health and functioning: 1) limitations in activities of daily living (ADL) (e.g. bathing, dressing), 2) limitations in instrumental ADL (e.g. grocery shopping, housekeeping), 3) cognitive functioning as assessed by the Mini-Mental State Exam 4) gait speed as assessed by time to walk 6 meters or 2.44 meters if walking difficulty was reported, and 5) chronic multimorbidity as a count of conditions that are prolonged and either leave residual disability, adversely affect quality of life, or require substantial care (918 chronic disease codes from the International Statistical Classification of Diseases and Related Health Problems 10th Revision, belonging to 60 disease categories identified from clinical assessments, laboratory tests, drug use, and patient records) [41]. HAT-scores were computed using nominal response models, producing an overall index score of 0-10 with clinical cut-offs of: 0-1.9: severe functional dependence; 2-4.9: mild functional dependence; 5-6.9: compromised physical functioning with multimorbidity and some cognitive deficits; 7-8.9 slight functional or cognitive impairments with some morbidities; and 9-10: good functioning and morbidity status [39].
Covariates
Demographic covariates included sex, age, civil status (married/cohabiting with partner, widowed, unmarried, and divorced), and immigrant status (Swedish born vs. foreign-born). Smoking was categorized as: never smoked, smoked in the past, and current smokers. Alcohol use was coded as no/occasional, light/moderate, and heavy, taking both frequency and quantity of consumption into consideration, computed separately for men and women. BMI was derived from height and weight measures (kg/m2). Depressive symptoms were assessed using the Montgomery-Åsberg Depression Rating Scale; a subscale of the Comprehensive Psychopathological Rating Scale validated for older adults [42, 43]. Civil status, smoking, alcohol use, BMI, and depressive symptoms were assessed at baseline and each follow-up point and were time-varying covariates.
Analysis
Estimating latent socioeconomic groups
Latent class analysis, a statistical person-centered approach which groups individuals into unobserved classes based on responses to manifest variables [44], was used to derive the latent SES groups from the seven socioeconomic indicators. The Stata 15 command gsemlclass estimated the latent class models using maximum-likelihood estimation [45]. We began with a two class-solution, incrementally increasing the number of classes. Statistical criteria and interpretations based on subject matter knowledge determined the final choice of latent classes. Goodness-of-fit indices included Akaike Information Criterion [46], Bayesian Information Criterion [47], and the Likelihood-Ratio Test. Participants were assigned to one class according to their highest posterior probability [48]. Derived classes were described according to the socioeconomic indicators contributing to the latent class analysis, and other baseline characteristics.
Associations between latent socioeconomic groups and health
Linear mixed models estimated trajectories of health change for the derived latent socioeconomic groups. Interactions between follow-up time and socioeconomic groups were included as fixed effects, and random effects for individual and follow-up time were included, using an unstructured covariance structure and a restricted maximum likelihood estimation method, and including a quadratic and a cubic term for time, allowing for accelerated health change curves. Models incrementally adjusted for demographic indicators, lifestyle factors, and depressive symptoms.
Abbreviations
HAT: Health Assessment Tool; SES: socioeconomic status.
Author Contributions
LHA led the conceptualization, analysis, and writing of the study. SD, ACL, and LF contributed to the study conceptualization and design. SD, ACL and ADM contributed to the analytic strategy and interpretation of results. XH contributed to the operationalization of measures and statistical analysis. SD contributed to the drafting of the manuscript. All authors reviewed and revised the text and results and approved the final version of the manuscript.
Acknowledgements
We thank the participants and staff involved in the data collection and management of the Swedish National study on Aging and Care, Kungsholmen (SNAC-K).
Conflicts of Interest
The authors declare that they have no conflicts of interest.
Funding
The Swedish National Study on Aging and Care is supported by the Ministry of Health and Social Affairs, Sweden; the participating county councils and municipalities; and the Swedish Research Council. Financial support from the Swedish Research Council and the Swedish Research Council for Health, Working Life and Welfare is acknowledged. Serhiy Dekhtyar acknowledges support from the Swedish Research Council for Health, Working Life and Welfare (FORTE; grant no. 2019-01076).
References
- 1. Huisman M, Read S, Towriss CA, Deeg DJ, Grundy E. Socioeconomic inequalities in mortality rates in old age in the world health organization Europe region. Epidemiol Rev. 2013; 35:84–97. https://doi.org/10.1093/epirev/mxs010 [PubMed]
- 2. Huisman M, Kunst AE, Mackenbach JP. Socioeconomic inequalities in morbidity among the elderly; a European overview. Soc Sci Med. 2003; 57:861–73. https://doi.org/10.1016/s0277-9536(02)00454-9 [PubMed]
- 3. Phelan JC, Link BG, Tehranifar P. Social conditions as fundamental causes of health inequalities: theory, evidence, and policy implications. J Health Soc Behav. 2010; 51:S28–40. https://doi.org/10.1177/0022146510383498 [PubMed]
- 4. Acciai F. The age pattern of social inequalities in health at older ages: are common measures of socio-economic status interchangeable? Public Health. 2018; 157:135–41. https://doi.org/10.1016/j.puhe.2018.01.002 [PubMed]
- 5. Galobardes B, Lynch J, Smith GD. Measuring socioeconomic position in health research. Br Med Bull. 2007; 81:21–37. https://doi.org/10.1093/bmb/ldm001 [PubMed]
- 6. Turrell G, Lynch JW, Leite C, Raghunathan T, Kaplan GA. Socioeconomic disadvantage in childhood and across the life course and all-cause mortality and physical function in adulthood: evidence from the alameda county study. J Epidemiol Community Health. 2007; 61:723–30. https://doi.org/10.1136/jech.2006.050609 [PubMed]
- 7. Corna LM. A life course perspective on socioeconomic inequalities in health: a critical review of conceptual frameworks. Adv Life Course Res. 2013; 18:150–59. https://doi.org/10.1016/j.alcr.2013.01.002 [PubMed]
- 8. Landös A, von Arx M, Cheval B, Sieber S, Kliegel M, Gabriel R, Orsholits D, van der Linden BW, Blane D, Boisgontier MP, Courvoisier DS, Guessous I, Burton-Jeangros C, Cullati S. Childhood socioeconomic circumstances and disability trajectories in older men and women: a European cohort study. Eur J Public Health. 2019; 29:50–58. https://doi.org/10.1093/eurpub/cky166 [PubMed]
- 9. Sheikh MA, Abelsen B, Olsen JA. Role of respondents’ education as a mediator and moderator in the association between childhood socio-economic status and later health and wellbeing. BMC Public Health. 2014; 14:1172. https://doi.org/10.1186/1471-2458-14-1172 [PubMed]
- 10. Marden JR, Tchetgen Tchetgen EJ, Kawachi I, Glymour MM. Contribution of socioeconomic status at 3 life-course periods to late-life memory function and decline: early and late predictors of dementia risk. Am J Epidemiol. 2017; 186:805–14. https://doi.org/10.1093/aje/kwx155 [PubMed]
- 11. Laaksonen M, Rahkonen O, Martikainen P, Lahelma E. Socioeconomic position and self-rated health: the contribution of childhood socioeconomic circumstances, adult socioeconomic status, and material resources. Am J Public Health. 2005; 95:1403–09. https://doi.org/10.2105/AJPH.2004.047969 [PubMed]
- 12. Torres JM, Rizzo S, Wong R. Lifetime Socioeconomic Status and Late-life Health Trajectories: Longitudinal Results from the Mexican Health and Aging Study. J Gerontol B Psychol Sci Soc Sci. 2018; 73:349–360. https://doi.org/10.1093/geronb/gbw048 [PubMed]
- 13. Hoffmann R, Kröger H, Tarkiainen L, Martikainen P. Dimensions of social stratification and their relation to mortality: a comparison across gender and life course periods in Finland. Soc Indic Res. 2019; 145:349–65. https://doi.org/10.1007/s11205-019-02078-z [PubMed]
- 14. Chatterji S, Byles J, Cutler D, Seeman T, Verdes E. Health, functioning, and disability in older adults—present status and future implications. Lancet. 2015; 385:563–75. https://doi.org/10.1016/S0140-6736(14)61462-8 [PubMed]
- 15. Stringhini S, Zaninotto P, Kumari M, Kivimäki M, Lassale C, Batty GD. Socio-economic trajectories and cardiovascular disease mortality in older people: the english longitudinal study of ageing. Int J Epidemiol. 2018; 47:36–46. https://doi.org/10.1093/ije/dyx106 [PubMed]
- 16. Kahn JR, Pearlin LI. Financial strain over the life course and health among older adults. J Health Soc Behav. 2006; 47:17–31. https://doi.org/10.1177/002214650604700102 [PubMed]
- 17. Darin-Mattsson A, Andel R, Celeste RK, Kåreholt I. Linking financial hardship throughout the life-course with psychological distress in old age: sensitive period, accumulation of risks, and chain of risks hypotheses. Soc Sci Med. 2018; 201:111–19. https://doi.org/10.1016/j.socscimed.2018.02.012 [PubMed]
- 18. Hatch SL. Conceptualizing and identifying cumulative adversity and protective resources: implications for understanding health inequalities. J Gerontol B Psychol Sci Soc Sci. 2005; 60:130–34. https://doi.org/10.1093/geronb/60.special_issue_2.s130 [PubMed]
- 19. Ben-Shlomo Y, Kuh D. A life course approach to chronic disease epidemiology: conceptual models, empirical challenges and interdisciplinary perspectives. Int J Epidemiol. 2002; 31:285–93. [PubMed]
- 20. Xu X, Liang J, Bennett JM, Botoseneanu A, Allore HG. Socioeconomic stratification and multidimensional health trajectories: evidence of convergence in later old age. J Gerontol B Psychol Sci Soc Sci. 2015; 70:661–71. https://doi.org/10.1093/geronb/gbu095 [PubMed]
- 21. Siegrist J, Marmot M. Health inequalities and the psychosocial environment-two scientific challenges. Soc Sci Med. 2004; 58:1463–73. https://doi.org/10.1016/S0277-9536(03)00349-6 [PubMed]
- 22. Tucker-Seeley RD, Li Y, Subramanian SV, Sorensen G. Financial hardship and mortality among older adults using the 1996-2004 health and retirement study. Ann Epidemiol. 2009; 19:850–57. https://doi.org/10.1016/j.annepidem.2009.08.003 [PubMed]
- 23. Tucker-Seeley RD, Thorpe RJ. Material-psychosocial-behavioral aspects of financial hardship: a conceptual model for cancer prevention. Gerontologist. 2019 (Suppl 1); 59:S88–93. https://doi.org/10.1093/geront/gnz033 [PubMed]
- 24. Marshall GL, Tucker-Seeley R. The association between hardship and self-rated health: does the choice of indicator matter? Ann Epidemiol. 2018; 28:462–67. https://doi.org/10.1016/j.annepidem.2018.03.013 [PubMed]
- 25. Lynch JW, Smith GD, Kaplan GA, House JS. Income inequality and mortality: importance to health of individual income, psychosocial environment, or material conditions. BMJ. 2000; 320:1200–04. https://doi.org/10.1136/bmj.320.7243.1200 [PubMed]
- 26. Guralnik JM, Butterworth S, Wadsworth ME, Kuh D. Childhood socioeconomic status predicts physical functioning a half century later. J Gerontol A Biol Sci Med Sci. 2006; 61:694–701. https://doi.org/10.1093/gerona/61.7.694 [PubMed]
- 27. Leão T, Perelman J. Depression symptoms as mediators of inequalities in self-reported health: the case of Southern European elderly. J Public Health (Oxf). 2018; 40:756–763. https://doi.org/10.1093/pubmed/fdx173 [PubMed]
- 28. Miller GE, Chen E, Parker KJ. Psychological stress in childhood and susceptibility to the chronic diseases of aging: moving toward a model of behavioral and biological mechanisms. Psychol Bull. 2011; 137:959–97. https://doi.org/10.1037/a0024768 [PubMed]
- 29. Triolo F, Sjöberg L, Vetrano DL, Darin-Mattsson A, Bertolotti M, Fratiglioni L, Dekhtyar S. Social engagement in late life may attenuate the burden of depressive symptoms due to financial strain in childhood. J Affect Disord. 2020; 263:336–43. https://doi.org/10.1016/j.jad.2019.11.163 [PubMed]
- 30. Kivimäki M, Batty GD, Pentti J, Shipley MJ, Sipilä PN, Nyberg ST, Suominen SB, Oksanen T, Stenholm S, Virtanen M, Marmot MG, Singh-Manoux A, Brunner EJ, et al. Association between socioeconomic status and the development of mental and physical health conditions in adulthood: a multi-cohort study. Lancet Public Health. 2020; 5:e140–49. https://doi.org/10.1016/S2468-2667(19)30248-8 [PubMed]
- 31. Kiely KM, Butterworth P. Mental health selection and income support dynamics: multiple spell discrete-time survival analyses of welfare receipt. J Epidemiol Community Health. 2014; 68:349–55. https://doi.org/10.1136/jech-2013-203179 [PubMed]
- 32. Fratiglioni L, Wang HX, Ericsson K, Maytan M, Winblad B. Influence of social network on occurrence of dementia: a community-based longitudinal study. Lancet. 2000; 355:1315–19. https://doi.org/10.1016/S0140-6736(00)02113-9 [PubMed]
- 33. Pimouguet C, Rizzuto D, Schön P, Shakersain B, Angleman S, Lagergren M, Fratiglioni L, Xu W. Impact of living alone on institutionalization and mortality: a population-based longitudinal study. Eur J Public Health. 2016; 26:182–87. https://doi.org/10.1093/eurpub/ckv052 [PubMed]
- 34. Dekhtyar S, Vetrano DL, Marengoni A, Wang HX, Pan KY, Fratiglioni L, Calderón-Larrañaga A. Association between speed of multimorbidity accumulation in old age and life experiences: a cohort study. Am J Epidemiol. 2019; 188:1627–36. https://doi.org/10.1093/aje/kwz101 [PubMed]
- 35. Calderón-Larrañaga A, Santoni G, Wang HX, Welmer AK, Rizzuto D, Vetrano DL, Marengoni A, Fratiglioni L. Rapidly developing multimorbidity and disability in older adults: does social background matter? J Intern Med. 2018; 283:489–99. https://doi.org/10.1111/joim.12739 [PubMed]
- 36. Goodwin L, Gazard B, Aschan L, MacCrimmon S, Hotopf M, Hatch SL. Taking an intersectional approach to define latent classes of socioeconomic status, ethnicity and migration status for psychiatric epidemiological research. Epidemiol Psychiatr Sci. 2018; 27:589–600. https://doi.org/10.1017/S2045796017000142 [PubMed]
- 37. Meng X, D’Arcy C. Education and dementia in the context of the cognitive reserve hypothesis: a systematic review with meta-analyses and qualitative analyses. PLoS One. 2012; 7:e38268. https://doi.org/10.1371/journal.pone.0038268 [PubMed]
- 38. Lagergren M, Fratiglioni L, Hallberg IR, Berglund J, Elmståhl S, Hagberg B, Holst G, Rennemark M, Sjölund BM, Thorslund M, Wiberg I, Winblad B, Wimo A. A longitudinal study integrating population, care and social services data. The Swedish National study on Aging and Care (SNAC). Aging Clin Exp Res. 2004; 16:158–68. https://doi.org/10.1007/BF03324546 [PubMed]
- 39. Santoni G, Marengoni A, Calderón-Larrañaga A, Angleman S, Rizzuto D, Welmer AK, Mangialasche F, Orsini N, Fratiglioni L. Defining health trajectories in older adults with five clinical indicators. J Gerontol A Biol Sci Med Sci. 2017; 72:1123–29. https://doi.org/10.1093/gerona/glw204 [PubMed]
- 40. Santoni G, Meinow B, Wimo A, Marengoni A, Fratiglioni L, Calderón-Larrañaga A. Using an integrated clinical and functional assessment tool to describe the use of social and medical care in an urban community-dwelling Swedish older population. J Am Med Dir Assoc. 2019; 20:988–94.e2. https://doi.org/10.1016/j.jamda.2018.11.017 [PubMed]
- 41. Calderón-Larrañaga A, Vetrano DL, Onder G, Gimeno-Feliu LA, Coscollar-Santaliestra C, Carfí A, Pisciotta MS, Angleman S, Melis RJ, Santoni G, Mangialasche F, Rizzuto D, Welmer AK, et al. Assessing and measuring chronic multimorbidity in the older population: a proposal for its operationalization. J Gerontol A Biol Sci Med Sci. 2017; 72:1417–23. https://doi.org/10.1093/gerona/glw233 [PubMed]
- 42. Montgomery SA, Asberg M. A new depression scale designed to be sensitive to change. Br J Psychiatry. 1979; 134:382–89. https://doi.org/10.1192/bjp.134.4.382 [PubMed]
- 43. Mottram P, Wilson K, Copeland J. Validation of the hamilton depression rating scale and montgommery and asberg rating scales in terms of AGECAT depression cases. Int J Geriatr Psychiatry. 2000; 15:1113–19. https://doi.org/10.1002/1099-1166(200012)15:12<1113::aid-gps253>3.0.co;2-y [PubMed]
- 44. Hagenaars JA, McCutcheon A. Applied Latent Class Analysis. Cambridge, UK: Cambridge University Press; 2002. https://doi.org/10.1017/CBO9780511499531
- 45. Stata Corporation. Stata Statistical Software, release 15. College Station, TX: StataCorp LLC; 2017.
- 46. Akaike H. Factor analysis and AIC. Psychometrika. 1987; 52:317–332. https://doi.org/10.1007/BF02294359
- 47. Gideon S. Estimating the dimension of a mode. Ann Stat. 1978; 6:461–464. https://doi.org/10.1214/aos/1176344136
- 48. Collins L, Lanza S. Latent Class and Latent Transition Analysis: With Applications in the Social, Behavioral, and Health Sciences. Hoboken, NJ: John Wiley & Sons; 2013.