


Introduction
Alzheimer’s disease (AD) is a progressive neurodegenerative disorder with insidious onset followed by cognitive decline [1]. Prior studies have revealed that individuals with mild cognitive impairment (MCI), which represents a transitional stage between normal aging and a very early phase of AD, will face many problems in multiple cognitive domains, including memory, executive function, attention, language, and visuospatial skills [2, 3]. According to the new diagnostic criteria for AD, neuropsychological tests are recognized as fundamental elements of the core clinical criteria [4].
To enhance the pathophysiological specificity of the diagnosis, neuroimaging biomarkers have been incorporated into diagnostic criteria and have been considered important research criteria in the new clinical criteria for AD, MCI due to AD and the preclinical stage of AD, which can be evaluated by high-resolution structural magnetic resonance imaging (MRI) measures of atrophy and fluoro-2-deoxy-D-glucose positron emission tomography (FDG-PET) measures of cerebral hypometabolism [2, 4, 5]. MRI-based measures of brain atrophy are regarded as valid markers of AD and its progression; brain atrophy occurs years before symptoms appear with a stereotypical pattern of early medial temporal lobe (entorhinal cortex and hippocampus) involvement progressively extending to neocortical damage [6, 7]. Consistent with the gradual decline across multiple cognitive domains, atrophy in the hippocampus is associated with behavioral impairment as evaluated by the Mini-Mental State Examination (MMSE) and Auditory Verbal Learning Test (AVLT) [8, 9]. Typical FDG-PET findings in AD have manifested reduced glucose metabolism in the parieto-temporal association cortex, precuneus, and posterior cingulate cortices, which have extensive overlapping regions within the default mode network (DMN) [10–12]. Given that cognitive function depends on neuronal activity in the brain [13], abnormal glucose metabolism observed in AD has been repeatedly reported to be associated with poor cognitive performance [14–16].
Generally, gray matter volume atrophy refers to neuron loss or a reduction in the number of connections between neurons due to apoptosis and injury [6]. Cerebral hypometabolism represents reductions in the cerebral metabolic rate of glucose consumption (CMRglc) [13] and the distribution of synapse dysfunction in vivo [17]. Considering that different neuroimaging biomarkers (e.g., brain atrophy and cerebral hypometabolism) reflect distinct pathophysiological aspects of AD, evaluating brain atrophy and hypometabolism data concurrently may improve the present understanding of cognitive decline in AD patients. However, most current studies have focused on the association between single brain area changes (e.g., brain atrophy or glucose metabolic reduction) from single-modality studies and cognitive impairment in AD [8, 14, 15]. Since a single feature from brain atrophy or glucose metabolic reduction is considered one potential factor for AD pathology, such studies could not comprehensively and clearly explain cognitive decline in AD. There are also other studies that have combined multiple features from brain atrophy and hypometabolism to understand the neural correlates of cognitive impairment in AD [18, 19]. Due to FDG-PET imaging and structural imaging data being acquired separately, registration error and information loss in the registration process are inevitable. Thus, the combination data regarding atrophy and metabolic changes obtained by simultaneous FDG-PET and MRI imaging could better clarify the reasons for cognitive impairment in AD patients than the abovementioned methods.
The recently developed hybrid PET/MR scanners combined the sensitivity of PET and the resolution of MR into a single machine, which can simultaneously evaluate brain structure and glucose metabolism and show changes in small anatomical structures more clearly than a single modality [20]. Synchronous scanning can also reduce registration errors and information loss in the registration process, thus providing a representation that is closer to the real situation of brain activity than that achieved when evaluating two modalities by scanning separately [21]. Therefore, PET/MR scanners are the ideal tool to investigate the relationship between multiple imaging features and cognitive performance in AD. To date, published studies on hybrid PET/MR of AD have mainly focused on the relationship between different modalities (e.g., metabolic activity, intrinsic network connectivity and brain volume) [22–25] as well as the relationship between functional image features and cognitive performance [22, 25]. In the present study, by using hybrid PET/MRI, we hypothesized that the combination of atrophy and metabolic changes in the hippocampus and the DMN could be used to comprehensively explore the neural mechanisms underlying cognitive impairment in AD.
Results
Demographic characteristics and neuropsychological scores are listed in Table 1. There was no significant difference between AD patients and normal controls in mean age, sex distribution or education level (P > 0.05 for all). There were significant differences between the groups in all cognitive domains. Specifically, compared with the NC group, the AD group had worse performance on the AVLT for both immediate and delayed recall, Digit Span Test (Forwards and Backwards), ADL, BNT, CFT, and TMT (P < 0.01 for all).
Table 1. Demographic and neuropsychological data between the two groups.
| AD | NC | p | |||||||||||||||||||||||||||||||||||||||||||||||||||||||||||||||||||||||||||||||||||||||||||||||||
| N | 23 | 24 | — | ||||||||||||||||||||||||||||||||||||||||||||||||||||||||||||||||||||||||||||||||||||||||||||||||
| Sex (Female/male) | 14/9 | 12/12 | 0.454 | ||||||||||||||||||||||||||||||||||||||||||||||||||||||||||||||||||||||||||||||||||||||||||||||||
| Age (years) | 58.74±4.96 | 54.67±8.69 | 0.055 | ||||||||||||||||||||||||||||||||||||||||||||||||||||||||||||||||||||||||||||||||||||||||||||||||
| Education Level (years) | 11.35±3.50 | 11.67±3.09 | 0.381 | ||||||||||||||||||||||||||||||||||||||||||||||||||||||||||||||||||||||||||||||||||||||||||||||||
| MMSE | 14.52±5.23 | 29.13±1.51 | 0.000 | ||||||||||||||||||||||||||||||||||||||||||||||||||||||||||||||||||||||||||||||||||||||||||||||||
| MoCA | 8.70±4.17 | 27.08±2.84 | 0.000 | ||||||||||||||||||||||||||||||||||||||||||||||||||||||||||||||||||||||||||||||||||||||||||||||||
| AVLT-immediate recall | 7.78±4.22 | 24.42±6.03 | 0.000 | ||||||||||||||||||||||||||||||||||||||||||||||||||||||||||||||||||||||||||||||||||||||||||||||||
| AVLT-delayed recall | 0.22±0.52 | 9.38±2.04 | 0.000 | ||||||||||||||||||||||||||||||||||||||||||||||||||||||||||||||||||||||||||||||||||||||||||||||||
| Digit Span Forwards | 6.91±1.28 | 8±1.14 | 0.007 | ||||||||||||||||||||||||||||||||||||||||||||||||||||||||||||||||||||||||||||||||||||||||||||||||
| Digit Span Backwards | 2.35±1.37 | 5.25±1.22 | 0.000 | ||||||||||||||||||||||||||||||||||||||||||||||||||||||||||||||||||||||||||||||||||||||||||||||||
| ADL | 37.22±11.46 | 20±0 | 0.000 | ||||||||||||||||||||||||||||||||||||||||||||||||||||||||||||||||||||||||||||||||||||||||||||||||
| BNT | 15.18±6.12 | 25.38±3.63 | 0.000 | ||||||||||||||||||||||||||||||||||||||||||||||||||||||||||||||||||||||||||||||||||||||||||||||||
| CDR | 1.48±0.63 | 0.02±0.10 | 0.000 | ||||||||||||||||||||||||||||||||||||||||||||||||||||||||||||||||||||||||||||||||||||||||||||||||
| CFT | 6.23±6.49 | 15.04±1.16 | 0.000 | ||||||||||||||||||||||||||||||||||||||||||||||||||||||||||||||||||||||||||||||||||||||||||||||||
| TMT | 150.18±50.36 | 36.88±44.24 | 0.000 | ||||||||||||||||||||||||||||||||||||||||||||||||||||||||||||||||||||||||||||||||||||||||||||||||
| Note: Group differences in demographic measures were tested using the independent sample t-test and the Chi-square analyses or Fisher exact test for quantitative and qualitative variables. Statistical significance level was set at P < 0.05 (two-tailed). Abbreviations: MMSE, Mini-Mental State Examination; MoCA, Montreal Cognitive Assessment; AVLT, Rey Auditory Verbal Learning Test; ADL, Activities of Daily Living; BNT, Boston Naming Test; CDR, Clinical Dementia Rating; CFT, Rey-Osteirreth Complex Figure Test; TMT, Trail Making Test; AD, Alzheimer’s disease; NC: normal controls. | |||||||||||||||||||||||||||||||||||||||||||||||||||||||||||||||||||||||||||||||||||||||||||||||||||
First, ROI analysis based on coordinates was performed to examine the GM volume and brain glucose metabolism differences between the AD group and the NC group. The results showed that the AD group had significantly reduced GM volume in the hippocampus and brain regions within estimated spatial mask of the DMN, including the PCC, the mPFC and bilateral lateral parietal regions, compared with the NC group (P < 0.001, Figure 1C). The AD group also had significantly decreased metabolism within the DMN mask compared to the NC group (P < 0.001, Figure 1B1-1). The reduction in 18F-FDG PET metabolism within the DMN mask in the AD group was still significant even after controlling for GM atrophy (P < 0.001, Figure 1B2-1). However, no significant difference was found in brain metabolism within the hippocampus between the two groups (Figure 1B1-2, B2-2).
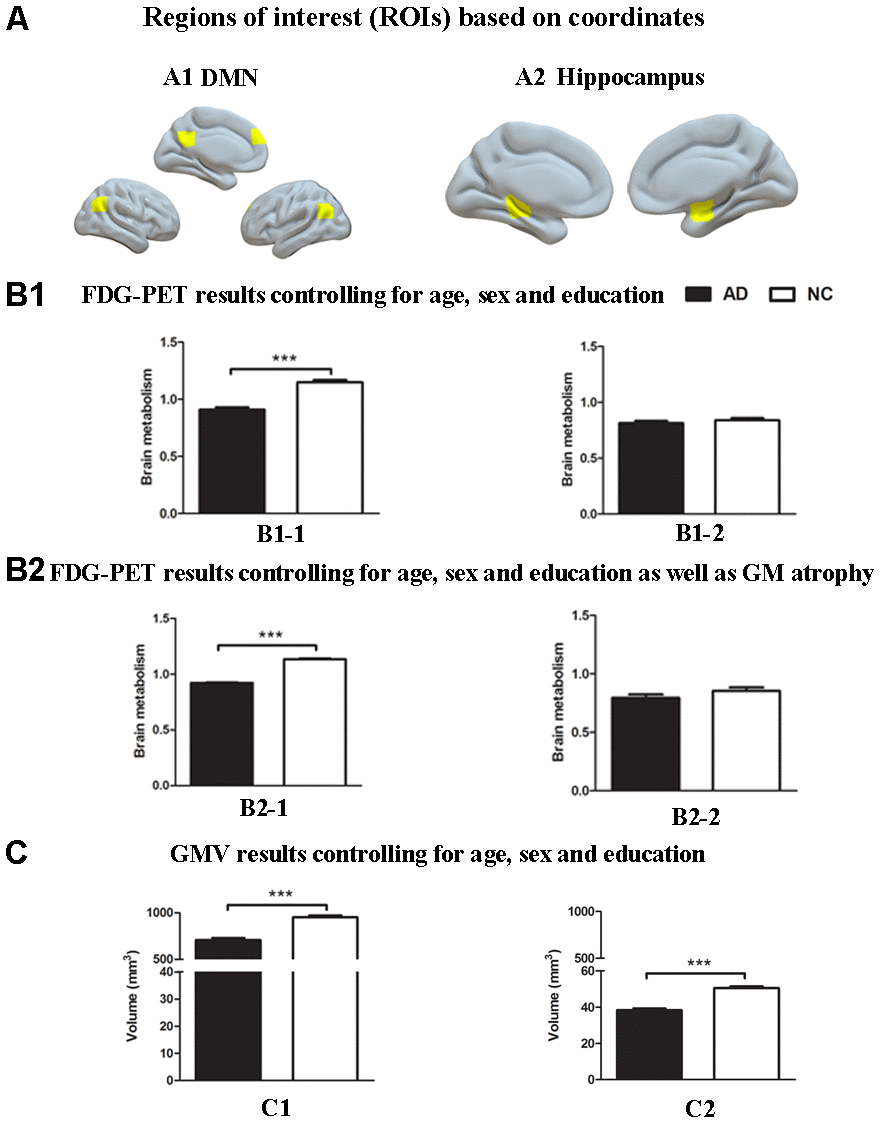
Figure 1. Group differences in18F-FDG SUVR and gray matter volume by using ROI analysis based on coordinates between the AD group and the NC group. (A) ROIs of the DMN (A1) and hippocampus (A2) were defined based on coordinates (shown in warm yellows). (B1) Metabolism results of the DMN (B1-1) and hippocampus (B1-2) controlling for age, sex and education. (B2) Metabolism results of the DMN (B2-1) and hippocampus (B2-2) controlling for age, sex and education as well as gray matter atrophy. (C) Gray matter volume results of the DMN (C1) and hippocampus (C2) controlling for age, sex and education. Bars represent average metabolism or total gray matter volume and error bars indicate standard error. ***P < .001. Abbreviations: FDG-PET, Fluoro-2-deoxy-D-glucose positron emission tomography; DMN, default mode network; GMV, gray matter volume.
Notably, the results based on the atlas were almost consistent with the findings above. Relative to the NC group, significantly reduced GM volume in the hippocampus and regions within spatial mask of the DMN (P < 0.001, Figure 2C) and decreased metabolism within the DMN mask (P < 0.001, Figure 2B1-1), which survived after controlling for GM atrophy (P < 0.001, Figure 2B2-1), were repeatedly found in the AD group. In addition, the AD group showed significantly decreased 18F-FDG PET metabolism within the hippocampus compared to that of the NC group (P < 0.01, Figure 2B1-2, 2B2-2).
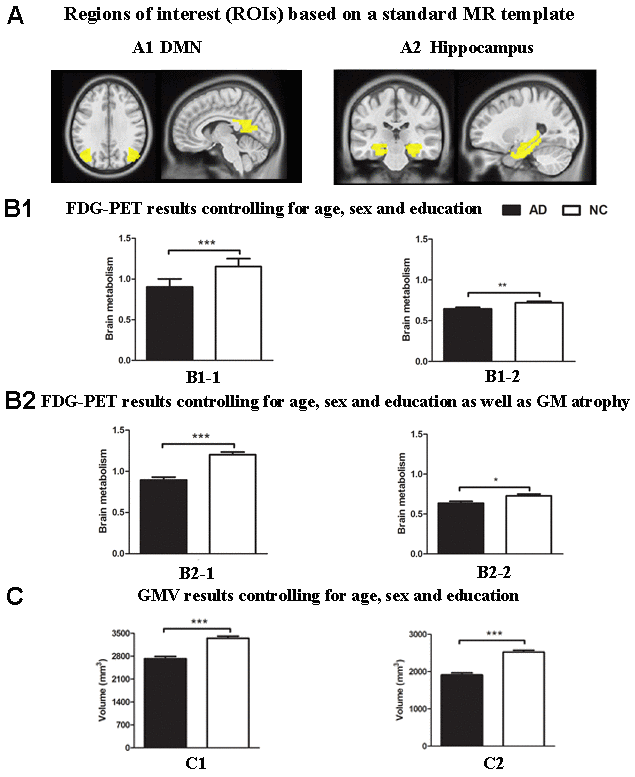
Figure 2. Group differences in18F-FDG SUVR and gray matter volume by using ROI analysis based on template between the AD group and the NC group. (A) ROIs of the DMN (A1) and hippocampus (A2) were defined based on template (shown in warm yellows). (B1) Metabolism results of the DMN (B1-1) and hippocampus (B1-2) controlling for age, sex and education. (B2) Metabolism results of the DMN (B2-1) and hippocampus (B2-2) controlling for age, sex and education as well as gray matter atrophy. (C) Gray matter volume results of the DMN (C1) and hippocampus (C2) controlling for age, sex and education. Bars represent average metabolism or total gray matter volume and error bars indicate standard error. *P < .05, **P < .01, ***P < .001. Abbreviations: FDG-PET, Fluoro-2-deoxy-D-glucose positron emission tomography; DMN, default mode network; GMV, gray matter volume.
Moreover, the findings described above were further confirmed by whole-brain confirmatory analysis. Relative to the NC group, the results of the AD group were also replicated and showed significantly reduced GM volume in bilateral hippocampus, right amygdala, the PCC and the bilateral angular gyrus (P < 0.001, FWE-corrected, Figure 3 and Table 2), as well as significantly reduced metabolism in multiple regions including the PCC and bilateral angular gyrus within the DMN (Figure 4 and Table 2), which was still significant after regressing out the whole-brain GM volume (Figure 5 and Table 2).
Table 2. Group difference in brain metabolism and grey matter volume by using whole-brain confirmatory analysis (FWE corrected for multiple comparisons across the entire volume).
| ROI | Brain regions | Cluster size | T value | Peak MNI coordinates | |||||||||||||||||||||||||||||||||||||||||||||||||||||||||||||||||||||||||||||||||||||||||||||||
| X | Y | Z | |||||||||||||||||||||||||||||||||||||||||||||||||||||||||||||||||||||||||||||||||||||||||||||||||
| FDG-PET | |||||||||||||||||||||||||||||||||||||||||||||||||||||||||||||||||||||||||||||||||||||||||||||||||||
| AD < NC | |||||||||||||||||||||||||||||||||||||||||||||||||||||||||||||||||||||||||||||||||||||||||||||||||||
| DMN | |||||||||||||||||||||||||||||||||||||||||||||||||||||||||||||||||||||||||||||||||||||||||||||||||||
| L Angular | 1596 | 13.12 | -42 | -62 | 50 | ||||||||||||||||||||||||||||||||||||||||||||||||||||||||||||||||||||||||||||||||||||||||||||||
| R Angular | 1339 | 12.07 | 52 | -62 | 46 | ||||||||||||||||||||||||||||||||||||||||||||||||||||||||||||||||||||||||||||||||||||||||||||||
| PCC | 2034 | 7.72 | 0 | -54 | 36 | ||||||||||||||||||||||||||||||||||||||||||||||||||||||||||||||||||||||||||||||||||||||||||||||
| DMN (GMV-controlled) | |||||||||||||||||||||||||||||||||||||||||||||||||||||||||||||||||||||||||||||||||||||||||||||||||||
| L Angular | 95 | 8.72 | -42 | -62 | 50 | ||||||||||||||||||||||||||||||||||||||||||||||||||||||||||||||||||||||||||||||||||||||||||||||
| R Angular | 57 | 7.79 | 50 | -60 | 42 | ||||||||||||||||||||||||||||||||||||||||||||||||||||||||||||||||||||||||||||||||||||||||||||||
| PCC | 168 | 7.73 | 0 | -52 | 36 | ||||||||||||||||||||||||||||||||||||||||||||||||||||||||||||||||||||||||||||||||||||||||||||||
| VBM | |||||||||||||||||||||||||||||||||||||||||||||||||||||||||||||||||||||||||||||||||||||||||||||||||||
| AD < NC | |||||||||||||||||||||||||||||||||||||||||||||||||||||||||||||||||||||||||||||||||||||||||||||||||||
| R PHG | 471 | 10.93 | 11 | -36 | -2 | ||||||||||||||||||||||||||||||||||||||||||||||||||||||||||||||||||||||||||||||||||||||||||||||
| R Amygdala | 210 | 10.01 | 21 | 0 | -14 | ||||||||||||||||||||||||||||||||||||||||||||||||||||||||||||||||||||||||||||||||||||||||||||||
| L PHG | 373 | 9.17 | -15 | 0 | -17 | ||||||||||||||||||||||||||||||||||||||||||||||||||||||||||||||||||||||||||||||||||||||||||||||
| R MTG | 264 | 9.15 | 57 | -55 | 19 | ||||||||||||||||||||||||||||||||||||||||||||||||||||||||||||||||||||||||||||||||||||||||||||||
| L MTG | 189 | 9.07 | -54 | -18 | -11 | ||||||||||||||||||||||||||||||||||||||||||||||||||||||||||||||||||||||||||||||||||||||||||||||
| PCC | 154 | 8.17 | 9 | -35 | 42 | ||||||||||||||||||||||||||||||||||||||||||||||||||||||||||||||||||||||||||||||||||||||||||||||
| L Angular | 136 | 9.01 | -35 | -64 | 45 | ||||||||||||||||||||||||||||||||||||||||||||||||||||||||||||||||||||||||||||||||||||||||||||||
| R Angular | 67 | 7.92 | 33 | -66 | 45 | ||||||||||||||||||||||||||||||||||||||||||||||||||||||||||||||||||||||||||||||||||||||||||||||
| Voxel level P < 0.001 after FWE correction. Abbreviations: PCC, posterior cingulate cortex; PHG, parahippocampal gyrus; MTG, middle temporal gyrus; FDG-PET, Fluoro-2-deoxy-D-glucose positron emission tomography; DMN, default mode network; GMV, gray matter volume; VBM, voxel-based morphometry; AD, Alzheimer’s disease; NC: normal controls. | |||||||||||||||||||||||||||||||||||||||||||||||||||||||||||||||||||||||||||||||||||||||||||||||||||
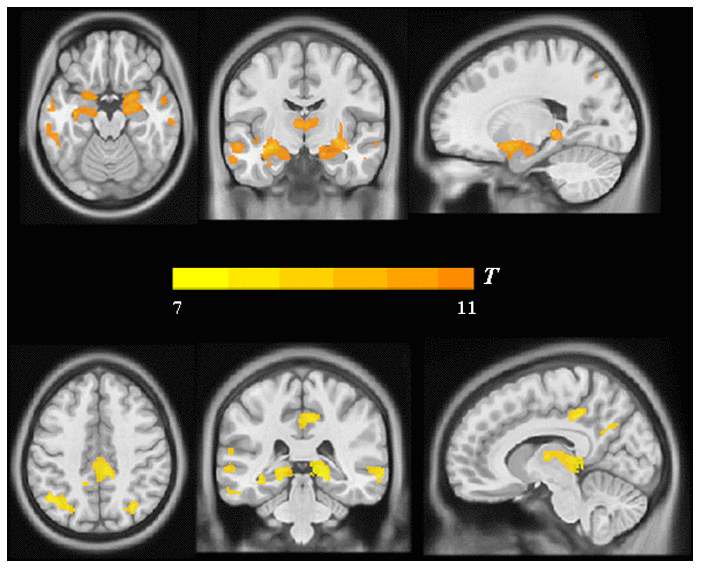
Figure 3. Group differences in VBM analysis between the AD group and the NC group. Significant reduced gray matter volume in AD patients was shown in warm yellows.
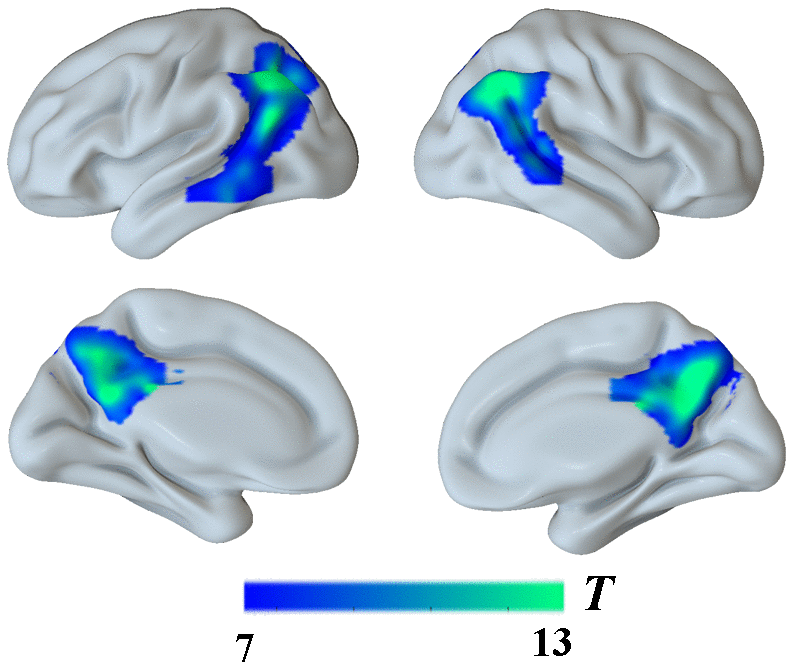
Figure 4. Group differences in18F-FDG SUVR by using whole-brain confirmatory analysis between the AD group and the NC group. Significant reduced metabolism in AD patients was shown in cold blues.
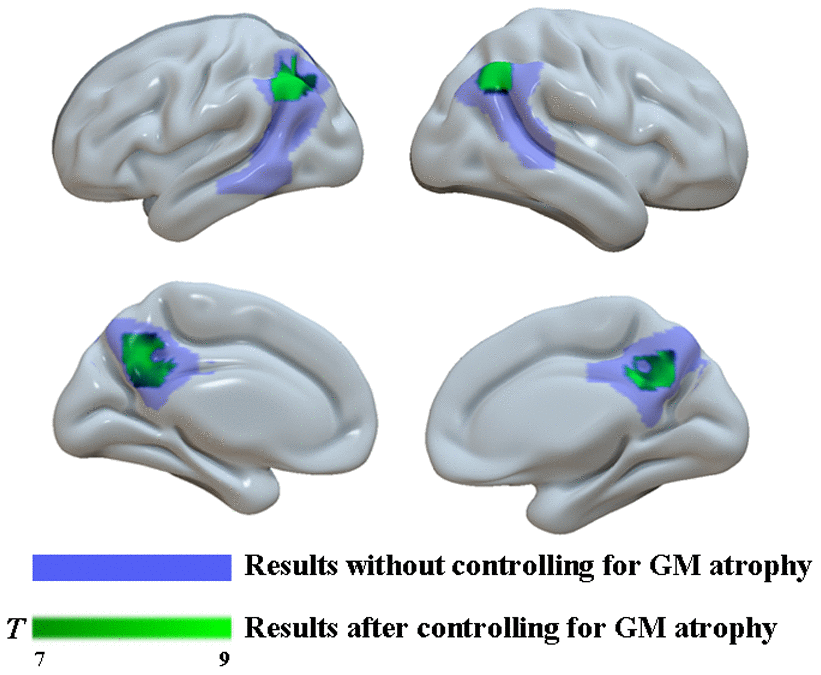
Figure 5. Group differences in18F-FDG SUVR by using whole-brain confirmatory analysis with controlling for GM atrophy between the two groups. Results without controlling for GM atrophy were shown in blue and results after controlling for GM atrophy were shown in green.
Finally, multiple linear regression was used to explore the relationship between multiple imaging features and cognitive performance in the two groups. Metabolism within the hippocampus was not included in the regression model because no significant difference was found in hippocampal metabolism between the two groups. Thus, brain metabolism within the DMN mask, the GM volume of the hippocampus and the GM volume of regions within the DMN mask were chosen as independent variables, and various cognitive test results were considered dependent variables. Control variables were age, sex, and global GM volume. All three variables significantly explained the variance in MMSE scores (F3, 18 = 6.60, p = 0.003) with r2 = 0.52, AVLT scores (F3, 18 = 5.23, p = 0.009) with r2 = 0.47, ADL scores (F3, 18 = 4.98, p = 0.011) with r2 = 0.45 and TMT scores (F3, 18 = 4.43, p = 0.018) with r2 = 0.44. Among the individual explanatory variables, GM volume of regions within the DMN mask was significantly associated with MMSE scores (standardized β = 0.82, p = 0.001), AVLT scores (standardized β = 0.71, p = 0.005), ADL scores (standardized β = 0.68, p = 0.007) and TMT scores (standardized β = 0.80, p = 0.003). GM volume of the hippocampus was significantly associated with AVLT scores (standardized β = 0.31, p = 0.045) and ADL scores (standardized β = -0.33, p = 0.037) (Table 3). Moreover, no significant association was found between multiple imaging features and cognitive performance in the NC group.
Table 3. The result of multiple linear regression analyses.
| Dependent variable | R | R2 | Significant | Predictor | std.β | P | |||||||||||||||||||||||||||||||||||||||||||||||||||||||||||||||||||||||||||||||||||||||||||||
| MMSE | 0.724 | 0.524 | 0.003 | FDG_DMN | -0.299 | 0.085 | |||||||||||||||||||||||||||||||||||||||||||||||||||||||||||||||||||||||||||||||||||||||||||||
| Volume_DMN | 0.819 | < 0.001 | |||||||||||||||||||||||||||||||||||||||||||||||||||||||||||||||||||||||||||||||||||||||||||||||||
| Volume_Hip | 0.213 | 0.105 | |||||||||||||||||||||||||||||||||||||||||||||||||||||||||||||||||||||||||||||||||||||||||||||||||
| MoCA | 0.578 | 0.335 | 0.057 | FDG_DMN | -0.372 | 0.075 | |||||||||||||||||||||||||||||||||||||||||||||||||||||||||||||||||||||||||||||||||||||||||||||
| Volume_DMN | 0.720 | 0.005 | |||||||||||||||||||||||||||||||||||||||||||||||||||||||||||||||||||||||||||||||||||||||||||||||||
| Volume_Hip | 0.083 | 0.337 | |||||||||||||||||||||||||||||||||||||||||||||||||||||||||||||||||||||||||||||||||||||||||||||||||
| AVLT | 0.682 | 0.466 | 0.009 | FDG_DMN | -0.258 | 0.130 | |||||||||||||||||||||||||||||||||||||||||||||||||||||||||||||||||||||||||||||||||||||||||||||
| Volume_DMN | 0.707 | 0.003 | |||||||||||||||||||||||||||||||||||||||||||||||||||||||||||||||||||||||||||||||||||||||||||||||||
| Volume_Hip | 0.311 | 0.045 | |||||||||||||||||||||||||||||||||||||||||||||||||||||||||||||||||||||||||||||||||||||||||||||||||
| ADL | 0.673 | 0.454 | 0.011 | FDG_DMN | 0.240 | 0.149 | |||||||||||||||||||||||||||||||||||||||||||||||||||||||||||||||||||||||||||||||||||||||||||||
| Volume_DMN | -0.676 | 0.004 | |||||||||||||||||||||||||||||||||||||||||||||||||||||||||||||||||||||||||||||||||||||||||||||||||
| Volume_Hip | -0.332 | 0.037 | |||||||||||||||||||||||||||||||||||||||||||||||||||||||||||||||||||||||||||||||||||||||||||||||||
| TMT | 0.662 | 0.439 | 0.018 | FDG_DMN | -0.264 | 0.134 | |||||||||||||||||||||||||||||||||||||||||||||||||||||||||||||||||||||||||||||||||||||||||||||
| Volume_DMN | 0.795 | 0.002 | |||||||||||||||||||||||||||||||||||||||||||||||||||||||||||||||||||||||||||||||||||||||||||||||||
| Volume_Hip | -0.082 | 0.330 | |||||||||||||||||||||||||||||||||||||||||||||||||||||||||||||||||||||||||||||||||||||||||||||||||
| Abbreviations: MMSE, Mini-Mental State Examination; MoCA, Montreal Cognitive Assessment; AVLT, Rey Auditory Verbal Learning Test; ADL, Activities of Daily Living; TMT, Trail Making Test; FDG_DMN, brain metabolism within the DMN; Volume_DMN, volume of the DMN; Volume_Hip, volume of hippocampus; FDG, Fluoro-2-deoxy-D-glucose; DMN, default mode network; Hip, hippocampus. | |||||||||||||||||||||||||||||||||||||||||||||||||||||||||||||||||||||||||||||||||||||||||||||||||||
In addition, contrary to the multiple linear regression findings, partial Pearson’s correlation analysis was also performed to test the association between a single parameter (e.g., brain atrophy or glucose metabolic reduction) and cognitive performance in the AD group. No correlation was found between brain metabolism within the DMN mask and cognitive variables or between GM volume of the hippocampus, GM volume of the regions within the DMN mask and cognitive variables after p-value correction for multiple comparisons (corrected P > 0.05 for all, Supplementary Table 1).
Discussion
The present study comprehensively explored the neural mechanisms underlying cognitive impairment in AD. Hypometabolic DMN and GM atrophy of the hippocampus and DMN regions was repeatedly detected in the AD group. Significant relationships between the above variables and multiple cognitive tests were also observed in AD patients. These findings may deepen our understanding of neural correlates of cognitive impairment in AD.
In line with the previous literature [11, 12, 26], significant GM atrophy and a reduction in metabolism within the DMN were detected in AD patients even when we set a strict threshold for whole-brain analysis (P < 0.001, FWE-corrected). GM volume had significant correlation with the glucose metabolism and both measures could accurately differentiate the AD group from the HC group (Supplementary Figure 1 and Supplementary Table 2). In general, during early clinical stages of AD, patterns of brain atrophy and glucose hypometabolism converge across wide regions of the DMN, supporting the central role of the DMN in AD [27]. It is worth noting that inconsistent results of hippocampal glucose metabolism were found by applying three different analytical methods in this study, and the AD group had slight hippocampal hypometabolism detected only by using atlas-based analysis. According to prior studies, both reduced hippocampal metabolism and preserved hippocampal metabolism have been reported in AD patients [24, 28, 29]. One possible explanation is that there are discrepancies depending on the age of disease onset. In presenile-onset AD, the reduction in glucose metabolism is often centered in the parietotemporal association cortex, which is consistent with our study sample, whereas in senile-onset AD, glucose metabolism tends to be reduced in the limbic system and in the frontal lobe, which would be in line with studies reporting reduced hippocampal metabolism [30, 31]. The other possible explanation is the heterogeneity of hippocampal subregion metabolism in AD patients, which showed lower glucose metabolism in specified subregions [22]. Due to selection bias, our selected coordinates may be located in subregions that had preserved hippocampal metabolism. For this reason, coordinate-based analysis did not detect reduced hippocampal metabolism in AD patients, whereas the AD group exhibited slight hippocampal hypometabolism based on atlas-based analysis. Considering presenile-onset AD in the current study and a strict threshold for whole-brain analysis, reduced hippocampal metabolism was not found in AD patients by using whole-brain confirmatory analysis.
Global cognitive function in AD patients can be well explained by the model including all three parameters (52.4% variance of MMSE). The volume of the DMN significantly contributes to regression, and glucose metabolism in the DMN shows a trend toward significance. The DMN has been found to be involved in various domains of cognitive processing, including episodic memory, visuospatial imagery, attention, self-referential processing, language, etc. [32, 33]. Atrophy is accompanied by damaged synapse and metabolite changes [6]. Due to neuron losses and disrupted brain activity in the DMN regions, atrophy may cause dysfunction of the DMN, which is considered a hallmark of AD [34]. In addition, the multimodel also explained 33.5% of the variance in the MoCA results in AD patients, which is a lower amount of explainable variance than that for the MMSE results. This may be attributed to the floor effect [35]. Several studies have confirmed that the MoCA is a more suitable screening tool for patients with MCI whose disease is prodromal AD [36, 37].
As a global cognitive screening measure, performance on the ADL scale was significantly explained by three variables. Both the volume of the DMN and hippocampus significantly contribute to regression. For daily living ability, several cognitive domains, including episodic memory, speed of processing and verbal ability, in which the DMN and hippocampus are involved, are critical to maintain the normal level of daily life activities [38, 39]. Previous studies also revealed that global cognitive function evaluated by the MMSE was related to ADL performance [40, 41]. From this point of view, it is understandable that the multimodel can explain 45.4% of the variance in ADL scores in AD patients.
It is common knowledge that the hippocampus is most consistently associated with episodic memory. Based on several recent studies, certain areas of the parietal cortex that are commonly understood to be part of the DMN are involved in episodic memory and, together with the hippocampus, constitute a hippocampal-parietal network supporting memory function [42–45]. In line with this, performance on the AVLT in AD patients was well explained by the multimodel (46.6% variance of AVLT scores), and the volume of both of the DMN and hippocampus significantly contributed to regression.
Additionally, the combination of functional and structural parameters also associated with performance on the TMT and the volume of the DMN significantly contributes to regression. As a high-level cognitive ability, executive cognitive function is considered to involve multiple domains, such as planning, goal management, cognitive flexibility, inhibition, and judgment [46]. In accordance with complex functions, distributed brain regions that include the prefrontal cortex, the parietal cortex, the posterior cingulate gyrus, the insula, and the temporal cortex [47] are critical substrates for executive processes. Therefore, a loss of neurons and the connections between neurons in the DMN, which contains key nodes of executive-related regions, results in a disruption of the integrity of the neural circuitry underlying executive function and poor TMT performance in AD patients.
Some limitations of this study need to be addressed. First, we only focused on the volume of the brain structure. In the next research phase, we need to further investigate the mechanism of cognitive impairment by combining various morphological parameters, such as cortical thickness and surface area. Second, in the present study, we only focused on the changes in FDG-PET in the resting state. However, the cognitive process is a dynamic process, and further research on the dynamic FDG-PET changes in the cognitive task state is needed to comprehensively reveal the mechanism of cognitive impairment. Third, the sample size in the current study is relatively small. However, our neuroimaging results are in line with the previous literature, and a strict threshold for whole-brain analysis is employed to examine differences between AD patients and normal controls. We are reasonably confident about the observed significant results. Future studies should increase the sample size to confirm the relationship between functional image features and cognitive performance. Fourth, multiple tracers, such as tau PET and Aβ PET, are needed to observe the pathological changes in the whole course of the disease to confirm the initial cause of cognitive impairment. Finally, the diagnosis of AD is made on the basis of clinical examinations rather than on a pathological basis.
Conclusions
In summary, hypometabolism in the DMN and brain atrophy of the hippocampus and DMN-related regions were repeatedly detected in AD patients by using different analytical methods. Based on the findings above, data obtained using a combination of functional and structural neuroimaging features can better explain the cognitive decline of AD patients than data obtained using unimodal FDG or volume alone. These findings may have important implications for understanding the neural mechanisms of cognitive decline in AD.
Materials and Methods
Subjects
Twenty-three AD patients (mean age 58.74 ± 4.96 years) and twenty-four normal controls (NCs; mean age 54.67 ± 8.69 years) participated in the study. All AD patients were recruited from the Memory Clinic of the Department of Neurology at XuanWu Hospital, Capital Medical University. Normal controls were recruited from the local community by advertisements. All participants received financial compensation for their participation. The study protocol was approved by the Institutional Review Board of XuanWu Hospital at Capital Medical University, and written informed consent was obtained from all participants or their legal relatives after the study protocol had been fully explained.
All participants underwent a standardized assessment protocol that included medical history, neurological and psychiatric examination, a battery of neuropsychological tests and an 18F-FDG PET/MR examination. All patients were diagnosed with AD according to the Diagnostic and Statistical Manual of Mental Disorders-V (DSM-V) criteria for Alzheimer's dementia [48] and the National Institutes on Aging and Alzheimer’s Association (NIA-AA) [4]. Individuals with no cognitive complaints and normal performance on the standardized neuropsychological tests were included as normal controls. The following exclusion criteria were applied to all participants: 1) presenting with any serious medical, psychiatric, or neurological disorders that could affect cognitive function (e.g., substance abuse, alcoholism, schizophrenia, brain tumors, or cerebrovascular disease); 2) standard contraindications for MR imaging examinations (such as magnetic metal implants or pacemakers); 3) evidence of focal brain lesions on MRI (e.g., stroke lesions or bleeding); 4) the presence of severe behavioral or communication problems that would make a clinical MRI examination incomplete; and 5) the absence of a reliable informant.
Neuropsychological assessments
The neuropsychological test battery consists of widely used neuropsychological assessments measuring cognitive function in the domains of memory, language, and executive function. Global cognitive screening measures included the MMSE [49], the Montreal Cognitive Assessment (MoCA) [50], the Clinical Dementia Rating (CDR) scale [51] and the Activities of Daily Living (ADL) scale [40]. Word list memory was evaluated with Rey’s Auditory-Verbal Learning Test (AVLT) [52]. Working memory was measured with the Digit Span Forwards and Backwards test from the Wechsler Adult Intelligence Scale-III [53]. Executive function was evaluated with the Trail Making Test (TMT) [54]. Language was measured with the Boston Naming Test (BNT) [55]. Visuo-construction abilities were assessed by the Rey-Osterrieth Complex Figure Test (CFT) [56]. One AD patient failed to perform the required cognitive tasks, including the BNT, TMT and CFT, due to a lack of understanding regarding task execution.
PET/MR acquisition protocol
All images were acquired on a hybrid 3.0 T TOF PET/MR (SIGNA PET/MR, GE Healthcare, WI, USA) [57]. PET and MR images were simultaneously acquired in a vendor-supplied 19-channel head and neck union coil. 3D BRAVO T1-weighted sagittal images and FDG-PET volumes were acquired in the same session. Additionally, a FLAIR sequence was acquired to screen for brain lesions and abnormalities.
The data was acquired with protocols in line with the procedure guidelines for PET brain imaging provided by the European Association of Nuclear Medicine (EANM) [58]. Every subject was asked to fast for at least 6 h to reach a serum glucose level lower than 9 mmol/l and received an intravenous injection of 18F-FDG (3.7 MBq/kg) [59]. Participants were positioned in a quiet, warm and dimly lit room at least 30 minutes before FDG administration and during the brain uptake phase. Then, they were placed in a hybrid PET/MR scanner as were made as comfortable as possible, with head restraints to minimize motion artifacts. The imaging parameters are described below.
3D BRAVO: repetition time (TR) = 6.9 ms, echo time (TE) = 2.98 ms, flip angle = 12° C, inversion time (TI) = 450 ms, matrix size = 256 × 256, field of view = 256×256 mm2, slice thickness = 1 mm, 192 sagittal slices with no gap, voxel size = 1×1×1 mm3, and acquisition time = 4 minutes 48 seconds.
PET: Static FDG-PET data were acquired in list mode for 30 minutes and comprised 89 slices covering the whole brain. Matrix size = 192×192, field of view = 350×350 mm2, pixel size = 1.82×1.82×2.78 mm3, including corrections for random coincidences, dead time, scatter and photon attenuation. Attenuation correction was performed based on MR imaging of the brain (Atlas-based coregistration of 2-point Dixon) [59], and the default attenuation correction sequence was automatically prescribed and acquired as follows: LAVA-Flex (GE Healthcare) axial acquisition, TR = 4 ms, TE = 1.7 ms, slice thickness = 5.2 mm with 2.6 mm overlap, 120 slices, pixel size = 1.95 × 2.93 mm, and acquisition time = 18 seconds. The images were reconstructed with a time-of-flight point spread function and the order subset-expectation maximization (TOF-PSF-OSEM) algorithm (32 subsets, 8 iterations and a 3-mm cutoff filter) [21].
Data processing
The preprocessing of PET and MRI data is described in detail as follows. Briefly, PET and T1 images were first checked for visible quality issues, and one patient was excluded due to severe motion artifacts. Then, the static PET images were preprocessed by using statistical parametric mapping (SPM12; http://www.fil.ion.ucl.ac.uk/spm/software/spm12) implemented in MATLAB (MathWorks, Natick, Massachusetts). The structural MRI images were normalized to standard Montreal Neurological Institute (MNI) space using diffeomorphic anatomical registration through exponentiated lie algebra (DARTEL) normalization as implemented in SPM12. After normalization, the transformation parameters determined by T1-weighted image spatial normalization were then applied to the coregistered PET images for PET spatial normalization. The images were then smoothed using an isotropic Gaussian kernel with a full width at half maximum of 8 mm for all directions. Finally, PET scan intensity was normalized using a whole cerebellum reference region to create standardized uptake value ratio (SUVR) images. Since FDG-PET signals arise mainly from gray matter, the partial volume effect from nongray matter may potentially influence the results. Therefore, the group comparison was assessed only for gray matter (GM) voxels selected by applying a threshold to the GM probability maps, and we also applied a strict threshold (P < 0.001, FWE-corrected) to acquire very reliable results.
The T1-weighted 3D BRAVO images were processed using the voxel-based morphometry (VBM) toolbox based on SPM12. Briefly, MR images were segmented into GM, white matter (WM) and cerebrospinal fluid (CSF) partitions. Subsequently, the GM and WM partitions of each subject in native space were high dimensionally registered and normalized to the standard MNI space using diffeomorphic anatomical registration through exponentiated lie algebra (DARTEL) normalization as implemented in SPM12. This improved method can achieve more accurate intersubject coregistration of brain images. After normalization, the images with modulation were smoothed with a Gaussian filter of an 8 mm full-width half-maximum kernel.
Data analysis
ROI-based analysis of structural MRI and PET images was performed in the current study. First, multiple brain regions based on a priori coordinates within the DMN and the hippocampus were employed to investigate group differences. To ensure repeatability and reliability of the results in the current study, the DMN and the hippocampus were considered as a whole to define ROIs. Multiple coordinates in the DMN and the hippocampus were defined from the literature [60, 61]. A diameter of 4 mm was used for hippocampal ROIs, and a diameter of 6 mm was used for ROIs in the DMN. ROIs in the DMN included regions centered in the posterior cingulate cortex (PCC: MNI coordinates: 0, -52, 27), the medial prefrontal cortex (mPFC: MNI coordinates: -1, 54, 27), the left lateral parietal cortex (LLP: MNI coordinates: -46, -66, 30), and the right lateral parietal cortex (RLP: MNI coordinates: 49, -63, 33). Hippocampal ROIs were located in the left and right hippocampus (MNI coordinates: -24, -30, -6/21, -6, -18). Then, to avoid coordinate-based selection bias, atlas-based analysis was performed to validate the results acquired by ROI analysis based on coordinates. The masks of the DMN and hippocampus were generated from neuroanatomic and cytoarchitectonic atlases by using WFU PickAtlas [62].
Two sets of ROI signals were extracted from the SUVR on 18F-FDG SUVR images and smoothed T1 images. Analysis of covariance (ANCOVA) was used to test the differences between the AD group and the NC group in the mean brain metabolism and total gray matter volume within the DMN and hippocampus with age, sex and years of education as covariates. To examine the effect of gray matter atrophy on brain glucose metabolism, we also performed an extra ANCOVA test on FDG-PET images with age, sex, years of education and global gray matter volume as covariates. A value of P < 0.05 was considered statistically significant.
Moreover, to avoid missing any other brain atrophy and hypometabolism data in the AD group, the processed FDG-PET and structural images were further used to perform whole-brain confirmatory analysis between the AD group and the NC group using a two-tailed two-sample t-test with the aforementioned variables as covariates. A voxel level threshold was set at P < 0.001 (FWE-corrected).
Statistical analysis
SPSS (version 21.0, IBM) was utilized for statistical analyses. Group differences in demographic measures were tested using the independent sample t-test and the chi-square analyses or Fisher’s exact tests were used for quantitative and qualitative variables. To compare cognitive variables, analysis of covariance (ANCOVA) was conducted with age, sex, and years of education as covariates. A P-value < 0.05 was considered statistically significant. In the final step of analysis, we tested whether functional and structural impairments within the DMN and hippocampus were associated with cognitive deficits in the AD group. Partial Pearson’s correlations between gray matter volume within ROIs, FDG SUVR within ROIs, and clinical assessments were first calculated in the AD group. Then, we performed multiple linear regression analysis using SPSS, with MMSE, MoCA, AVLT, ADL, BNT, CFT and TMT results as dependent variables, and the independent variables were 18F-FDG PET metabolism within the DMN, volume of the DMN regions and volume of the hippocampus. Additional control variables of no interest were age, sex, years of education and global gray matter volume.
Author Contributions
ZGL, PPL, LYW, YSS were responsible for the study concept and design. CLC, YFC, DLJ contributed to the acquisition of MRI data. JKW, LYW, ZGL and PPL assisted with data analysis and interpretation of data. YFC, JKW, PPL and ZGL drafted the manuscript. All authors provided critical revision of the manuscript for important intellectual content. All authors critically reviewed content and approved final version for publication.
Acknowledgments
All listed authors agree with the submission and the final manuscript has been approved by all authors. The authors wish to acknowledge Jie Ma and Hongwei Yang for dedicating their time and energy to helping us collect the data.
Conflicts of Interest
The authors declare no conflicts of financial interest.
Funding
This work was supported by capital clinical characteristic application research and achievement promotion project of Beijing Ministry Science and Technology Commission (grant number Z161100000516085), National Key Research and Development Project of China (2020YFC2007300, 2020YFC2007302), Beijing Municipal Science and Technology Project of Brain cognition and brain medicine (No. Z171100000117001), Beijing Nova Program (grant number 2016000021223TD07), Capacity Building for Sci-Tech Innovation - Fundamental Scientific Research Funds (grant number 19530050157, 19530050184), the Beijing Brain Initiative of Beijing Municipal Science and Technology Commission, and Academy for Multidisciplinary Studies, Capital Normal University. The funders had no role in study design, data collection and analysis, decision to publish, or preparation of the manuscript.
References
- 1. 2020 Alzheimer’s disease facts and figures. Alzheimers Dement. 2020. [Epub ahead of print]. https://doi.org/10.1002/alz.12068 [PubMed]
- 2. Albert MS, DeKosky ST, Dickson D, Dubois B, Feldman HH, Fox NC, Gamst A, Holtzman DM, Jagust WJ, Petersen RC, Snyder PJ, Carrillo MC, Thies B, Phelps CH. The diagnosis of mild cognitive impairment due to Alzheimer’s disease: recommendations from the national institute on aging-Alzheimer’s association workgroups on diagnostic guidelines for Alzheimer’s disease. Alzheimers Dement. 2011; 7:270–79. https://doi.org/10.1016/j.jalz.2011.03.008 [PubMed]
- 3. Simon SS, Yokomizo JE, Bottino CM. Cognitive intervention in amnestic mild cognitive impairment: a systematic review. Neurosci Biobehav Rev. 2012; 36:1163–78. https://doi.org/10.1016/j.neubiorev.2012.01.007 [PubMed]
- 4. McKhann GM, Knopman DS, Chertkow H, Hyman BT, Jack CR
Jr , Kawas CH, Klunk WE, Koroshetz WJ, Manly JJ, Mayeux R, Mohs RC, Morris JC, Rossor MN, et al. The diagnosis of dementia due to Alzheimer's disease: recommendations from the National Institute on Aging-Alzheimer's Association workgroups on diagnostic guidelines for Alzheimer's disease. Alzheimers Dement. 2011; 7:263–69. https://doi.org/10.1016/j.jalz.2011.03.005 [PubMed] - 5. Sperling RA, Aisen PS, Beckett LA, Bennett DA, Craft S, Fagan AM, Iwatsubo T, Jack CR
Jr , Kaye J, Montine TJ, Park DC, Reiman EM, Rowe CC, et al. Toward defining the preclinical stages of Alzheimer’s disease: recommendations from the national institute on aging-Alzheimer’s association workgroups on diagnostic guidelines for Alzheimer’s disease. Alzheimers Dement. 2011; 7:280–92. https://doi.org/10.1016/j.jalz.2011.03.003 [PubMed] - 6. Frisoni GB, Fox NC, Jack CR
Jr , Scheltens P, Thompson PM. The clinical use of structural MRI in Alzheimer disease. Nat Rev Neurol. 2010; 6:67–77. https://doi.org/10.1038/nrneurol.2009.215 [PubMed] - 7. Delacourte A, David JP, Sergeant N, Buée L, Wattez A, Vermersch P, Ghozali F, Fallet-Bianco C, Pasquier F, Lebert F, Petit H, Di Menza C. The biochemical pathway of neurofibrillary degeneration in aging and Alzheimer’s disease. Neurology. 1999; 52:1158–65. https://doi.org/10.1212/wnl.52.6.1158 [PubMed]
- 8. Zanchi D, Giannakopoulos P, Borgwardt S, Rodriguez C, Haller S. Hippocampal and amygdala gray matter loss in elderly controls with subtle cognitive decline. Front Aging Neurosci. 2017; 9:50. https://doi.org/10.3389/fnagi.2017.00050 [PubMed]
- 9. Xu Y, Chen K, Zhao Q, Li F, Guo Q. Short-term delayed recall of auditory verbal learning test provides equivalent value to long-term delayed recall in predicting MCI clinical outcomes: a longitudinal follow-up study. Appl Neuropsychol Adult. 2020; 27:73–81. https://doi.org/10.1080/23279095.2018.1481067 [PubMed]
- 10. Raichle ME. The brain’s default mode network. Annu Rev Neurosci. 2015; 38:433–47. https://doi.org/10.1146/annurev-neuro-071013-014030 [PubMed]
- 11. Herholz K, Salmon E, Perani D, Baron JC, Holthoff V, Frölich L, Schönknecht P, Ito K, Mielke R, Kalbe E, Zündorf G, Delbeuck X, Pelati O, et al. Discrimination between Alzheimer dementia and controls by automated analysis of multicenter FDG PET. Neuroimage. 2002; 17:302–16. https://doi.org/10.1006/nimg.2002.1208 [PubMed]
- 12. Mosconi L. Brain glucose metabolism in the early and specific diagnosis of Alzheimer’s disease. Fdg-PET studies in MCI and AD. Eur J Nucl Med Mol Imaging. 2005; 32:486–510. https://doi.org/10.1007/s00259-005-1762-7 [PubMed]
- 13. Dienel GA. Brain glucose metabolism: integration of energetics with function. Physiol Rev. 2019; 99:949–1045. https://doi.org/10.1152/physrev.00062.2017 [PubMed]
- 14. Staffaroni AM, Melrose RJ, Leskin LP, Riskin-Jones H, Harwood D, Mandelkern M, Sultzer DL. The functional neuroanatomy of verbal memory in Alzheimer’s disease: [18F]-Fluoro-2-deoxy-D-glucose positron emission tomography (FDG-PET) correlates of recency and recognition memory. J Clin Exp Neuropsychol. 2017; 39:682–93. https://doi.org/10.1080/13803395.2016.1255312 [PubMed]
- 15. Henkel R, Brendel M, Paolini M, Brendel E, Beyer L, Gutzeit A, Pogarell O, Rominger A, Blautzik J. FDG PET data is associated with cognitive performance in patients from a memory clinic. J Alzheimers Dis. 2020; 78:207–16. https://doi.org/10.3233/JAD-200826 [PubMed]
- 16. Hsu JL, Hsu WC, Chang CC, Lin KJ, Hsiao IT, Fan YC, Bai CH. Everyday cognition scales are related to cognitive function in the early stage of probable Alzheimer’s disease and FDG-PET findings. Sci Rep. 2017; 7:1719. https://doi.org/10.1038/s41598-017-01193-6 [PubMed]
- 17. Magistretti PJ, Pellerin L. Astrocytes couple synaptic activity to glucose utilization in the brain. News Physiol Sci. 1999; 14:177–82. https://doi.org/10.1152/physiologyonline.1999.14.5.177 [PubMed]
- 18. Bauer CM, Cabral HJ, Killiany RJ. Multimodal Discrimination between Normal Aging, Mild Cognitive Impairment and Alzheimer's Disease and Prediction of Cognitive Decline. Diagnostics (Basel). 2018; 8:14. https://doi.org/10.3390/diagnostics8010014 [PubMed]
- 19. Walhovd KB, Fjell AM, Dale AM, McEvoy LK, Brewer J, Karow DS, Salmon DP, Fennema-Notestine C, and Alzheimer’s Disease Neuroimaging Initiative. Multi-modal imaging predicts memory performance in normal aging and cognitive decline. Neurobiol Aging. 2010; 31:1107–21. https://doi.org/10.1016/j.neurobiolaging.2008.08.013 [PubMed]
- 20. Disselhorst JA, Bezrukov I, Kolb A, Parl C, Pichler BJ. Principles of PET/MR imaging. J Nucl Med. 2014 (Supplement 2); 55:2S–10S. https://doi.org/10.2967/jnumed.113.129098 [PubMed]
- 21. Catana C. Principles of simultaneous PET/MR imaging. Magn Reson Imaging Clin N Am. 2017; 25:231–43. https://doi.org/10.1016/j.mric.2017.01.002 [PubMed]
- 22. Yan S, Zheng C, Cui B, Qi Z, Zhao Z, An Y, Qiao L, Han Y, Zhou Y, Lu J. Multiparametric imaging hippocampal neurodegeneration and functional connectivity with simultaneous PET/MRI in Alzheimer’s disease. Eur J Nucl Med Mol Imaging. 2020; 47:2440–52. https://doi.org/10.1007/s00259-020-04752-8 [PubMed]
- 23. Marchitelli R, Aiello M, Cachia A, Quarantelli M, Cavaliere C, Postiglione A, Tedeschi G, Montella P, Milan G, Salvatore M, Salvatore E, Baron JC, Pappatà S. Simultaneous resting-state FDG-PET/fMRI in Alzheimer disease: relationship between glucose metabolism and intrinsic activity. Neuroimage. 2018; 176:246–58. https://doi.org/10.1016/j.neuroimage.2018.04.048 [PubMed]
- 24. Tahmasian M, Pasquini L, Scherr M, Meng C, Förster S, Mulej Bratec S, Shi K, Yakushev I, Schwaiger M, Grimmer T, Diehl-Schmid J, Riedl V, Sorg C, Drzezga A. The lower hippocampus global connectivity, the higher its local metabolism in Alzheimer disease. Neurology. 2015; 84:1956–63. https://doi.org/10.1212/WNL.0000000000001575 [PubMed]
- 25. Scherr M, Utz L, Tahmasian M, Pasquini L, Grothe MJ, Rauschecker JP, Grimmer T, Drzezga A, Sorg C, Riedl V. Effective connectivity in the default mode network is distinctively disrupted in Alzheimer’s disease-a simultaneous resting-state FDG-PET/fMRI study. Hum Brain Mapp. 2019. [Epub ahead of print]. https://doi.org/10.1002/hbm.24517 [PubMed]
- 26. Ten Kate M, Dicks E, Visser PJ, van der Flier WM, Teunissen CE, Barkhof F, Scheltens P, Tijms BM, and Alzheimer’s Disease Neuroimaging Initiative. Atrophy subtypes in prodromal Alzheimer’s disease are associated with cognitive decline. Brain. 2018; 141:3443–56. https://doi.org/10.1093/brain/awy264 [PubMed]
- 27. Ossenkoppele R, Cohn-Sheehy BI, La Joie R, Vogel JW, Möller C, Lehmann M, van Berckel BN, Seeley WW, Pijnenburg YA, Gorno-Tempini ML, Kramer JH, Barkhof F, Rosen HJ, et al. Atrophy patterns in early clinical stages across distinct phenotypes of Alzheimer’s disease. Hum Brain Mapp. 2015; 36:4421–37. https://doi.org/10.1002/hbm.22927 [PubMed]
- 28. Choi EJ, Son YD, Noh Y, Lee H, Kim YB, Park KH. Glucose hypometabolism in hippocampal subdivisions in Alzheimer’s disease: a pilot study using high-resolution 18F-FDG PET and 7.0-T MRI. J Clin Neurol. 2018; 14:158–64. https://doi.org/10.3988/jcn.2018.14.2.158 [PubMed]
- 29. Apostolova I, Lange C, Mäurer A, Suppa P, Spies L, Grothe MJ, Nierhaus T, Fiebach JB, Steinhagen-Thiessen E, Buchert R, and Alzheimer’s Disease Neuroimaging Initiative. Hypermetabolism in the hippocampal formation of cognitively impaired patients indicates detrimental maladaptation. Neurobiol Aging. 2018; 65:41–50. https://doi.org/10.1016/j.neurobiolaging.2018.01.002 [PubMed]
- 30. Mielke R, Herholz K, Grond M, Kessler J, Heiss WD. Differences of regional cerebral glucose metabolism between presenile and senile dementia of Alzheimer type. Neurobiol Aging. 1992; 13:93–98. https://doi.org/10.1016/0197-4580(92)90015-p [PubMed]
- 31. Sakamoto S, Ishii K, Sasaki M, Hosaka K, Mori T, Matsui M, Hirono N, Mori E. Differences in cerebral metabolic impairment between early and late onset types of Alzheimer’s disease. J Neurol Sci. 2002; 200:27–32. https://doi.org/10.1016/s0022-510x(02)00114-4 [PubMed]
- 32. Cavanna AE, Trimble MR. The precuneus: a review of its functional anatomy and behavioural correlates. Brain. 2006; 129:564–83. https://doi.org/10.1093/brain/awl004 [PubMed]
- 33. Mitchell AS, Czajkowski R, Zhang N, Jeffery K, Nelson AJ. Retrosplenial cortex and its role in spatial cognition. Brain Neurosci Adv. 2018; 2:2398212818757098. https://doi.org/10.1177/2398212818757098 [PubMed]
- 34. Brier MR, Thomas JB, Ances BM. Network dysfunction in Alzheimer’s disease: refining the disconnection hypothesis. Brain Connect. 2014; 4:299–311. https://doi.org/10.1089/brain.2014.0236 [PubMed]
- 35. Federico A, Tinazzi M, Tamburin S. MoCA for cognitive screening in Parkinson’s disease: beware of floor effect. Mov Disord. 2018; 33:499. https://doi.org/10.1002/mds.27329 [PubMed]
- 36. Yu J, Li J, Huang X. The beijing version of the montreal cognitive assessment as a brief screening tool for mild cognitive impairment: a community-based study. BMC Psychiatry. 2012; 12:156. https://doi.org/10.1186/1471-244X-12-156 [PubMed]
- 37. Freitas S, Simões MR, Alves L, Santana I. Montreal cognitive assessment: validation study for mild cognitive impairment and Alzheimer disease. Alzheimer Dis Assoc Disord. 2013; 27:37–43. https://doi.org/10.1097/WAD.0b013e3182420bfe [PubMed]
- 38. Allain P, Etcharry-Bouyx F, Verny C. Executive functions in clinical and preclinical Alzheimer’s disease. Rev Neurol (Paris). 2013; 169:695–708. https://doi.org/10.1016/j.neurol.2013.07.020 [PubMed]
- 39. Desgranges B, Baron JC, Lalevée C, Giffard B, Viader F, de La Sayette V, Eustache F. The neural substrates of episodic memory impairment in Alzheimer’s disease as revealed by FDG-PET: relationship to degree of deterioration. Brain. 2002; 125:1116–24. https://doi.org/10.1093/brain/awf097 [PubMed]
- 40. Reisberg B, Finkel S, Overall J, Schmidt-Gollas N, Kanowski S, Lehfeld H, Hulla F, Sclan SG, Wilms HU, Heininger K, Hindmarch I, Stemmler M, Poon L, et al. The Alzheimer’s disease activities of daily living international scale (ADL-IS). Int Psychogeriatr. 2001; 13:163–81. https://doi.org/10.1017/s1041610201007566 [PubMed]
- 41. Han G, Maruta M, Ikeda Y, Ishikawa T, Tanaka H, Koyama A, Fukuhara R, Boku S, Takebayashi M, Tabira T. Relationship between performance on the mini-mental state examination sub-items and activities of daily living in patients with Alzheimer’s disease. J Clin Med. 2020; 9:1537. https://doi.org/10.3390/jcm9051537 [PubMed]
- 42. Wagner AD, Shannon BJ, Kahn I, Buckner RL. Parietal lobe contributions to episodic memory retrieval. Trends Cogn Sci. 2005; 9:445–53. https://doi.org/10.1016/j.tics.2005.07.001 [PubMed]
- 43. Rutishauser U, Aflalo T, Rosario ER, Pouratian N, Andersen RA. Single-neuron representation of memory strength and recognition confidence in left human posterior parietal cortex. Neuron. 2018; 97:209–20.e3. https://doi.org/10.1016/j.neuron.2017.11.029 [PubMed]
- 44. Jonker TR, Dimsdale-Zucker H, Ritchey M, Clarke A, Ranganath C. Neural reactivation in parietal cortex enhances memory for episodically linked information. Proc Natl Acad Sci USA. 2018; 115:11084–89. https://doi.org/10.1073/pnas.1800006115 [PubMed]
- 45. Vincent JL, Snyder AZ, Fox MD, Shannon BJ, Andrews JR, Raichle ME, Buckner RL. Coherent spontaneous activity identifies a hippocampal-parietal memory network. J Neurophysiol. 2006; 96:3517–31. https://doi.org/10.1152/jn.00048.2006 [PubMed]
- 46. Guarino A, Favieri F, Boncompagni I, Agostini F, Cantone M, Casagrande M. Executive functions in heimer disease: a systematic review. Front Aging Neurosci. 2019; 10:437. https://doi.org/10.3389/fnagi.2018.00437 [PubMed]
- 47. Rabinovici GD, Stephens ML, Possin KL. Executive dysfunction. Continuum (Minneap Minn). 2015; 21:646–59. https://doi.org/10.1212/01.CON.0000466658.05156.54 [PubMed]
- 48. Francesmonneris A, Pincus H, First M. Diagnostic and Statistical Manual of Mental Disorders: DSM-V: American Psychiatric Association. 2013.
- 49. Folstein MF, Folstein SE, McHugh PR. ”Mini-mental state“. A practical method for grading the cognitive state of patients for the clinician. J Psychiatr Res. 1975; 12:189–98. https://doi.org/10.1016/0022-3956(75)90026-6 [PubMed]
- 50. Nasreddine ZS, Phillips NA, Bédirian V, Charbonneau S, Whitehead V, Collin I, Cummings JL, Chertkow H. The montreal cognitive assessment, MoCA: a brief screening tool for mild cognitive impairment. J Am Geriatr Soc. 2005; 53:695–99. https://doi.org/10.1111/j.1532-5415.2005.53221.x [PubMed]
- 51. Morris JC. The clinical dementia rating (CDR): current version and scoring rules. Neurology. 1993; 43:2412–14. https://doi.org/10.1212/wnl.43.11.2412-a [PubMed]
- 52. Bowler D. Rey Auditory Verbal Learning Test. Rey AVLT. Springer New York. 2013.
- 53. Wechsler DA. Wechsler Adult Intelligence Scale. 1997.
- 54. Reitan RM, Wolfson D. The Halstead-Reitan neuropsychological test manual. Clin Gerontol. 1986; 5:39–61. https://doi.org/10.1300/J018v05n01_03
- 55. Fastenau PS, Denburg NL, Mauer BA. Parallel short forms for the boston naming test: psychometric properties and norms for older adults. J Clin Exp Neuropsychol. 1998; 20:828–34. https://doi.org/10.1076/jcen.20.6.828.1105 [PubMed]
- 56. Hamby SL, Wilkins JW, Barry NS. Organizational quality on the Rey-Osterrieth and Taylor Complex Figure Tests: A new scoring system. Psychol Assess. 1993; 5:27–33. https://doi.org/10.1037/1040-3590.5.1.27
- 57. Levin CS, Maramraju SH, Khalighi MM, Deller TW, Delso G, Jansen F. Design features and mutual compatibility studies of the time-of-flight PET capable GE SIGNA PET/MR system. IEEE Trans Med Imaging. 2016; 35:1907–14. https://doi.org/10.1109/TMI.2016.2537811 [PubMed]
- 58. Varrone A, Asenbaum S, Vander Borght T, Booij J, Nobili F, Någren K, Darcourt J, Kapucu OL, Tatsch K, Bartenstein P, Van Laere K, and European Association of Nuclear Medicine Neuroimaging Committee. EANM procedure guidelines for PET brain imaging using [18F]FDG, version 2. Eur J Nucl Med Mol Imaging. 2009; 36:2103–10. https://doi.org/10.1007/s00259-009-1264-0 [PubMed]
- 59. Mainta IC, Vargas MI, Trombella S, Frisoni GB, Unschuld PG, Garibotto V. Hybrid PET-MRI in Alzheimer’s disease research. Methods Mol Biol. 2018; 1750:185–200. https://doi.org/10.1007/978-1-4939-7704-8_12 [PubMed]
- 60. Raichle ME. The restless brain. Brain Connect. 2011; 1:3–12. https://doi.org/10.1089/brain.2011.0019 [PubMed]
- 61. Wang L, Laviolette P, O’Keefe K, Putcha D, Bakkour A, Van Dijk KR, Pihlajamäki M, Dickerson BC, Sperling RA. Intrinsic connectivity between the hippocampus and posteromedial cortex predicts memory performance in cognitively intact older individuals. Neuroimage. 2010; 51:910–17. https://doi.org/10.1016/j.neuroimage.2010.02.046 [PubMed]
- 62. Maldjian JA, Laurienti PJ, Kraft RA, Burdette JH. An automated method for neuroanatomic and cytoarchitectonic atlas-based interrogation of fMRI data sets. Neuroimage. 2003; 19:1233–39. https://doi.org/10.1016/s1053-8119(03)00169-1 [PubMed]