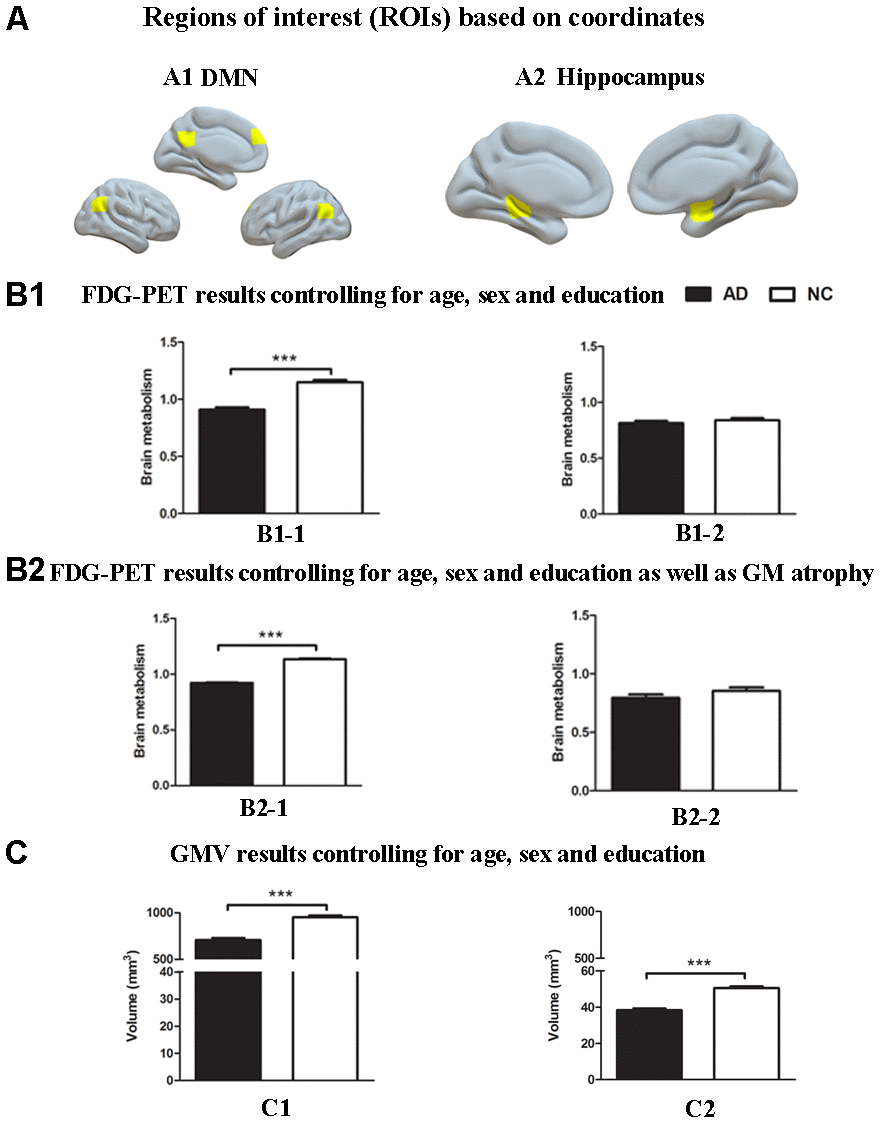
Figure 1.Group differences in18F-FDG SUVR and gray matter volume by using ROI analysis based on coordinates between the AD group and the NC group. (A) ROIs of the DMN (A1) and hippocampus (A2) were defined based on coordinates (shown in warm yellows). (B1) Metabolism results of the DMN (B1-1) and hippocampus (B1-2) controlling for age, sex and education. (B2) Metabolism results of the DMN (B2-1) and hippocampus (B2-2) controlling for age, sex and education as well as gray matter atrophy. (C) Gray matter volume results of the DMN (C1) and hippocampus (C2) controlling for age, sex and education. Bars represent average metabolism or total gray matter volume and error bars indicate standard error. ***P < .001. Abbreviations: FDG-PET, Fluoro-2-deoxy-D-glucose positron emission tomography; DMN, default mode network; GMV, gray matter volume.