


Introduction
Renal cell carcinomas (RCCs), the most common form of kidney cancers, represent a diverse set of tumors originating from the kidney, including cancers arising from the proximal and distal portions of the nephron, the collecting duct and renal medulla. RCC is the sixth most frequent malignancy in males and the eighth in females, causing more than 15,000 deaths per year in the USA [1]. Although all RCCs receive similar therapeutic regimens, the histologic subtypes are highly heterogeneous in their genetic and molecular alterations, clinical course and therapeutic outcomes [2, 3]. Clear cell renal cell carcinoma (ccRCC) is the most common subtype, accounting for 70%-80% of all cases. ccRCC always contains inactivating mutations of the maternal and paternal copies of the VHL (von Hippel-Lindau) gene [4]. Clinically, although most detected tumors are small lesions, one-third of all patients with RCC have metastatic dissemination at the time of diagnosis, and nearly half of all patients die from the disease [5, 6]. Distal metastasis or local recurrence occurs in about 30% of patients after curative surgery of the primary tumor and is associated with a poor prognosis [7]. Systemic therapy targeting the vascular endothelial growth factor (VEGF) and mammalian target of rapamycin (mTOR) offers benefit to metastatic ccRCC. Sorafenib, a commonly used drug, can improve the survival of metastatic ccRCC patients [8]. Unfortunately, ccRCC patients treated with sorafenib eventually become resistant after a median of 6-15 months of treatment [9]. Thus, a better understanding of the mechanisms of resistance to sorafenib is urgently needed.
Nuclear protein 1 (NUPR1), also referred to as p8 or candidate of metastasis (Com-1), is a basic helix-loop-helix chromatin protein [10]. NUPR1 was discovered in pancreatic acinar cells in a study evaluating molecular changes induced by acute pancreatitis in rats [11]. NUPR1 is a stress-induced transcription factor that is abnormally expressed in a wide spectrum of malignancies [12–14]. NUPR1 has recently elicited great attention for its role in several protumorigenic processes, including cell cycle regulation, matrix remodeling, autophagy, apoptosis, senescence and the DNA repair response [15–20]. Notably, NUPR1 is also involved in resistance to antitumor drugs [12, 21, 22]. Therefore, NUPR1 is a promising therapeutic target for developing new cancer therapies. However, the role and prognostic value of NUPR1 in ccRCC remain to be fully elucidated.
The aims of this study were to comprehensively analyze the prognostic value and possible mechanism of NUPR1 in ccRCC. The results suggested that NUPR1 may predict the outcome of ccRCC. NUPR1 dysregulation also promoted ccRCC progression and sorafenib resistance. Mechanistic studies showed that this process was mediated by increasing stemness and the PTEN/AKT/mTOR pathway. NUPR1 merits further investigation as a potential diagnostic marker and therapeutic strategy for ccRCC patients.
Results
NUPR1 expression is upregulated and predicts a poor prognosis in ccRCC patients
To preliminarily investigate the transcription profile of NUPR1 in RCC, we first analyzed the RNA-seq dataset derived from The Cancer Genome Atlas (TCGA) patients with clear cell RCC (KIRC), chromophobe RCC (KICH) and papillary RCC (KIRP). The data showed that NUPR1 mRNA expression was increased significantly in ccRCC tissues, KICH and KIRP, compared to adjacent normal kidney tissues (Figure 1A and Supplementary Figure 1A, 1B).
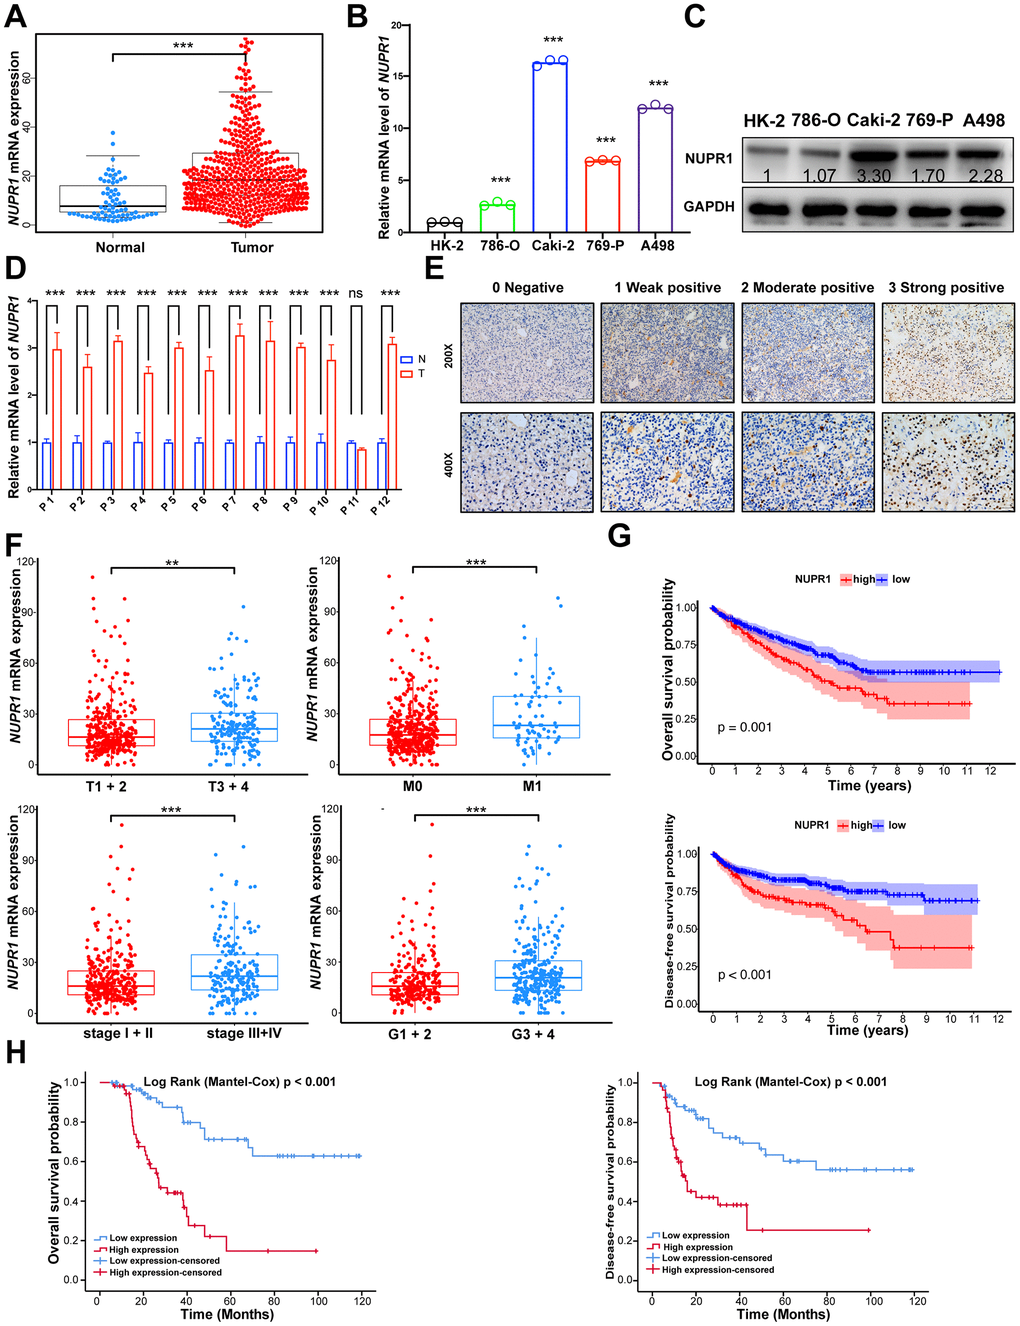
Figure 1. NUPR1 upregulated is predominantly found in ccRCC and associated with poor prognosis. (A) Comparison of NUPR1 mRNA expression between ccRCC and normal kidney tissue from TCGA-KIRC dataset. (B) Relative mRNA level of NUPR1 in ccRCC cell lines compared with human renal proximal tubular epithelial cell line HK-2. (C) Western blot showed NUPR1 protein expression in ccRCC cell lines and HK-2. (D) Relative mRNA level of NUPR1 in twelve ccRCC tissues and paired normal kidney tissues. (E) Immunostaining of NUPR1 expression in 117 ccRCC tissues. Immunostaining intensity was scored as 0 negative, 1 weak positive, 2 moderate positive and 3 strong positive. (F) Overexpression of NUPR1 was associated with higher pathologic T stage, metastasis, elevated clinical stage and histologic grade in TCGA-KIRC dataset. (G) Kaplan-Meier curves of overall survival and disease-free survival time between low (n=135) and high (n=389) NUPR1 mRNA level groups in TCGA-KIRC dataset. The cutoff value was the mean of NUPR1 mRNA level in 524 ccRCC tissues. (H) Kaplan-Meier curves of overall survival and disease-free survival time between low (n=59) and high (n=58) NUPR1 immunostaining intensity groups in cohorts from Shandong Provincial Hospital. The median IHC score was used as the cutoff value. (*p < 0.05, **p < 0.01, ***p < 0.001). (N.S., No statistical significance). ccRCC: clear cell renal cell carcinoma; KIRC: Kidney renal clear cell carcinoma; TCGA: The Cancer Genome Atlas database.
Next, we performed qRT-PCR in ccRCC cell lines and 12 paired human ccRCC tissues. NUPR1 mRNA levels were significantly increased in ccRCC cells and cancer tissues compared with HK-2 cells (human renal cortex/proximal tubular epithelial cells) and adjacent normal kidney tissues (Figure 1B, 1D). Accordingly, western blot assays showed similar results, with NUPR1 protein expression being upregulated in ccRCC cell lines (Figure 1C).
To assess the correlation between the NUPR1 transcription level and clinicopathological characteristics, we assessed the TCGA-KIRC data. As shown in Figure 1F, the group with high NUPR1 mRNA expression was strongly correlated with an elevated pathologic T stage, metastasis, clinical stage and nuclear grade. Subsequently, 117 samples from Shandong Provincial Hospital were analyzed by immunohistochemical staining to further explore the protein expression of NUPR1 (Figure 1E). NUPR1 expression gradually increased along with an increase in pathologic T stage, lymph node involvement, metastasis and stage (Table 1). Collectively, these results indicated that elevated NUPR1 was significantly associated with advanced clinicopathological features in ccRCC.
Table 1. Correlation between NUPR1 immunostaining intensity and clinicopathological features in 117 ccRCC patients.
| Clinicopathological features | NUPR1 expression | p | |||||||||||||||||||||||||||||||||||||||||||||||||||||||||||||||||||||||||||||||||||||||||||||||||
| Low (n= 59) | High (n= 58) | ||||||||||||||||||||||||||||||||||||||||||||||||||||||||||||||||||||||||||||||||||||||||||||||||||
| Gender | Female | 19 | 17 | 0.842 | |||||||||||||||||||||||||||||||||||||||||||||||||||||||||||||||||||||||||||||||||||||||||||||||
| Male | 40 | 41 | |||||||||||||||||||||||||||||||||||||||||||||||||||||||||||||||||||||||||||||||||||||||||||||||||
| Age (years) | ≤ 65 | 27 | 24 | 0.71 | |||||||||||||||||||||||||||||||||||||||||||||||||||||||||||||||||||||||||||||||||||||||||||||||
| >65 | 32 | 34 | |||||||||||||||||||||||||||||||||||||||||||||||||||||||||||||||||||||||||||||||||||||||||||||||||
| Laterality | Left | 36 | 27 | 0.14 | |||||||||||||||||||||||||||||||||||||||||||||||||||||||||||||||||||||||||||||||||||||||||||||||
| Right | 23 | 31 | |||||||||||||||||||||||||||||||||||||||||||||||||||||||||||||||||||||||||||||||||||||||||||||||||
| Pathological T | T1+2 | 38 | 25 | 0.026* | |||||||||||||||||||||||||||||||||||||||||||||||||||||||||||||||||||||||||||||||||||||||||||||||
| T3+4 | 21 | 33 | |||||||||||||||||||||||||||||||||||||||||||||||||||||||||||||||||||||||||||||||||||||||||||||||||
| Pathological N | N0 | 56 | 42 | 0.001** | |||||||||||||||||||||||||||||||||||||||||||||||||||||||||||||||||||||||||||||||||||||||||||||||
| N1 | 3 | 19 | |||||||||||||||||||||||||||||||||||||||||||||||||||||||||||||||||||||||||||||||||||||||||||||||||
| Pathological M | M0 | 59 | 46 | <0.001*** | |||||||||||||||||||||||||||||||||||||||||||||||||||||||||||||||||||||||||||||||||||||||||||||||
| M1 | 0 | 12 | |||||||||||||||||||||||||||||||||||||||||||||||||||||||||||||||||||||||||||||||||||||||||||||||||
| Histologic grade | G1+2 | 39 | 41 | 0.692 | |||||||||||||||||||||||||||||||||||||||||||||||||||||||||||||||||||||||||||||||||||||||||||||||
| G3+4 | 20 | 17 | |||||||||||||||||||||||||||||||||||||||||||||||||||||||||||||||||||||||||||||||||||||||||||||||||
| Stage | I+II | 39 | 25 | 0.016 * | |||||||||||||||||||||||||||||||||||||||||||||||||||||||||||||||||||||||||||||||||||||||||||||||
| III+IV | 20 | 33 | |||||||||||||||||||||||||||||||||||||||||||||||||||||||||||||||||||||||||||||||||||||||||||||||||
| ccRCC: clear cell renal cell carcinoma (*p < 0.05, **p < 0.01, ***p < 0.001). | |||||||||||||||||||||||||||||||||||||||||||||||||||||||||||||||||||||||||||||||||||||||||||||||||||
To explore the prognostic significance of NUPR1, we analyzed the TCGA-KIRC dataset using a Kaplan-Meier analysis with a log-rank test. As shown in Figure 1G, the high NUPR1 mRNA level in primary tumors was correlated with poor overall survival (OS) and disease-free survival (DFS). Similarly, the immunostaining results demonstrated that patients with elevated NUPR1 protein expression experienced shorter OS and DFS (Figure 1H). Univariate and multivariate Cox regression analyses revealed that higher pathologic T stage, metastasis and high immunostaining intensity of NUPR1 were unfavorable prognostic factors in ccRCC patients, (OS, HR = 2.263, 95% CI = 1.061– 4.827, p = 0.035, Table 2; DFS, HR = 2.031, 95% CI = 1.021– 4.040, p = 0.043, Table 3). Thus, we hypothesized that NUPR1 might play important roles in the progression of ccRCC.
Table 2. Uni- and multi-variate Cox regression of NUPR1 protein expression for overall survival in 117 ccRCC.
| Variables | Univariate analysis | Multivariate analysis | |||||||||||||||||||||||||||||||||||||||||||||||||||||||||||||||||||||||||||||||||||||||||||||||||
| HR | 95% CI | p | HR | 95% CI | p | ||||||||||||||||||||||||||||||||||||||||||||||||||||||||||||||||||||||||||||||||||||||||||||||
| NUPR1 expression | 4.862 | 2.526 - 9.357 | <0.001*** | 2.263 | 1.061 - 4.827 | 0.035* | |||||||||||||||||||||||||||||||||||||||||||||||||||||||||||||||||||||||||||||||||||||||||||||
| High Vs. Low | |||||||||||||||||||||||||||||||||||||||||||||||||||||||||||||||||||||||||||||||||||||||||||||||||||
| Gender | 1.502 | 0.762 - 2.958 | 0.240 | ||||||||||||||||||||||||||||||||||||||||||||||||||||||||||||||||||||||||||||||||||||||||||||||||
| Male Vs. Female | |||||||||||||||||||||||||||||||||||||||||||||||||||||||||||||||||||||||||||||||||||||||||||||||||||
| Age (years) | 1.140 | 0.633 - 2.054 | 0.661 | ||||||||||||||||||||||||||||||||||||||||||||||||||||||||||||||||||||||||||||||||||||||||||||||||
| >65 ≤ 65 | |||||||||||||||||||||||||||||||||||||||||||||||||||||||||||||||||||||||||||||||||||||||||||||||||||
| Laterality | 1.160 | 0.650 - 2.069 | 0.616 | ||||||||||||||||||||||||||||||||||||||||||||||||||||||||||||||||||||||||||||||||||||||||||||||||
| Right Vs. Left | |||||||||||||||||||||||||||||||||||||||||||||||||||||||||||||||||||||||||||||||||||||||||||||||||||
| Pathological T | 7.437 | 3.654 - 15.135 | <0.001*** | 6.799 | 1.757 - 26.313 | 0.006** | |||||||||||||||||||||||||||||||||||||||||||||||||||||||||||||||||||||||||||||||||||||||||||||
| T3+4 Vs. T1+2 | |||||||||||||||||||||||||||||||||||||||||||||||||||||||||||||||||||||||||||||||||||||||||||||||||||
| Pathological N | 3.090 | 1.488 - 6.414 | 0.002** | 1.604 | 0.671 - 3.838 | 0.288 | |||||||||||||||||||||||||||||||||||||||||||||||||||||||||||||||||||||||||||||||||||||||||||||
| N0 Vs. N1 | |||||||||||||||||||||||||||||||||||||||||||||||||||||||||||||||||||||||||||||||||||||||||||||||||||
| Pathological M | 8.433 | 4.028 - 17.652 | <0.001*** | 3.838 | 1.561 - 9.441 | 0.003** | |||||||||||||||||||||||||||||||||||||||||||||||||||||||||||||||||||||||||||||||||||||||||||||
| M1 Vs. M0 | |||||||||||||||||||||||||||||||||||||||||||||||||||||||||||||||||||||||||||||||||||||||||||||||||||
| Histologic grade | 1.559 | 0.860 - 2.826 | 0.144 | ||||||||||||||||||||||||||||||||||||||||||||||||||||||||||||||||||||||||||||||||||||||||||||||||
| G3+4 Vs. G1+2 | |||||||||||||||||||||||||||||||||||||||||||||||||||||||||||||||||||||||||||||||||||||||||||||||||||
| Stage | 5.627 | 2.913 - 10.870 | <0.001*** | 0.575 | 0.157 - 4.827 | 0.402 | |||||||||||||||||||||||||||||||||||||||||||||||||||||||||||||||||||||||||||||||||||||||||||||
| III+IV Vs. I+II | |||||||||||||||||||||||||||||||||||||||||||||||||||||||||||||||||||||||||||||||||||||||||||||||||||
| CI: confidence interval; ccRCC: clear cell renal cell carcinoma; HR: hazard ratio. (*p < 0.05, **p < 0.01, ***p < 0.001). | |||||||||||||||||||||||||||||||||||||||||||||||||||||||||||||||||||||||||||||||||||||||||||||||||||
Table 3. Uni- and multi-variate Cox regression of NUPR1 protein expression for disease-free survival in 117 ccRCC.
| Variables | Univariate analysis | Multivariate analysis | |||||||||||||||||||||||||||||||||||||||||||||||||||||||||||||||||||||||||||||||||||||||||||||||||
| HR | 95% CI | p | HR | 95% CI | p | ||||||||||||||||||||||||||||||||||||||||||||||||||||||||||||||||||||||||||||||||||||||||||||||
| NUPR1 expression | 3.264 | 1.772 - 6.012 | <0.001*** | 2.031 | 1.021 - 4.040 | 0.043* | |||||||||||||||||||||||||||||||||||||||||||||||||||||||||||||||||||||||||||||||||||||||||||||
| High Vs. Low | |||||||||||||||||||||||||||||||||||||||||||||||||||||||||||||||||||||||||||||||||||||||||||||||||||
| Gender | 1.066 | 0.580 - 1.957 | 0.837 | ||||||||||||||||||||||||||||||||||||||||||||||||||||||||||||||||||||||||||||||||||||||||||||||||
| Male Vs. Female | |||||||||||||||||||||||||||||||||||||||||||||||||||||||||||||||||||||||||||||||||||||||||||||||||||
| Age (years) | 0.979 | 0.557 - 1.720 | 0.940 | ||||||||||||||||||||||||||||||||||||||||||||||||||||||||||||||||||||||||||||||||||||||||||||||||
| >65 ≤ 65 | |||||||||||||||||||||||||||||||||||||||||||||||||||||||||||||||||||||||||||||||||||||||||||||||||||
| Laterality | 1.358 | 0.774 - 2.382 | 0.286 | ||||||||||||||||||||||||||||||||||||||||||||||||||||||||||||||||||||||||||||||||||||||||||||||||
| Right Vs. Left | |||||||||||||||||||||||||||||||||||||||||||||||||||||||||||||||||||||||||||||||||||||||||||||||||||
| Pathological T | 5.782 | 2.937 - 11.383 | <0.001*** | 5.319 | 1.271 - 22.253 | 0.022* | |||||||||||||||||||||||||||||||||||||||||||||||||||||||||||||||||||||||||||||||||||||||||||||
| T3+4 Vs. T1+2 | |||||||||||||||||||||||||||||||||||||||||||||||||||||||||||||||||||||||||||||||||||||||||||||||||||
| Pathological N | 2.465 | 1.203 - 5.053 | 0.014* | 0.989 | 0.450 - 2.174 | 0.978 | |||||||||||||||||||||||||||||||||||||||||||||||||||||||||||||||||||||||||||||||||||||||||||||
| N0 Vs. N1 | |||||||||||||||||||||||||||||||||||||||||||||||||||||||||||||||||||||||||||||||||||||||||||||||||||
| Pathological M | 16.800 | 7.606 - 37.110 | <0.001*** | 6.820 | 2.893 - 16.078 | <0.001*** | |||||||||||||||||||||||||||||||||||||||||||||||||||||||||||||||||||||||||||||||||||||||||||||
| M1 Vs. M0 | |||||||||||||||||||||||||||||||||||||||||||||||||||||||||||||||||||||||||||||||||||||||||||||||||||
| Histologic grade | 1.312 | 0.726 - 2.369 | 0.368 | ||||||||||||||||||||||||||||||||||||||||||||||||||||||||||||||||||||||||||||||||||||||||||||||||
| G3+4 Vs. G1+2 | |||||||||||||||||||||||||||||||||||||||||||||||||||||||||||||||||||||||||||||||||||||||||||||||||||
| Stage | 4.872 | 2.554 - 9.293 | <0.001*** | 0.720 | 0.178 - 2.918 | 0.646 | |||||||||||||||||||||||||||||||||||||||||||||||||||||||||||||||||||||||||||||||||||||||||||||
| III+IV Vs. I+II | |||||||||||||||||||||||||||||||||||||||||||||||||||||||||||||||||||||||||||||||||||||||||||||||||||
| CI: confidence interval; ccRCC: clear cell renal cell carcinoma; HR: hazard ratio. (*p < 0.05, **p < 0.01, ***p < 0.001). | |||||||||||||||||||||||||||||||||||||||||||||||||||||||||||||||||||||||||||||||||||||||||||||||||||
NUPR1 promotes ccRCC proliferation in vitro
To identify the pathological function of NUPR1 in ccRCC, we synthesized two shRNAs specifically targeting NUPR1. We found that the shRNAs remarkably inhibited the expression of NUPR1 in Caki-2 and A498 cells (Figure 2A). Subsequently, we analyzed the effect of NUPR1 on ccRCC cell proliferation by conducting CCK-8 and colony formation assays. The results showed that knockdown of NUPR1 repressed the growth of ccRCC cells (Figure 2B). Moreover, colony formation assays showed that the colony numbers were significantly reduced after NUPR1 depletion (Figure 2C and Supplementary Figure 2A).
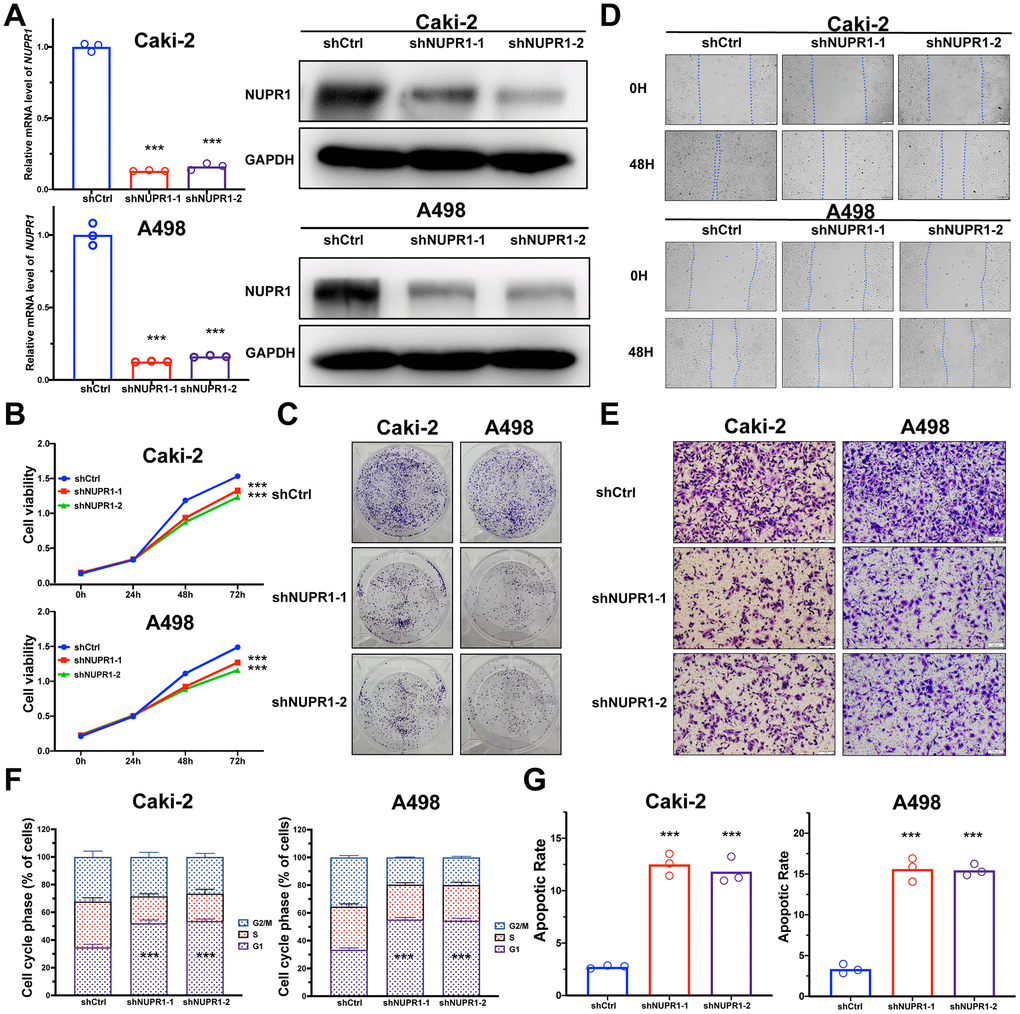
Figure 2. NUPR1 facilitated tumorigenesis of ccRCC in vitro. (A) Verification of NUPR1 mRNA and protein knockdown in ccRCC cell lines. (B) Cell growth curves of CCK-8 assay for ccRCC cell lines with NUPR1 silencing. (C) Colony formation assay for ccRCC cells with NUPR1 depletion. (D) The wound-healing assay of NUPR1 silencing on the migration of ccRCC cells. (E) Transwell experiment analysis of the effect of NUPR1 depletion on migratory and invasive abilities of ccRCC cells. (F) Effects of NUPR1 silencing on cell cycle regulation using flow cytometry. (G) Apoptosis assay of silencing NUPR1 in ccRCC by flow cytometry. (*p < 0.05, **p < 0.01, ***p < 0.001). CCK-8: cell counting kit-8; ccRCC: clear cell renal cell carcinoma.
NUPR1 enhances the aggressive abilities of ccRCC cells in vitro
To further investigate the role of NUPR1 to promote ccRCC metastasis, we analyzed the migratory and invasive abilities of ccRCC cells by manipulating NUPR1 expression. To inhibit the expression of NUPR1 in ccRCC cells, two shRNAs were transduced into Caki-2 and A498 cells. The wound healing assay indicated that NUPR1 knockdown predominantly suppressed metastatic function in both Caki-2 and A498 cells (Figure 2D and Supplementary Figure 2B). Further, the depletion of NUPR1 significantly reduced the migratory and invasive abilities of Caki-2 and A498 cells in the Transwell assay (Figure 2E and Supplementary Figure 2C).
NUPR1 knockdown induces G0/G1 arrest and promotes ccRCC cell apoptosis
To elucidate the mechanism underlying NUPR1 promotion of cell growth and proliferation, cell cycle and cell apoptosis regulation were assessed via flow cytometry. As shown in Figure 2F, decreased expression of NUPR1 notably reduced the proportion of cells in the S phase and G2/M phases of mitosis; in contrast, more cells were arrested in the G0/G1 phases (Supplementary Figure 3A). The FACS analysis illustrated that NUPR1 deficiency efficaciously facilitated the apoptosis of Caki-2 and A498 cells (Figure 2G and Supplementary Figure 3B). These results showed that NUPR1 depletion inhibited cell cycle progression and induced cell apoptosis.
NUPR1 knockdown inhibits the growth of ccRCC cells in vivo
To assess the effect of NUPR1 on ccRCC tumorigenicity in vivo, we established a xenograft mouse model in which Caki-2 cells transfected with shCtrl, shNUPR1-1 or shNUPR1-2 were inoculated subcutaneously into the dorsal regions of nude mice. The xenograft assay demonstrated that the xenograft tumors in mice that received NUPR1-depleted cells were significantly reduced in terms of weight and volume compared with the control group (Figure 3A, 3B). Moreover, immunohistochemical staining revealed that Ki-67 expression was remarkably decreased in NUPR1-depleted xenografts, indicating that the knockdown of NUPR1 attenuated tumor proliferation (Figure 3C).
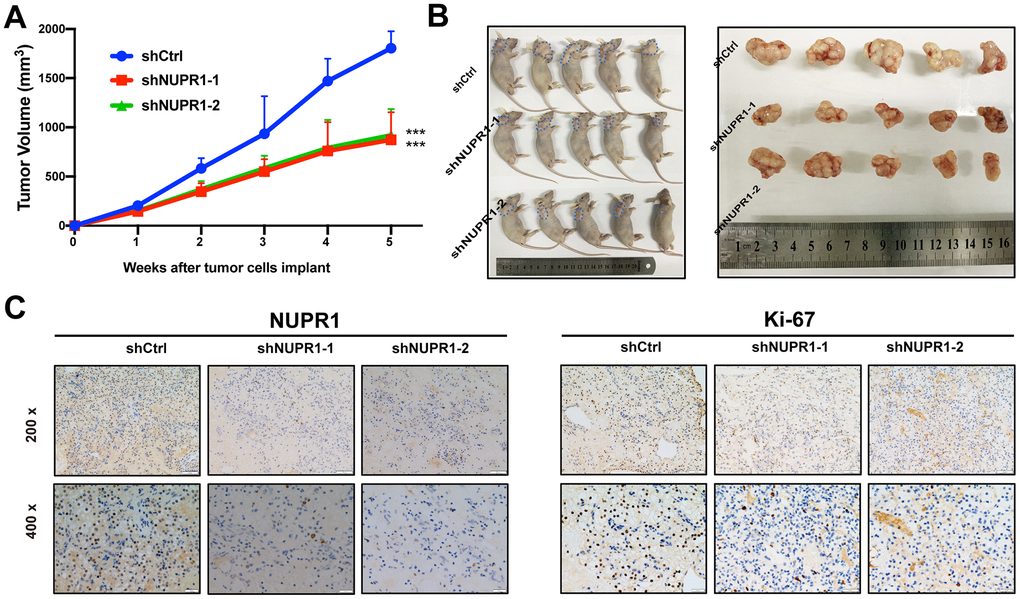
Figure 3. NUPR1 promoted aggressive abilities of ccRCC in vivo. (A) Growth curves of subcutaneous xenografts in nude mice (n=5). (B) Photographs of nude mice and xenografts. (C) NUPR1 and Ki-67 expression were detected by IHC in xenografts sections. (*p < 0.05, **p < 0.01, ***p < 0.001). ccRCC: clear cell renal cell carcinoma; IHC: Immunohistochemistry.
Downregulation of NUPR1 increases sensitivity to sorafenib in ccRCC
ccRCC is a lethal urologic malignancy that causes the most deaths, most of which are a result of relapse or resistance to tyrosine kinase inhibitor (TKI) treatment, usually sorafenib. Therefore, we thoroughly explored whether the suppression of NUPR1 expression in ccRCC increases sensitivity to sorafenib treatment. As shown in Figure 4A, 4B, NUPR1 expression was increased after sorafenib treatment. NUPR1 mRNA transcription was induced in ccRCC cell lines in a dose- and time- dependent manner. Consistent with previous results, immunoblotting showed that exposure to sorafenib promoted NUPR1 protein expression (Figure 4B). Then, we cultured ccRCC cells in different concentrations of sorafenib to calculate the IC50 in vitro. The results indicated that Caki-2 and A498 cells expressing shNUPR1-1 or shNUPR1-2 were more sensitive, with a lower IC50 for sorafenib than control cells (Figure 4C) and a decreased capacity for cell proliferation and colony formation (Figure 4D and Supplementary Figure 4A). Consistently, FACS demonstrated that exposure to sorafenib led to an increased apoptotic rate among NUPR1 depleted cells (Figure 4E and Supplementary Figure 4B). However, the sorafenib does not induce cell cycle arrest (Supplementary Figure 4C, 4D). Together, these data indicated that NUPR1 was required for sorafenib resistance in vitro.
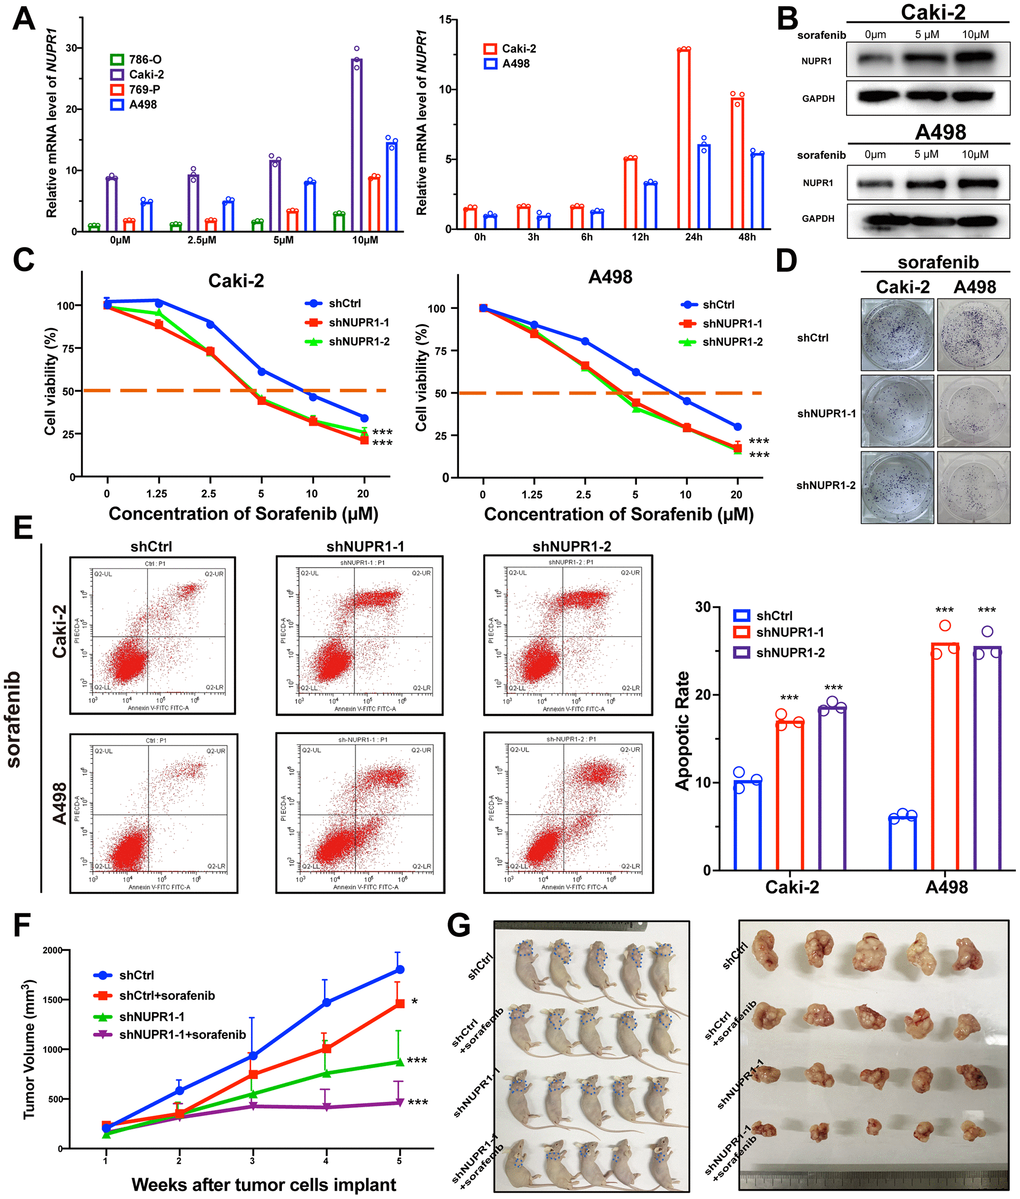
Figure 4. Depletion of NUPR1 promoted sensitivity to sorafenib in ccRCC. (A) Time and concentration-dependent manner of sorafenib treatment on NUPR1 expression in ccRCC cell lines verified by qRT-PCR. (B) Western blot assay of sorafenib inducing NUPR1 protein expression. (C) CCK-8 assay of NUPR1 silencing after sorafenib treatment at the indicated concentrations for 24h. The IC50 values were 10.26, 5.28, 5.86 μM for shCtrl, shNUPR1-1, shNUPR1-2, respectively in Caki-2. The IC50 values were 8.73, 4.55, 4.36 μM, respectively in A498. (D) Colony formation experiments of NUPR1 silencing after sorafenib (5μM) treatment for 2 weeks. (E) Flow cytometry analysis of effects of NUPR1 depletion on apoptosis after sorafenib (5μM) treatment for 24h. (F) Growth curves of subcutaneous xenografts in nude mice (n=5) under different treatments. (G) Images of nude mice and anatomical picture of subcutaneous xenografts. (*p < 0.05, **p < 0.01, ***p < 0.001). CCK-8: cell counting kit-8; ccRCC: clear cell renal cell carcinoma; IC50: 50% inhibiting concentration; qRT-PCR: quantitative real-time reverse transcription PCR.
To validate these data in vivo, we utilized xenografts established with Caki-2 cells expressing shCtrl or shNUPR1. Each group was treated with either sorafenib (40 mg/kg per day) or saline solution once the tumor reached a diameter of 5 mm. As shown in Figure 4F, 4G, sorafenib treatment caused a reduction in tumor volume compared to that of control xenografts. The intensity of ki-67 in xenograft with NUPR1 depletion and sorafenib treatment decreased more significantly compared to NUPR1 depletion or sorafenib treatment alone (Supplementary Figure 4E). Furthermore, there also was synergism of NUPR1 silencing and sorafenib in promoting apoptosis in xenografts in TUNEL assay (Supplementary Figure 4F).
Taken together, these data demonstrated that NUPR1 depletion increased sensitivity to sorafenib both in vitro and in vivo.
Reduced expression of NUPR1 leads to deceased stemness in ccRCC cells
To further explore the underlying mechanisms by which NUPR1 promoted ccRCC tumorigenesis, we performed GSEA based on TCGA data form and identified several enriched pathways. Notably, enrichment analysis showed that overexpression of NUPR1 was associated with the cancer pathway, cancer cell stemness, mTOR pathway and renal cell carcinoma (Figure 5A).
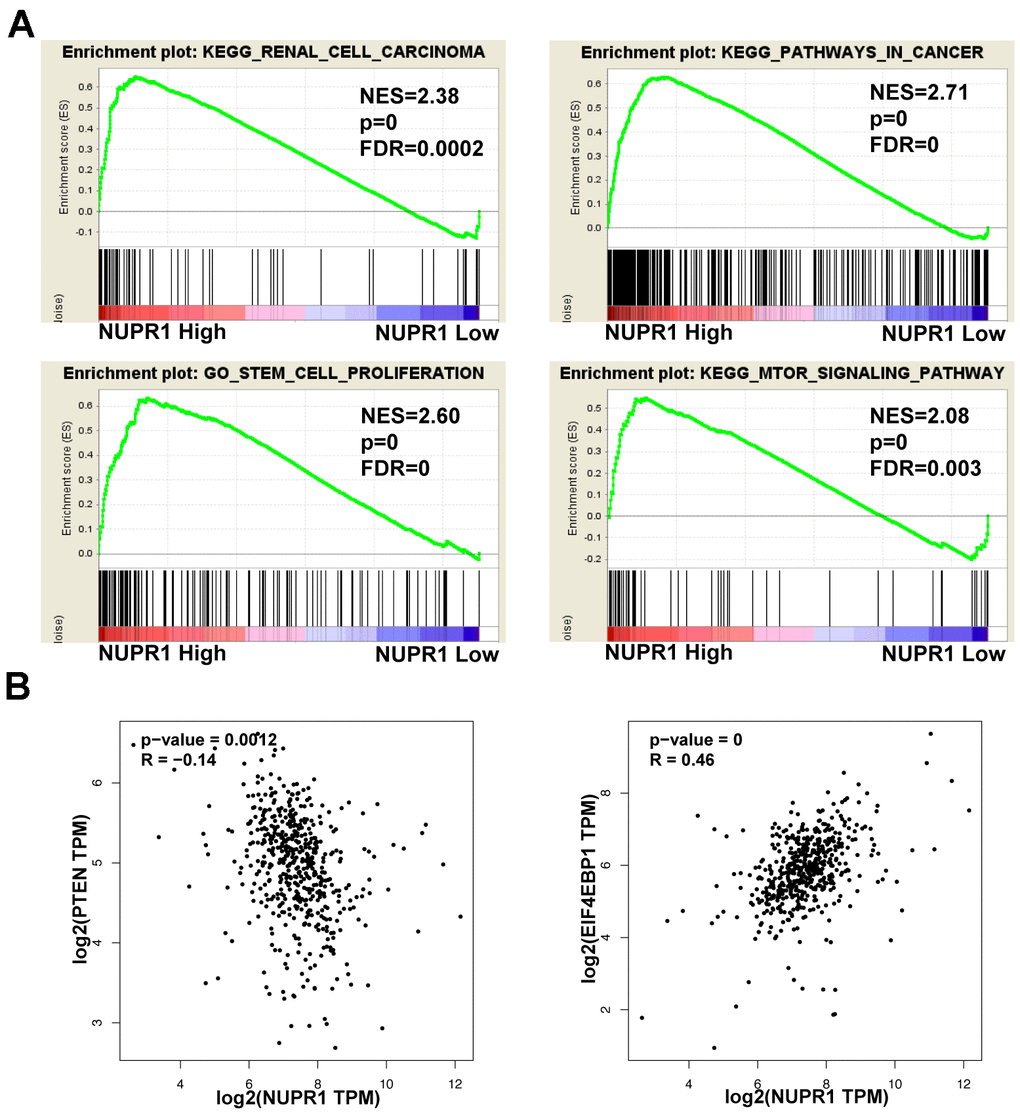
Figure 5. Pathways involved in the pathogenesis of NUPR1 with GSEA and correlation analysis between NUPR1 and PTEN, 4EBP1 in TCGA-KIRC cohort. (A) Enrichment curves for activated gene sets using GSEA pathway analysis. (B) Correlation between NUPR1 and 4EBP1 in TCGA-KIRC dataset. (*p < 0.05, **p < 0.01, ***p < 0.001). GSEA: gene set enrichment analysis; KIRC: Kidney renal clear cell carcinoma; TCGA: The Cancer Genome Atlas database.
To investigate the relevance of NUPR1 to the stem-like phenotype, stem cell biomarkers were assessed using qRT-PCR and western blot. We demonstrated that the mRNA and protein levels of Nanog, CD44, OCT-4 and Sox2 were significantly decreased in ccRCC cells transfected with shNUPR1 compared with control cells (Figure 6A and Supplementary Figure 5A, 5B). Moreover, the sphere assay revealed that a notably smaller size of spheres formed in culture and that a smaller number of spheres was also observed when NUPR1 was inhibited (Figure 6B). Collectively, these data suggested that NUPR1 played a role in the transition to a stem-like phenotype in ccRCC cells.
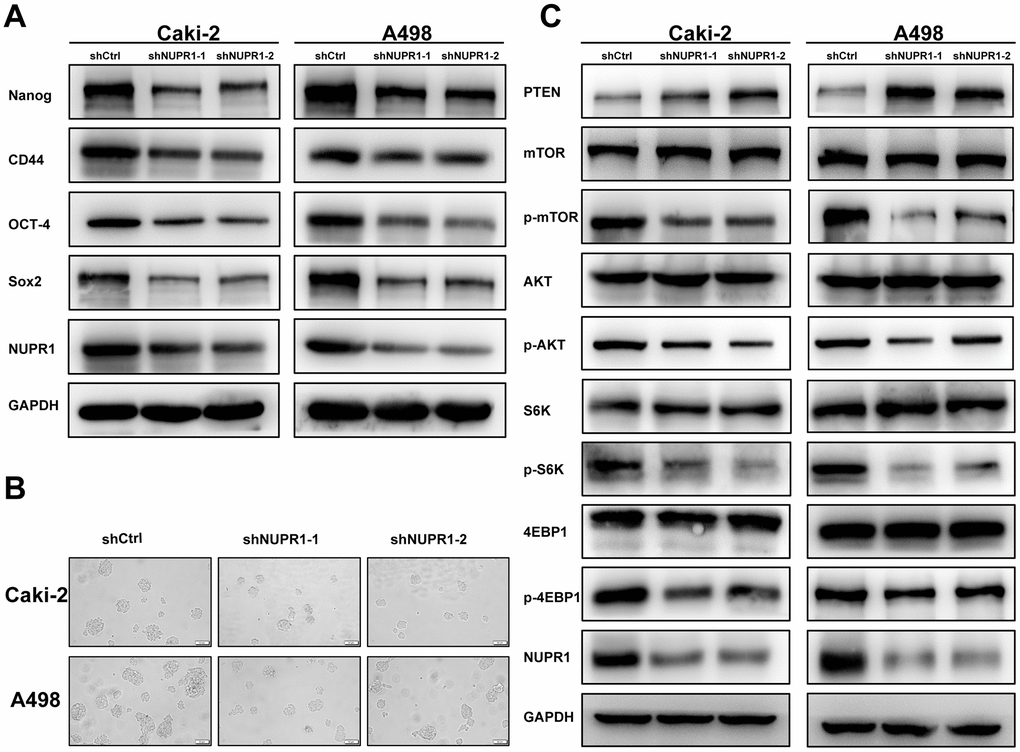
Figure 6. NUPR1 silencing mediated stem-like properties and suppressed the PTEN/AKT/mTOR signaling pathway in ccRCC. (A) Western blot analysis of effects of NUPR1 depletion on stemness-related biomarkers. (B) Tumor sphere assay was used for analysis of cancer stemness for NUPR1 silencing. (C) knockdown of NUPR1 increased PTEN and decreased the protein levels of p-mTOR, p-AKT, p-S6K and p-4EBP1 in ccRCC cells. (*p < 0.05, **p < 0.01, ***p < 0.001).
NUPR1 depletion suppresses ccRCC by activating the PTEN/AKT/mTOR pathway in ccRCC cells
As the PTEN/AKT/mTOR pathway regulates stemness and metastasis and it is frequently activated in ccRCC, we examined the effect of NUPR1 on this signaling pathway. We conducted a correlation analysis between NUPR1 and the PTEN and 4EBP1 in GEPIA database (http://gepia.cancer-pku.cn) (Figure 5B). As shown in Figure 6C, a decrease in key proteins in the pathway, specifically phosphorylated AKT, mTOR, S6K and 4EBP1 but not in the total amount of these molecules, was observed in Caki-2 and A498 cells with NUPR1 knockdown compared with control cells. Moreover, PTEN, the negative regulator of the AKT/mTOR signaling pathway, was increased in NURP1-knockdown cells.
Discussion
Renal cell carcinoma, one of the most common urological malignancies, is characterized by frequent inactivation of the VHL gene and hyperactivation of the HIF-VEGF axis, leading to abundant vascularization within tumors. Over one-third of ccRCC patients harbor metastasis with a very low five-year survival rate [23]. Although TKI drugs such as sunitinib, sorafenib and axitinib greatly benefit metastatic ccRCC patients, they do not produce a durable response, as ccRCC patients inevitably acquire drug resistance [24]. Thus, there is an urgent need to elucidate the molecular mechanism(s) of resistance to TKI therapy.
Cancer cells can develop mechanisms to adapt to stressful environmental conditions, such as hypoxia, deprivation of nutrition and drugs [25–28]. These adaptations activate several stress proteins to facilitate cancer cell survival, growth, development and progression. Recently, accumulating evidence has revealed that cancer cell biological function relies highly on these stress-induced proteins [29, 30]. Thus, understanding the mechanisms of stress factors could shed light on drug resistance and mine promising therapeutic targets in cancer treatment.
NUPR1 is a stress-response transcription factor upregulated by many biological and chemical stressors [31]. It was first reported to be activated in the acute phase of pancreatitis [11]. NUPR1 has been demonstrated to participate in many malignancy-related processes, including regulation of the cell cycle [32], apoptosis [33], senescence [17], DNA damage response [34], metastasis [19] and autophagy [35]. NUPR1 dysregulation has been reported in several malignancies, including breast cancer [36], pancreatic cancer [11, 37], lung cancer [35], prostate cancer [38], colorectal cancer [39] and glioma [40]. Several studies have shown that NUPR1 plays a key role in antidrug resistance by mediating autophagy and antiapoptotic activities [41, 42]. However, the role and prognostic value of NUPR1 in ccRCC remain unexplored.
According to TCGA dataset, overexpression of NUPR1 was observed in a variety of solid tumors including three RCC subtypes (KIRC, KICH, KIRP), glioblastoma multiforme (GBM) and lymphoma, compared to that in the corresponding normal tissues (Supplementary Figure 1A). In this study, we assessed NUPR1 expression in cancer cell lines, clinical ccRCC samples and adjacent kidney tissue. The results revealed that NUPR1 was overexpressed in ccRCC tissues. Furthermore, NUPR1 upregulation was associated with elevated pathologic T stage, clinical stage and nuclear grade (Figure 1F). Moreover, high NUPR1 expression promoted metastasis, suggesting that NUPR1 is a promising biomarker for predicting progression. ccRCC patients expressing higher NUPR1 exhibited a lower OS and DFS probability than those with lower NUPR1 levels (Figure 1G, 1H). Thus, we propose NUPR1 as a prognostic candidate for individual stratification of ccRCC subgroups, which might benefit from more personalized medicine. In addition, we also observed that silencing NUPR1 resulted in decreased cell proliferation, colony formation, migration and invasion (Figure 2 and Supplementary Figure 2).
Sorafenib has been shown to effectively inhibit vascularization and suppress tumor progression [43]. However, the majority of advanced ccRCC patients who receive sorafenib exhibit progression within 15 months of treatment [9]. The mechanisms of sorafenib resistance remain complex and unclarified. Anticancer drug resistance has always been a major challenge for ccRCC treatment. Therefore, there is an intense focus on studies of the drug resistance.
Several studies have demonstrated that NUPR1 transcriptionally regulates the expression of several drug resistance-associated genes to mediate drug resistance in various malignancies [22, 38, 44]. A previous study reported that NUPR1 mediated sorafenib resistance in hepatocellular carcinoma [42]. However, the role of NUPR1 in sorafenib resistance has not been elucidated in ccRCC. Our results revealed that the expression of NUPR1 could be induced by sorafenib and that this upregulation mediated the resistance of ccRCC cells to sorafenib. Furthermore, downregulation of NUPR1 by shRNA promoted the sensitivity of ccRCC cells to sorafenib both in vitro and in vivo. These findings render NUPR1 a promising target for the treatment of sorafenib-resistant ccRCC. The mechanism of NUPR1 silencing in reducing resistance to sorafenib may be multifactorial.
Cancer stem cells, a small subgroup of tumor cells, have self-renewal and multipotency and play an important role in carcinogenesis, progression and drug resistance [45]. Recently, several studies reported that sorafenib resistance is associated with activated stemness of cancer cells in hepatocellular carcinoma [46, 47]. Thus, inhibition of cancer cell stemness is a potential strategy for of reversing drug resistance. Emma and his colleagues reported that NUPR1 was involved in sorafenib resistance and that silencing of NUPR1 inhibited cell growth migration and increased sensitivity to sorafenib [42]. However, there is no evidence to prove that NUPR1 regulates the cancer stemness and sorafenib resistance in ccRCC. Here, our data showed that sorafenib upregulated NUPR1 expression. Furthermore, we demonstrated that NUPR1 depletion led to a significant reversal of the resistance to sorafenib in ccRCC, which involved the downregulation of stemness-associated genes, including Nanog, CD44, Sox2 and Oct-4.
The PTEN/AKT/mTOR axis plays a pivotal role in cell growth, invasion, metastasis and drug resistance in ccRCC [48, 49]. AKT/mTOR signaling is frequently activated in ccRCC and is associated with progression and poor survival [23]. Therefore, new therapeutic strategies targeting this pathway may overcome drug resistance and improve clinical outcomes. By GSEA analysis, we discovered that AKT/mTOR signaling was positively correlated with NUPR1 (Figure 5A), suggesting that NUPR1 might promote sorafenib resistance by AKT/mTOR signaling. Here, we showed that depletion of NUPR1 promoted PTEN expression and suppressed AKT/mTOR signaling in ccRCC cells (Figure 6C). Mechanistic investigation revealed that AKT/mTOR pathway activation was important for the oncogenic properties of NUPR1 in ccRCC.
Conclusions
To date, this is the first work to investigate the role of NUPR1 in ccRCC. We have demonstrated that overexpression of NUPR1 is closely associated with metastatic features and a worse prognosis in ccRCC patients. Downregulation of NUPR1 can decrease ccRCC cell growth and metastasis in vitro and in vivo. Notably, NUPR1 facilitates the proliferation and migration of ccRCC cells by promoting stemness and activating the PTEN/AKT/mTOR signaling pathway. Here, we report that NUPR1 silencing reverses sorafenib resistance in ccRCC. Collectively, our data suggest that NUPR1 serves as a promising prognostic biomarker in ccRCC and functions as an oncogene to promote tumorigenesis. Targeting NUPR1 may represent a novel potential therapeutic strategy in the clinical management of ccRCC.
Materials and Methods
In silico analysis
NUPR1 expression levels in RCC (KIRC, KICH, KIRP) specimens and the correlated clinical data, including TNM stage, tumor grade, overall survival (OS), and disease-free survival (DFS), were downloaded from The Cancer Genome Atlas database (TCGA; https://xenabrowser.net/heatmap/). Gene set enrichment analysis (GSEA; http://software.broadinstitute.org/gsea/index.jsp) was performed to determine signaling pathways and molecules involved in the pathogenesis of ccRCC when NUPR1 was highly expressed. The NUPR1 mean level was used as the cutoff criterion.
Patients, tissue specimens and follow-up
A total of 117 patients with primary ccRCC who underwent surgery between January 2010 and December 2019 at Shandong Provincial Hospital were included in this study. No patients had received targeted therapy, chemotherapy or radiotherapy prior to surgery. The entire procedure was approved by the Ethics Review Committee of the Shandong Provincial Hospital. The study was performed in accordance with the Declaration of Helsinki and the guidelines of the committee. Written informed consent was obtained from each patient in the study. The paraffin-embedded tissue of the patient in the study was re-embedded into new blocks for Immunohistochemical staining. Pathological specimens and clinicopathological characteristics were collected, and all samples were anonymous. Patients were followed up from the date of surgery, with a mean follow-up of 39 months. Overall survival was defined as the interval between surgery and death from any cause or the last follow-up. Disease-free survival was calculated as the interval between the initial surgery and disease progression or censoring at the time of last follow-up.
Immunohistochemical (IHC) staining
Slides were stained with antibodies against NUPR1(ab234696, Abcam, Shanghai), and Ki-67(ZM-0166, ZSGB-Bio, Beijing), according to standard immunoperoxidase-staining procedures. Positive staining for NUPR1 and Ki-67 was observed in the nuclei [50]. The sections were evaluated by two independent pathologists who calculated their corresponding IHC score. Five fields of vision were randomly selected per section at a magnification of 400 ×. The scores were recorded as four grades (0-3) based on the quantity of immunoreactive cells. The semiquantitative analysis of NUPR1 staining using a 4-grade scale was defined as follows: sections with no labeling or labeled cells < 5% were scored as 0, sections with 5–25% of labeled cells were scored as 1, with 25–50% of labeled cells as 2, and with >50% of labeled cells as 3. The median IHC score was used as the cutoff value to separate patients into high and low NUPR1 expression groups.
Cell culture
HEK293T cells, the human ccRCC cell lines 786-O, 769-P, A498, and Caki-2 and the human renal cortex/proximal tubular epithelial cell line HK-2 were obtained from the Type Culture Collection Cell Bank, Chinese Academy of Science Committee (Shanghai, China). HEK293T cells were grown in DMEM (Gibco, USA). 786-O and 769-P cells were grown in RPMI 1640(Gibco, USA). A498 were grown in McCoy’s 5A (Gibco, USA). HK-2 cells were grown in DMEM/Hams F12 (Gibco, USA). All media were supplemented with 10% fetal bovine serum (Gibco, USA), 100 U/mL penicillin and 100 ug/mL streptomycin (Invitrogen). Cells were maintained in a humidified incubator at 37° C and 5% CO2.
Lentivirus shRNA-mediated knockdown of NUPR1
Two shRNAs (shRNA1:5’-CCGGGGATGAATCTGACCTCTATAGCTCGAGCT-ATAGAGGTCAGATTCATCCTTTTTG-3’; shRNA2:5’-CCGGGAGAGGAAACT-GGTGACCAAGCTCGAGCTTGGTCACCAGTTTCCTCTCTTTTTG-3’) were constructed to target NUPR1 in subsequent experiments. Nontarget shRNA (sequence: 5’-CCGGGCGCGATAGCGCTAATAATTTCTCGAGAAATTATTAGC GCT ATCGCGCTTTT-3’) was also constructed. shNUPR1 and nontarget shRNA were inserted into a GenePharma supersilencing vector (pGLVH1/GFP-puromycin). Recombinant lentiviruses expressing NUPR1 shRNA or nontarget shRNA (shNUPR1 and shCtrl, respectively) were produced by GenePharma (Shanghai, China). Cells were transduced with concentrated virus, and stable clones were selected with puromycin (Sigma) for two weeks. Knockdown of NUPR1 expression at the mRNA level was confirmed by qRT-PCR as discussed below.
RNA extraction and quantitative real-time reverse transcription PCR (qRT-PCR)
Total RNA of frozen tissue or cell lines was isolated and purified using Invitrogen TRIzol Reagent (Thermo Fisher Scientific) following the manufacturer’s protocol. The mRNA was reverse transcribed into cDNA using a standard procedure with a TaqMan Reverse Transcriptase Kit (Qiagen, Valencia, CA). SYBR green-based quantitative real-time PCR was subsequently carried out with a 7500 ABI detection system. Relative expression was determined by the 2−ΔΔCt method. The primer sequences used are listed in Supplementary Table 1.
SDS-PAGE and western blotting
Cells were lysed using RIPA buffer (R0010, Solarbio, Beijing), and total protein was extracted. After concentration was determined, aliquots of 100 μg of total protein and Tricolor Prestained Protein Marker (PR1930, Solarbio, Beijing) were mixed with buffer and loaded into each well of an SDS-PAGE gel for subsequent electrophoresis and then transferred to PVDF membranes which were blocked with 5% nonfat milk. The samples were then incubated with primary antibodies against GAPDH (ab8245, Abcam, Shanghai), NUPR1 (ab6028, Abcam, Shanghai), PTEN (9552S, Cell Signaling Technology), mTOR (2972, Cell Signaling Technology), p-mTOR (2971, Cell Signaling Technology), AKT (8805, Cell Signaling Technology), p-AKT (4060, Cell Signaling Technology), S6K (9202, Cell Signaling Technology), pS6K, (9204, Cell Signaling Technology), 4EBP1 (9644, Cell Signaling Technology) and p-4EBP1 (9451, Cell Signaling Technology) overnight at 4° C. After extensive washing, the membranes were incubated with the corresponding secondary antibody for 2 h at room temperature. The protein bands were visualized by using an enhanced chemiluminescence kit (Amersham Biosciences, Tokyo, Japan).
Cell proliferation assay
Cell proliferation was assessed by the Cell Counting Kit-8 (CCK8) (Dojindo Laboratories, Kumamoto, Japan). In brief, cells were seeded in a 96-well plate at a density of 4×10³ cells/well and allowed to adhere. CCK-8 solution (10 μl) was added to each well, and the cells were cultured in 5% CO2 at 37° C for 2 h. Cell proliferation was determined by measuring the absorbance at 450 nm. Cell proliferation curves were plotted using the absorbance at each time point.
Colony formation assay
Cells with a density of 500 per well were seeded in 6-well plates. Fresh culture medium was replaced every 3 days. After 2 weeks of incubation, individual colonies (> 50 cells/colony) were fixed and stained with 1% crystal violet for 1 h. Colonies were observed and counted, microscopically.
Migration assays
A total of 4 × 10⁴ cells were plated in the upper compartment of TranswellTM chambers (8 μm pore size, Corning, NY, USA) in serum-free medium. Fresh medium containing 10% FBS was added to the lower chamber. After incubation for 36 h, the cells in the lower membrane were fixed with paraformaldehyde solution for 15 minutes at room temperature and then stained with 0.1% crystal violet for 2 h. Three 20 × magnification fields were randomly chosen for counting the cell number under a microscope.
Wound healing calculation
Caki-2 cells and A498 cells were plated in 6-well plates. A linear scratch wound was made by a 20-μl pipette tip in a confluent monolayer of cells. After 48 h of incubation in medium without FBS, the wound area was observed and photographed under a microscope.
Cell cycle and apoptosis
Flow cytometry was utilized to profile the cell cycle and apoptosis. After trypsinization, ccRCC cells were harvested, washed, and fixed, and the cells were incubated in a solution with 10 mg/ml RNase and 1 mg/ml propidium iodide (KeyGen Biotech, Nanjing, China) at 37° C for 30 minutes in the dark. Finally, the cells were analyzed on a flow cytometer (BD Biosciences, USA). Cultured ccRCC cells were harvested and centrifuged, and then stained with an Annexin V-FITC and PI apoptosis detection kit (KeyGen Biotech, Nanjing, China) in the dark for 15 minutes at room temperature. Cellular apoptosis was assessed by a flow cytometer (BD Biosciences, USA).
Tumorsphere formation
Caki-2 or A498 cells were seeded on ultralow attachment 6-well plates (Corning, NY, USA) at 5×10³ cells per well for primary tumorsphere formation. After incubation for 2 weeks, tumorspheres were collected and enzymatically dissociated by trypsin. For secondary tumorsphere formation, 2000 cells per well were plated in ultralow attachment 96-well plates again. Cells were grown in StemXVivo Serum-Free Media (R&D systems) supplemented with 2 U/ml heparin (H8060, Solarbio, Beijing) and 0.8 μg/ml hydrocortisone (G8450, Solarbio, Beijing). Two weeks later, tumorspheres were observed and analyzed under an inverted phase-contrast light microscope (Olympus).
In vivo tumorigenicity assay
Xenograft mouse models using ccRCC cell lines have been well established by our team. Four- to six- week-old male BALB/c nude mice were obtained from Vital River Company (Beijing, China) for in vivo xenografts, and maintained under conditions as specified. Five mice were randomized into shCtrl, shNUPR1-1, and shNUPR1-2 groups and subcutaneously inoculated with Caki-2 and A498 cells. Tumor size was monitored by measuring the tumor volume every week with a caliper. The tumor volume was calculated as length × width2 × 0.52. Four weeks after inoculation, following euthanasia, the tumor was harvested, weighed, and imaged. All procedures were approved by the Animal Care and Use Committee at Shandong Provincial Hospital.
Statistical analysis
SPSS 25.0 (IBM, Armonk, NY, USA) and GraphPad Prism 8.0 (GraphPad Software, San Diego, CA) were used for statistical analysis. All quantitative data are presented as the mean ± standard obtained from at least three independent experiments. Student’s t-tests or one-way ANOVA tests were used to evaluate the relationship between parametric variables. Chi-squared tests were used to assess the relationship between nonparametric variables. Significant prognostic predictors in univariate and multivariate analyses were performed using a Cox proportional hazards regression model. Survival probabilities were calculated by the Kaplan-Meier method and compared between groups using a log-rank test. In all analyses, p < 0.05 was considered statistically significant (*p < 0.05, **p < 0.01, ***p < 0.001).
Ethic approval and informed consent
The study was approved by the Institutional Review Board of the Ethics Committee of Shandong Provincial Hospital (No. SWYX2020-256). The study protocol conformed to the ethical guidelines of the 1975 Declaration of Helsinki. The written informed consents from the patients were obtained from the patients to publish this manuscript. All protocols involving mice were approved by the Laboratory Animal Ethics Committee of Shandong Provincial Hospital (No. 2020-019).
Consent for publication
All patients or their caregivers signed a consent form giving permission to use their anonymous data for research.
Data availability
The datasets used and/or analyzed during the current study are available from the corresponding author on reasonable request.
Author Contributions
Wei He conducted all experiments and analyzed the data. Fajuan Cheng and Bin Zheng provided support with experimental techniques. Jianwei Wang provided clinical samples. Guiting Zhao and Zhongshun Yao collected clinical data. Wei He wrote the manuscript. Tong Zhang contributed to manuscript revision. Tong Zhang conceived the project and supervised all experiments. All authors read and approved the final manuscript.
Conflicts of Interest
The authors declare that they have no conflicts of interest.
Funding
This research did not receive any specific grant from funding agencies in the public, commercial, or not-for-profit sectors.
References
- 1. Siegel RL, Miller KD, Jemal A. Cancer statistics, 2020. CA Cancer J Clin. 2020; 70:7–30. https://doi.org/10.3322/caac.21590 [PubMed]
- 2. Dizman N, Philip EJ, Pal SK. Genomic profiling in renal cell carcinoma. Nat Rev Nephrol. 2020; 16:435–51. https://doi.org/10.1038/s41581-020-0301-x [PubMed]
- 3. Ricketts CJ, De Cubas AA, Fan H, Smith CC, Lang M, Reznik E, Bowlby R, Gibb EA, Akbani R, Beroukhim R, Bottaro DP, Choueiri TK, Gibbs RA, et al, and Cancer Genome Atlas Research Network. The Cancer Genome Atlas Comprehensive Molecular Characterization of Renal Cell Carcinoma. Cell Rep. 2018; 23:313–26.e5. https://doi.org/10.1016/j.celrep.2018.03.075 [PubMed]
- 4. Choueiri TK, Kaelin WG
Jr . Targeting the HIF2-VEGF axis in renal cell carcinoma. Nat Med. 2020; 26:1519–30. https://doi.org/10.1038/s41591-020-1093-z [PubMed] - 5. Capitanio U, Bensalah K, Bex A, Boorjian SA, Bray F, Coleman J, Gore JL, Sun M, Wood C, Russo P. Epidemiology of Renal Cell Carcinoma. Eur Urol. 2019; 75:74–84. https://doi.org/10.1016/j.eururo.2018.08.036 [PubMed]
- 6. Bhatt JR, Finelli A. Landmarks in the diagnosis and treatment of renal cell carcinoma. Nat Rev Urol. 2014; 11:517–25. https://doi.org/10.1038/nrurol.2014.194 [PubMed]
- 7. Zisman A, Pantuck AJ, Wieder J, Chao DH, Dorey F, Said JW, deKernion JB, Figlin RA, Belldegrun AS. Risk group assessment and clinical outcome algorithm to predict the natural history of patients with surgically resected renal cell carcinoma. J Clin Oncol. 2002; 20:4559–66. https://doi.org/10.1200/JCO.2002.05.111 [PubMed]
- 8. Motzer RJ, Hutson TE, Tomczak P, Michaelson MD, Bukowski RM, Rixe O, Oudard S, Negrier S, Szczylik C, Kim ST, Chen I, Bycott PW, Baum CM, Figlin RA. Sunitinib versus interferon alfa in metastatic renal-cell carcinoma. N Engl J Med. 2007; 356:115–24. https://doi.org/10.1056/NEJMoa065044 [PubMed]
- 9. Rini BI, Atkins MB. Resistance to targeted therapy in renal-cell carcinoma. Lancet Oncol. 2009; 10:992–1000. https://doi.org/10.1016/S1470-2045(09)70240-2 [PubMed]
- 10. Goruppi S, Patten RD, Force T, Kyriakis JM. Helix-loop-helix protein p8, a transcriptional regulator required for cardiomyocyte hypertrophy and cardiac fibroblast matrix metalloprotease induction. Mol Cell Biol. 2007; 27:993–1006. https://doi.org/10.1128/MCB.00996-06 [PubMed]
- 11. Mallo GV, Fiedler F, Calvo EL, Ortiz EM, Vasseur S, Keim V, Morisset J, Iovanna JL. Cloning and expression of the rat p8 cDNA, a new gene activated in pancreas during the acute phase of pancreatitis, pancreatic development, and regeneration, and which promotes cellular growth. J Biol Chem. 1997; 272:32360–69. https://doi.org/10.1074/jbc.272.51.32360 [PubMed]
- 12. Giroux V, Malicet C, Barthet M, Gironella M, Archange C, Dagorn JC, Vasseur S, Iovanna JL. p8 is a new target of gemcitabine in pancreatic cancer cells. Clin Cancer Res. 2006; 12:235–41. https://doi.org/10.1158/1078-0432.CCR-05-1700 [PubMed]
- 13. Cano CE, Hamidi T, Sandi MJ, Iovanna JL. Nupr1: the Swiss-knife of cancer. J Cell Physiol. 2011; 226:1439–43. https://doi.org/10.1002/jcp.22324 [PubMed]
- 14. Li J, Ren S, Liu Y, Lian Z, Dong B, Yao Y, Xu Y. Knockdown of NUPR1 inhibits the proliferation of glioblastoma cells via ERK1/2, p38 MAPK and caspase-3. J Neurooncol. 2017; 132:15–26. https://doi.org/10.1007/s11060-016-2337-0 [PubMed]
- 15. Fan T, Chen Y, He Z, Wang Q, Yang X, Ren Z, Zhang S. Inhibition of ROS/NUPR1-dependent autophagy antagonises repeated cadmium exposure -induced oral squamous cell carcinoma cell migration and invasion. Toxicol Lett. 2019; 314:142–52. https://doi.org/10.1016/j.toxlet.2019.07.017 [PubMed]
- 16. Malicet C, Giroux V, Vasseur S, Dagorn JC, Neira JL, Iovanna JL. Regulation of apoptosis by the p8/prothymosin alpha complex. Proc Natl Acad Sci USA. 2006; 103:2671–76. https://doi.org/10.1073/pnas.0508955103 [PubMed]
- 17. Grasso D, Garcia MN, Hamidi T, Cano C, Calvo E, Lomberk G, Urrutia R, Iovanna JL. Genetic inactivation of the pancreatitis-inducible gene Nupr1 impairs PanIN formation by modulating Kras(G12D)-induced senescence. Cell Death Differ. 2014; 21:1633–41. https://doi.org/10.1038/cdd.2014.74 [PubMed]
- 18. Brannon KM, Million Passe CM, White CR, Bade NA, King MW, Quirk CC. Expression of the high mobility group A family member p8 is essential to maintaining tumorigenic potential by promoting cell cycle dysregulation in LbetaT2 cells. Cancer Lett. 2007; 254:146–55. https://doi.org/10.1016/j.canlet.2007.03.011 [PubMed]
- 19. Sandi MJ, Hamidi T, Malicet C, Cano C, Loncle C, Pierres A, Dagorn JC, Iovanna JL. p8 expression controls pancreatic cancer cell migration, invasion, adhesion, and tumorigenesis. J Cell Physiol. 2011; 226:3442–51. https://doi.org/10.1002/jcp.22702 [PubMed]
- 20. Malicet C, Dagorn JC, Neira JL, Iovanna JL. p8 and prothymosin alpha: unity is strength. Cell Cycle. 2006; 5:829–30. https://doi.org/10.4161/cc.5.8.2686 [PubMed]
- 21. Tang K, Zhang Z, Bai Z, Ma X, Guo W, Wang Y. Enhancement of gemcitabine sensitivity in pancreatic cancer by co-regulation of dCK and p8 expression. Oncol Rep. 2011; 25:963–70. https://doi.org/10.3892/or.2011.1139 [PubMed]
- 22. Vincent AJ, Ren S, Harris LG, Devine DJ, Samant RS, Fodstad O, Shevde LA. Cytoplasmic translocation of p21 mediates NUPR1-induced chemoresistance: NUPR1 and p21 in chemoresistance. FEBS Lett. 2012; 586:3429–34. https://doi.org/10.1016/j.febslet.2012.07.063 [PubMed]
- 23. Choueiri TK, Motzer RJ. Systemic Therapy for Metastatic Renal-Cell Carcinoma. N Engl J Med. 2017; 376:354–66. https://doi.org/10.1056/NEJMra1601333 [PubMed]
- 24. Barata PC, Rini BI. Treatment of renal cell carcinoma: Current status and future directions. CA Cancer J Clin. 2017; 67:507–24. https://doi.org/10.3322/caac.21411 [PubMed]
- 25. Garris CS, Pittet MJ. ER Stress in Dendritic Cells Promotes Cancer. Cell. 2015; 161:1492–93. https://doi.org/10.1016/j.cell.2015.06.006 [PubMed]
- 26. Todoric J, Antonucci L, Di Caro G, Li N, Wu X, Lytle NK, Dhar D, Banerjee S, Fagman JB, Browne CD, Umemura A, Valasek MA, Kessler H, et al. Stress-Activated NRF2-MDM2 Cascade Controls Neoplastic Progression in Pancreas. Cancer Cell. 2017; 32:824–39.e8. https://doi.org/10.1016/j.ccell.2017.10.011 [PubMed]
- 27. Linares JF, Cordes T, Duran A, Reina-Campos M, Valencia T, Ahn CS, Castilla EA, Moscat J, Metallo CM, Diaz-Meco MT. ATF4-Induced Metabolic Reprograming Is a Synthetic Vulnerability of the p62-Deficient Tumor Stroma. Cell Metab. 2017; 26:817–29.e6. https://doi.org/10.1016/j.cmet.2017.09.001 [PubMed]
- 28. Seton-Rogers S. Oncogenes: Coping with stress. Nat Rev Cancer. 2017; 17:76–77. https://doi.org/10.1038/nrc.2017.1 [PubMed]
- 29. Saito Y, Li L, Coyaud E, Luna A, Sander C, Raught B, Asara JM, Brown M, Muthuswamy SK. LLGL2 rescues nutrient stress by promoting leucine uptake in ER+ breast cancer. Nature. 2019; 569:275–79. https://doi.org/10.1038/s41586-019-1126-2 [PubMed]
- 30. Port J, Muthalagu N, Raja M, Ceteci F, Monteverde T, Kruspig B, Hedley A, Kalna G, Lilla S, Neilson L, Brucoli M, Gyuraszova K, Tait-Mulder J, et al. Colorectal Tumors Require NUAK1 for Protection from Oxidative Stress. Cancer Discov. 2018; 8:632–47. https://doi.org/10.1158/2159-8290.CD-17-0533 [PubMed]
- 31. Jiang YF, Vaccaro MI, Fiedler F, Calvo EL, Iovanna JL. Lipopolysaccharides induce p8 mRNA expression in vivo and in vitro. Biochem Biophys Res Commun. 1999; 260:686–90. https://doi.org/10.1006/bbrc.1999.0953 [PubMed]
- 32. Valacco MP, Varone C, Malicet C, Cánepa E, Iovanna JL, Moreno S. Cell growth-dependent subcellular localization of p8. J Cell Biochem. 2006; 97:1066–79. https://doi.org/10.1002/jcb.20682 [PubMed]
- 33. Carracedo A, Lorente M, Egia A, Blázquez C, García S, Giroux V, Malicet C, Villuendas R, Gironella M, González-Feria L, Piris MA, Iovanna JL, Guzmán M, Velasco G. The stress-regulated protein p8 mediates cannabinoid-induced apoptosis of tumor cells. Cancer Cell. 2006; 9:301–12. https://doi.org/10.1016/j.ccr.2006.03.005 [PubMed]
- 34. Aguado-Llera D, Hamidi T, Doménech R, Pantoja-Uceda D, Gironella M, Santoro J, Velázquez-Campoy A, Neira JL, Iovanna JL. Deciphering the binding between Nupr1 and MSL1 and their DNA-repairing activity. PLoS One. 2013; 8:e78101. https://doi.org/10.1371/journal.pone.0078101 [PubMed]
- 35. Mu Y, Yan X, Li D, Zhao D, Wang L, Wang X, Gao D, Yang J, Zhang H, Li Y, Sun Y, Wei Y, Zhang Z, et al. NUPR1 maintains autolysosomal efflux by activating SNAP25 transcription in cancer cells. Autophagy. 2018; 14:654–70. https://doi.org/10.1080/15548627.2017.1338556 [PubMed]
- 36. Bratland A, Risberg K, Maelandsmo GM, Gützkow KB, Olsen OE, Moghaddam A, Wang MY, Hansen CM, Blomhoff HK, Berg JP, Fodstad O, Ree AH. Expression of a novel factor, com1, is regulated by 1,25-dihydroxyvitamin D3 in breast cancer cells. Cancer Res. 2000; 60:5578–83. [PubMed]
- 37. Santofimia-Castaño P, Xia Y, Peng L, Velázquez-Campoy A, Abián O, Lan W, Lomberk G, Urrutia R, Rizzuti B, Soubeyran P, Neira JL, Iovanna J. Targeting the Stress-Induced Protein NUPR1 to Treat Pancreatic Adenocarcinoma. Cells. 2019; 8:1453. https://doi.org/10.3390/cells8111453 [PubMed]
- 38. Schnepp PM, Shelley G, Dai J, Wakim N, Jiang H, Mizokami A, Keller ET. Single-Cell Transcriptomics Analysis Identifies Nuclear Protein 1 as a Regulator of Docetaxel Resistance in Prostate Cancer Cells. Mol Cancer Res. 2020; 18:1290–301. https://doi.org/10.1158/1541-7786.MCR-20-0051 [PubMed]
- 39. Wang L, Jiang F, Xia X, Zhang B. LncRNA FAL1 promotes carcinogenesis by regulation of miR-637/NUPR1 pathway in colorectal cancer. Int J Biochem Cell Biol. 2019; 106:46–56. https://doi.org/10.1016/j.biocel.2018.09.015 [PubMed]
- 40. Li J, Lian ZG, Xu YH, Liu RY, Wei ZQ, Li T, Lv HT, Zhao YS, Liu YJ, Dong B, Fu X. Downregulation of nuclear protein-1 induces cell cycle arrest in G0/G1 phase in glioma cells in vivo and in vitro via P27. Neoplasma. 2020; 67:843–50. https://doi.org/10.4149/neo_2020_190814N759 [PubMed]
- 41. Palam LR, Gore J, Craven KE, Wilson JL, Korc M. Integrated stress response is critical for gemcitabine resistance in pancreatic ductal adenocarcinoma. Cell Death Dis. 2015; 6:e1913. https://doi.org/10.1038/cddis.2015.264 [PubMed]
- 42. Emma MR, Iovanna JL, Bachvarov D, Puleio R, Loria GR, Augello G, Candido S, Libra M, Gulino A, Cancila V, McCubrey JA, Montalto G, Cervello M. NUPR1, a new target in liver cancer: implication in controlling cell growth, migration, invasion and sorafenib resistance. Cell Death Dis. 2016; 7:e2269. https://doi.org/10.1038/cddis.2016.175 [PubMed]
- 43. Escudier B, Eisen T, Stadler WM, Szczylik C, Oudard S, Siebels M, Negrier S, Chevreau C, Solska E, Desai AA, Rolland F, Demkow T, Hutson TE, et al, and TARGET Study Group. Sorafenib in advanced clear-cell renal-cell carcinoma. N Engl J Med. 2007; 356:125–34. https://doi.org/10.1056/NEJMoa060655 [PubMed]
- 44. Murphy A, Costa M. Nuclear protein 1 imparts oncogenic potential and chemotherapeutic resistance in cancer. Cancer Lett. 2020; 494:132–41. https://doi.org/10.1016/j.canlet.2020.08.019 [PubMed]
- 45. Greten FR. Cancer: Tumour stem-cell surprises. Nature. 2017; 543:626–27. https://doi.org/10.1038/543626a [PubMed]
- 46. Berasain C. Hepatocellular carcinoma and sorafenib: too many resistance mechanisms? Gut. 2013; 62:1674–75. https://doi.org/10.1136/gutjnl-2013-304564 [PubMed]
- 47. Xin HW, Ambe CM, Hari DM, Wiegand GW, Miller TC, Chen JQ, Anderson AJ, Ray S, Mullinax JE, Koizumi T, Langan RC, Burka D, Herrmann MA, et al. Label-retaining liver cancer cells are relatively resistant to sorafenib. Gut. 2013; 62:1777–86. https://doi.org/10.1136/gutjnl-2012-303261 [PubMed]
- 48. Fan C, Zhao C, Wang F, Li S, Wang J. Significance of PTEN Mutation in Cellular Process, Prognosis, and Drug Selection in Clear Cell Renal Cell Carcinoma. Front Oncol. 2019; 9:357. https://doi.org/10.3389/fonc.2019.00357 [PubMed]
- 49. Makhov PB, Golovine K, Kutikov A, Teper E, Canter DJ, Simhan J, Uzzo RG, Kolenko VM. Modulation of Akt/mTOR signaling overcomes sunitinib resistance in renal and prostate cancer cells. Mol Cancer Ther. 2012; 11:1510–17. https://doi.org/10.1158/1535-7163.MCT-11-0907 [PubMed]
- 50. Lan W, Santofimia-Castaño P, Xia Y, Zhou Z, Huang C, Fraunhoffer N, Barea D, Cervello M, Giannitrapani L, Montalto G, Peng L, Iovanna J. Targeting NUPR1 with the small compound ZZW-115 is an efficient strategy to treat hepatocellular carcinoma. Cancer Lett. 2020; 486:8–17. https://doi.org/10.1016/j.canlet.2020.04.024 [PubMed]