Expression and methylation level of FGFR3 in different cancer types
FGFR3 abnormal expression has been observed in various cancer types [22, 23]. In this work, we provided a more comprehensive analysis of FGFR3 expression. First of all, we explored the expression pattern of FGFR3 among different types of normal tissues by the GTEx portal. FGFR3 expression exhibited a broad spectrum across different tissues. FGFR3 showed the highest expression in the skin and almost no expression in the EBV-transformed lymphocytes (Supplementary Figure 1). Next, FGFR3 expression was compared across 32 TCGA cancer types (Supplementary Table 1). As shown in Supplementary Figure 2A, FGFR3 expression across different cancers was dramatically different, indicating that high FGFR3-expressing cancers may have some genetic features that lead to the increased FGFR3 expression. According to the interquartile range, FGFR3 expression spread varied in several cancers more than others, for example, skin cutaneous melanoma (SKCM) had a wide spread while testicular germ cell tumors (TGCT) had a narrow spread, which may be on account of some cancer types including several subtypes and thus having more genetic diversity (Supplementary Figure 2A). Moreover, we evaluated the expression difference of FGFR3 between tumors and the corresponding normal tissues profiled in TCGA. As shown in Figure 1A, significantly differential expression of FGFR3 was observed in 16 tumor types, with 10 tumor types upregulated [breast invasive carcinoma (BRCA), cervical squamous cell carcinoma and endocervical adenocarcinoma (CESC), cholangiocarcinoma (CHOL), esophageal carcinoma (ESCA), head and neck squamous cell carcinoma (HNSC-HPV), LICH, LUSC, SKCM, stomach adenocarcinoma (STAD), thyroid carcinoma (THCA)] and 6 tumor types downregulated [colon adenocarcinoma (COAD), GBM, kidney chromophobe (KICH), kidney renal clear cell carcinoma (KIRC), kidney renal papillary cell carcinoma (KIRP), LUAD]. After adding GTEx normal tissues as control, we further compared FGFR3 expression difference between the normal tissues and tumors of adrenocortical carcinoma (ACC), lymphoid neoplasm diffuse large B-cell lymphoma (DLBC), acute myeloid leukemia (LAML), LGG, ovarian serous cystadenocarcinoma (OV), sarcoma (SARC), TGCT, thymoma (THYM), and uterine carcinosarcoma (UCS). Upregulated expression of FGFR3 was observed in 4 cancer types (OV, TGCT, THYM, and UCS) and downregulated expression of FGFR3 was observed in 2 cancer types (LAML and LGG) (Figure 1B, Supplementary Figure 3A). Furthermore, we explored the correlation between FGFR3 expression and the tumor pathological stages by the GEPIA2 approach. It was found that FGFR3 expression was correlated with tumor pathological stages in several cancer types, including BLCA, KICH, KIRC, LUAD, SKCM, and uterine corpus endometrial carcinoma (UCEC) (Figure 1C, all P < 0.05). However, no correlation was found in the remaining cancer types (Supplementary Figure 3B–3F, all P > 0.05).
![Fibroblast growth factor receptor 3 (FGFR3) mRNA expression and DNA methylation in The Cancer Genome Atlas (TCGA) tumor tissues. (A) The mRNA expression of FGFR3 in different cancers or specific cancer subtypes from TIMER2. The log2 [TPM (Transcripts per million)] was applied for log-scale. (B) For LAML, LGG, OV, TGCT, THYM, and UCS from the TCGA project, their corresponding normal tissues of the GTEx database were included as controls based on the GEPIA2 portal. The log2 (TPM +1) was applied for log-scale. (C) FGFR3 mRNA expression levels were analyzed by the main pathological stages of BLCA, KICH, KIRC, LUAD, SKCM, and UCEC. The log2 (TPM +1) was applied for log-scale. (D) Bubble map showing the differential methylation of FGFR3 and its downstream genes between tumors and matched normal samples. Blue dots, downregulated methylation in tumors. Red dots, upregulated methylation in tumors. (E) Bubble map depicting the relative methylation and expression differences of FGFR3 and its downstream genes between tumors and matched normal samples by size and color, respectively. Blue dots, upregulation in methylation level but downregulation in expression level. Red dots, upregulation in both methylation and expression levels of indicated genes. *P **P ***P](/article/203175/figure/f1/large)
Figure 1. Fibroblast growth factor receptor 3 (FGFR3) mRNA expression and DNA methylation in The Cancer Genome Atlas (TCGA) tumor tissues. (A) The mRNA expression of FGFR3 in different cancers or specific cancer subtypes from TIMER2. The log2 [TPM (Transcripts per million)] was applied for log-scale. (B) For LAML, LGG, OV, TGCT, THYM, and UCS from the TCGA project, their corresponding normal tissues of the GTEx database were included as controls based on the GEPIA2 portal. The log2 (TPM +1) was applied for log-scale. (C) FGFR3 mRNA expression levels were analyzed by the main pathological stages of BLCA, KICH, KIRC, LUAD, SKCM, and UCEC. The log2 (TPM +1) was applied for log-scale. (D) Bubble map showing the differential methylation of FGFR3 and its downstream genes between tumors and matched normal samples. Blue dots, downregulated methylation in tumors. Red dots, upregulated methylation in tumors. (E) Bubble map depicting the relative methylation and expression differences of FGFR3 and its downstream genes between tumors and matched normal samples by size and color, respectively. Blue dots, upregulation in methylation level but downregulation in expression level. Red dots, upregulation in both methylation and expression levels of indicated genes. *P < 0.05; **P < 0.01; ***P < 0.001.
DNA methylation was reported to be strongly associated with the change of gene expression in tumors [24, 25]. Therefore, we applied the GSCALite approach to explore the methylation status of FGFR3 and its downstream genes in various cancer types of TCGA. As shown in Figure 1D, up-regulated methylation of FGFR3 was observed in KIRC, KIRP, HNSC, UCEC, and LUAD, while down-regulated methylation of FGFR3 was found in BLCA, BRCA, and LUSC. In addition, the expression of FGFR3 and its downstream genes were found to be most negatively correlated with FGFR3 methylation status, with only a few positive correlations (Figure 1D).
FGFR3 somatic mutation patterns in different cancer types
The total mutation frequency of FGFR3 was 2.13% for all cancer samples (234/10,967) across various cancer types of TCGA. The tumor sample number from different cancer types varied from 36 (CHOL) to 1,084 (BRCA) (Supplementary Table 2). Those cancer types with too few samples such as CHOL might not represent the full landscape of FGFR3 mutation status. Moreover, as shown in Figure 2A, BLCA (18.5%), SKCM (4.9%), and UCEC (4.5%) were the most common cancer types with FGFR3 mutations. On the contrary, almost no FGFR3 mutations were observed in ACC, CHOL, DLBC, KICH, pheochromocytoma and paraganglioma (PCPG), TGCT, THCA, THYM, and uveal Melanoma (UVM).
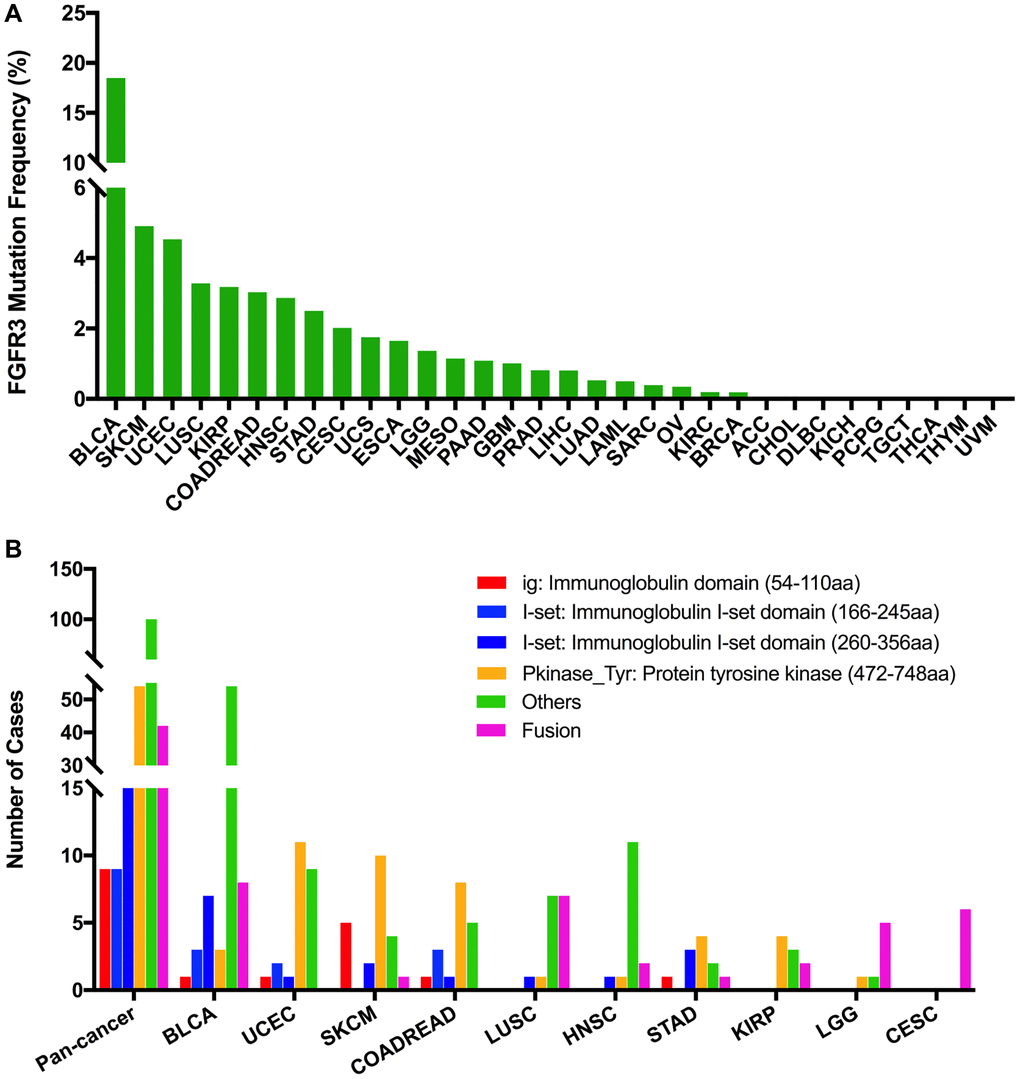
Figure 2. FGFR3 mutation distribution in different cancer types of TCGA and protein functional domains. (A) The mutation frequency of FGFR3 across various tumor types. (B) FGFR3 mutation distribution in different protein functional domains in all and top ten tumor types. Abbreviation: aa: amino acid.
We observed 234 FGFR3 somatic mutations across 32 TCGA cancers, among these mutations, 42 FGFR3 mutations belonged to fusion. As shown in Figure 3, fusion transcripts of FGFR3 were observed in BLCA (8), LUSC (7), CESC (6), LGG (5), GBM (3), ESCA (2), KIRP (2), liver hepatocellular carcinoma (LIHC) (2), HNSC (2), STAD (1), prostate adenocarcinoma (PRAD) (1), OV (1), SKCM (1), ACC (1). The highest number of fusion transcripts was found in BLCA (eight FGFR3_TACC3), followed by LUSC (six FGFR3_TACC3, one TACC3_FGFR3), CESC (five FGFR3_TACC3, one TACC3_FGFR3), and LGG (two FGFR3_TACC3, one TACC3_FGFR3, one FGFR3_ELAVL3, one FGFR3_FBXO28). FGFR3_TACC3 was the most common fusion transcripts of FGFR3 (32/42) and distributed in different cancer types [BLCA (8), LUSC (6), CESC (5), ESCA (2), LGG (2), HNSC (2), KIRP (2), LIHC (2), GBM (1), STAD (1), ACC (1)]. TACC3 is a tumor-associated protein that has been found to play critical roles in the development of various cancer types, such as ovarian cancer, hepatocellular carcinoma, glioblastoma, and so on. It was also involved in several crucial cellular events, like cell differentiation, growth, transcriptional regulation, and the regulation of centrosome and microtubule [26]. Most fusion transcripts of FGFR3 were classified as the in-frame, while three FGFR3_TACC3 (one BLCA, one LUSC, one LIHC) were classified as the out-of-frame.
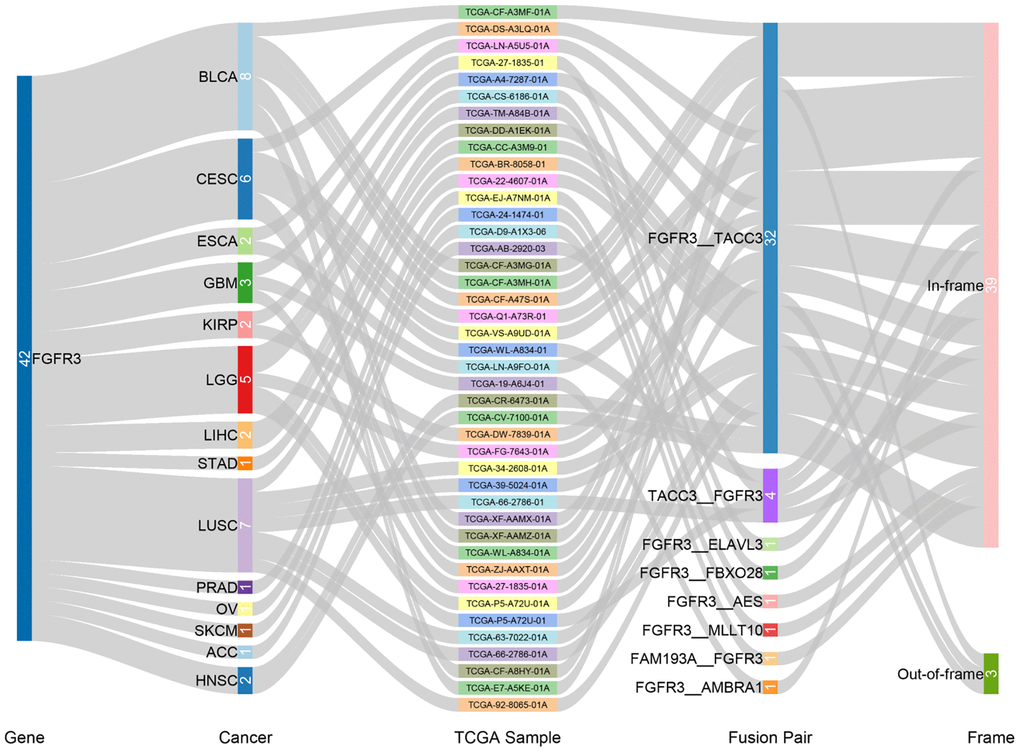
Figure 3. Fusion gene of FGFR3 across 32 TCGA tumor types.
FGFR3 was found to have four functional domains based on the Pfam database, containing the PKinase_Tyr domain (472–748 aa), I-set domain (260–356 aa), I-set domain (166–245 aa), and ig domain (54–110 aa). In this analysis, 234 FGFR3 mutations were detected in various cancer types of TCGA and distributed across different FGFR3 functional domains. As shown in Figure 2B, the other domain whose function was barely known was the most frequently mutated domain of FGFR3 (100 samples), followed by the Pkinase_Tyr domain (54 samples), the I-set (260–356 aa, 20 samples), the I-set (166–245 aa, 9 samples), and the ig domain (9 samples). Moreover, the location distribution of FGFR3 mutations differed greatly across different TCGA cancers. Mutations in UCEC, SKCM, colon adenocarcinoma/rectum adenocarcinoma (COADREAD), STAD, and KIRP were most commonly distributed in the Pkinase_Tyr domain. Mutations in BLCA and HNSC were primarily located in the other domain and amounted to around two-thirds of all FGFR3 mutations. Mutations in LGG and CESC were mainly fusion, especially for CESC, fusion was the only mutation type in this cancer type. In LUSC, fusion and mutations in the other domain were equally common (Figure 2B and Supplementary Table 3).
The 234 FGFR3 mutations mentioned above were classified into three categories based on mutation functional impact on FGFR3 protein coding, including missense mutations (177 samples), fusion (42 samples), and truncating mutations (15 samples). The most common mutation positions of FGFR3 were S249C (41 samples) and Y373C (11 samples), both of which were located in the other domain. Mutations at S249C were most observed in BLCA samples which were amounted to nearly three-quarters of all mutations in this position (32/41). The S249C was an FGFR3 hotspot mutation and known to be oncogenic. Patients with metastatic urothelial tumor carrying S249C mutation could be treated with the pan-FGFR targeted inhibitor, erdafitinib, which was approved by Food and Drug Administration (FDA) [27, 28]. The other cancer types carrying S249C mutation were HNSC (4 samples), LUSC (4 samples), and KIRP (one sample). However, different from that in BLCA, the clinical utility of targeted drugs in these three cancer types with S249C mutation was still unknown. Similarly, BLCA harbored the largest proportion of mutations at Y373C (8/11), followed by KIRP (two samples) and UCEC (one sample). BLCA with a mutation at this position could be also treated with the FDA-approved erdafitinib (Supplementary Figure 4A) [27, 28]. Moreover, as shown in Figure 2A and Supplementary Figure 4B, BLCA had the highest frequency of FGFR3 mutational alterations. S249C was most common among BLCA mutation samples (32 samples), followed by Y373C (8 samples), G370C (5 samples), and R248C (3 samples). All these four mutation positions of FGFR3 were oncogenic and were FDA recognized biomarker predictive of response to an FDA-approved drug, such as erdafitinib [27, 28]. For mutations at K650E (two samples), S371C (two samples), and G380R (two samples) in BLCA, there was promising clinical evidence that supported these mutation positions as being predictive of response to pan-FGFR-targeted inhibitors such as Debio1347, BGJ398, AZD4547, and erdafitinib [27, 29–33]. Furthermore, in UCEC, the most mutated positions were in the Pkinase_Tyr domain. Mutation at Y373H in UCEC was considered likely oncogenic, and several laboratory data suggested that tumor cells with Y373H mutation may be sensitive to some selective FGFR-targeted inhibitors (Supplementary Figure 4C) [28, 34–36].
The 234 FGFR3 mutations were divided into five classes based on their predictive significance and oncogenic effect, including unknown (113 mutations), oncogenic (94 mutations), likely oncogenic (22 mutations), predicted oncogenic (1 mutation), and likely neutral (4 mutations). As shown in Figure 4A, nearly half of FGFR3 somatic mutations were distributed in the unknown class, indicating that more research needs to be conducted to explore the role of these mutations. However, mutations that were distributed in the functional classes took up a major portion of FGFR3 mutations in several cancers such as BLCA, LUSC, HNSC, KIRP, and CESC. In BLCA and LUSC, about two-thirds of mutations belonged to the oncogenic class (53/76, 11/16, respectively), and the other mutation that was distributed in the functional class was likely oncogenic (nine mutations, one mutation, respectively). In CESC, all somatic mutations of FGFR3 belonged to oncogenic (Figure 4B).
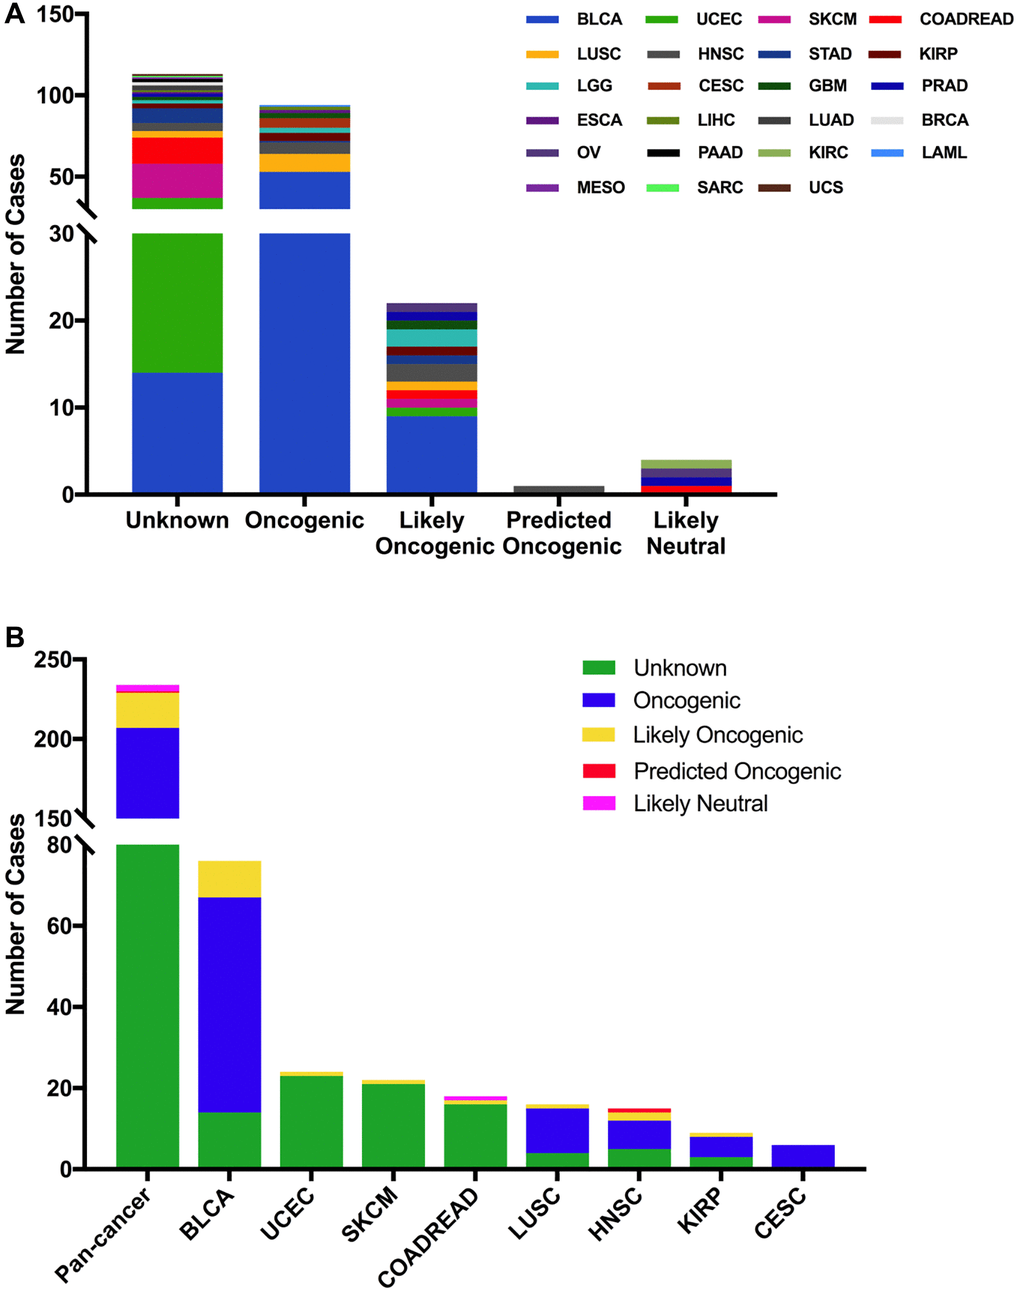
Figure 4. FGFR3 mutation classification based on the functional impact on protein coding. (A) FGFR3 mutations were categorized according to the functional impacts on all tumors together. (B) Functional impact category distribution of FGFR3 mutations in pan-cancer and the top eight tumor types.
Then we used the cBioPortal approach to analyze the clinical targeted therapy application potential of FGFR3 somatic mutations. The 234 FGFR3 mutations were classified as five levels which were defined by OncoKB [37], containing level NA (118 mutations), level 4 (four mutations), level 3B (50 mutations), level 3A (six mutations), and level 1 (56 mutations). Approximately half of the FGFR3 mutations were classified as level NA which represented no targeted therapy implication, indicating that more work was needed to improve the status of the current targeted treatment (Figure 5A). All level 1 mutations were found in BLCA, which accounted for nearly two-thirds of FGFR3 mutations. Most of these level 1 mutations were S249C, and the remaining mutations were Y373C, G370C, and R248C. BLCA patients with these level 1 mutations were suitable for targeted treatment with an FDA-approved medicine [16]. Meanwhile, there were six mutations in BLCA that belonged to level 3A, which represented that there was promising clinical evidence that supported these level 3A mutations as being predictive of response to targeted therapy. Furthermore, level 3B mutations were distributed in several cancer types such as LUSC, HNSC, KIRP, LGG, and CESC (Figure 5B).
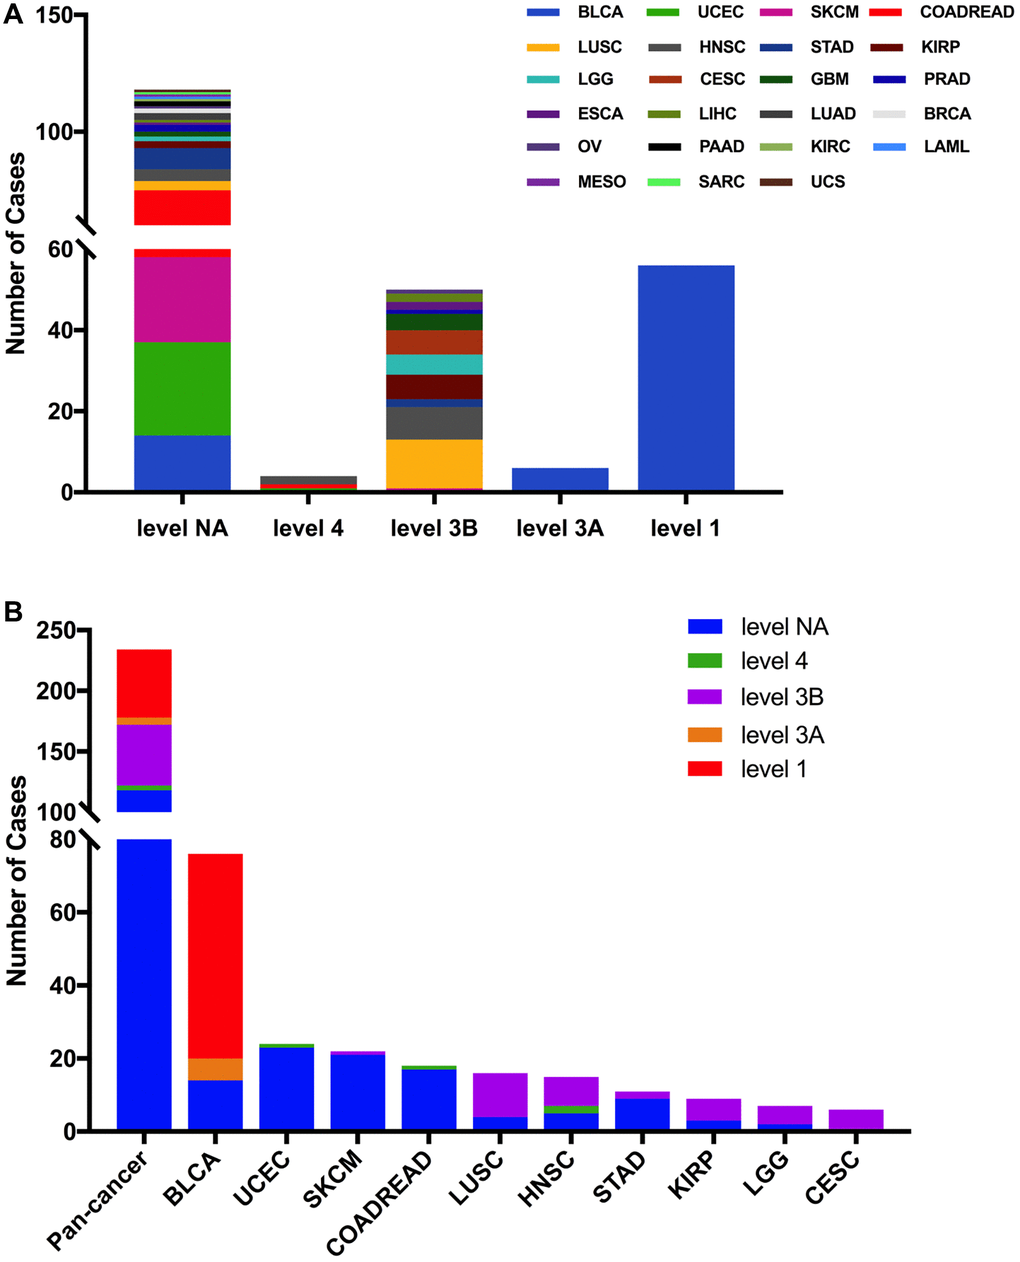
Figure 5. FGFR3 mutation classification according to clinical therapeutic implications. (A) FGFR3 mutations were classified according to the therapeutic implications defined by OncoKB among all tumors together. (B) Therapeutic implications class distribution of FGFR3 mutations in pan-cancer and the top ten tumor types.
FGFR3 CNVs across cancer types
Here, we explored the CNVs of FGFR3 in different cancer types. The overall CNV frequency of FGFR3 was about 34.5% (3784/10,967 samples). The most common CNV type of FGFR3 was shallow deletion (2625 samples), then gain (1000 samples), amplification (120 samples), and deep deletion (39 samples). Most of the amplification were mainly detected in UCS, OV, and BLCA, while most of the deep deletion was found in ESCA, HNSC, CESC, and BRCA (Figure 6A). The most common cancer types with FGFR3 CNVs were UCS (78.9%), LUSC (69.2%), ESCA (68.7%), OV (66.5%), and TGCT (65.1%). On the contrary, THCA (1.6%), LAML (3.0%), THYM (6.5%), DLBC (8.3%), and PCPG (9.0%) had very low CNV frequency of FGFR3 (Figure 6A). Next, we analyzed the correlation between FGFR3 CNVS and its mRNA expression. As shown in Supplementary Figure 2B, there was no significate correlation was found between FGFR3 CNVs and its mRNA expression across different cancer types (r = 0.0127, p = 0.2052), suggesting that some other genetic alterations may lead to FGFR3 expression. Mesothelioma (MESO) and DLBC had a relatively high proportion of shallow deletion and were also the tumor type with relatively lower FGFR3 expression. However, KICH and ACC who harbored a relatively high proportion of gain showed a lower expression of FGFR3. Similarly, TGCT, HNSC, CESC, and LUSC had a higher proportion of shallow deletion but was the cancer types with relatively higher expression of FGFR3 (Figure 6A, Supplementary Figure 2A). Furthermore, as shown in Figure 6B, among the 234 samples with FGFR3 mutations described above, 81 samples had FGFR3 CNVs at the same time, of which 32 samples had shallow deletions, 26 samples had gains, 22 samples had amplifications, and one sample had deep deletion. BLCA harbored the highest number of amplification and gain across different cancer types. LUSC and BLCA had the same number and also the highest number of shallow deletions (Figure 6B, Supplementary Table 2).
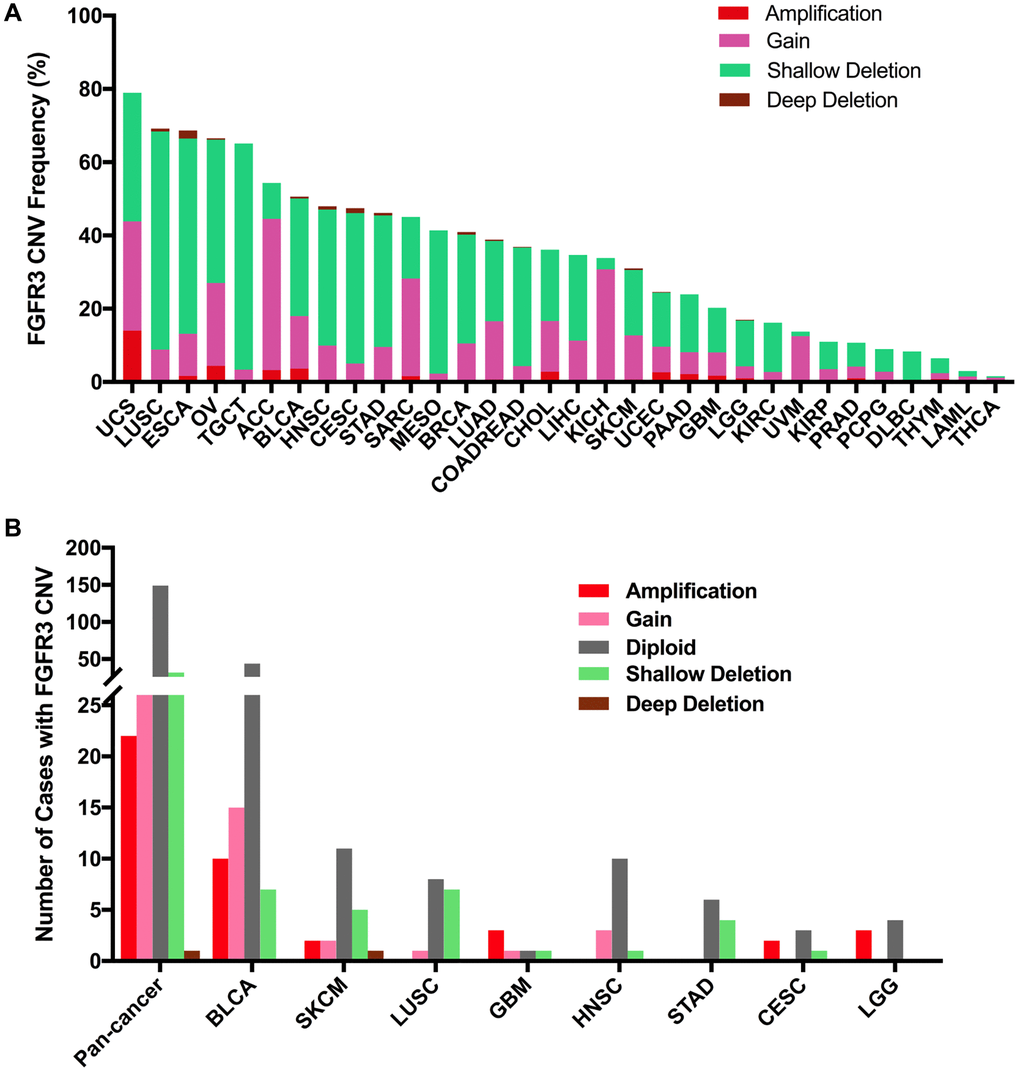
Figure 6. Pan-cancer analysis of FGFR3 Copy Number Variant (CNV). (A) The CNV frequency of FGFR3 across various tumor types. (B) FGFR3 CNV distribution in pan-cancer and the top eight tumors for the cases with FGFR3 mutations simultaneously.
Combined FGFR3 alterations (CNVs and mutation) across cancer types
Here, we further analyzed the combined alterations of FGFR3 including mutation and CNVs across different cancer types. The overall alteration frequency of FGFR3 was about 3.2% (detected in 351 of 10,967 samples). As shown in Figure 7A, FGFR3 alterations across different cancer types were quite different. BLCA (18.73%) harbored the most frequency of FGFR3 alterations in which mutation took up a major portion. Other cancers that had dominant FGFR3 mutations but were at relative lower alteration frequency contained UCEC (6.81%), SKCM (5.18%), STAD (3.64%), HNSC (3.63%), COADREAD (3.37%), KIRP (2.47%) and MESO (1.38%). UCS (15.79%) had the second most frequency of FGFR3 alterations with dominant FGFR3 amplification. Similar alteration pattern which was dominant amplification but relatively few mutation was observed in some cancer types such as OV, ACC, CHOL, pancreatic adenocarcinoma (PAAD), GBM, SARC (4.3 vs 0.2%, 3.3 vs 0.0%, 2.8 vs 0.0%, 2.2 vs 0.5%, 1.4 vs 0.5%, 1.6 vs 0.4%, respectively). Fusion was more common in BLCA (1.7%), CESC (1.35%), LUSC (1.23%), and ESCA (1.1%). Deep deletion was mainly distributed in ESCA (2.2%), CESC (1.35%), HNSC (0.96%), LUSC (0.82%), and BRCA (0.74%). Some tumors harbored neither mutations nor CNVs of FGFR3 such as DLBC, KICH, TGCT, and UVM.
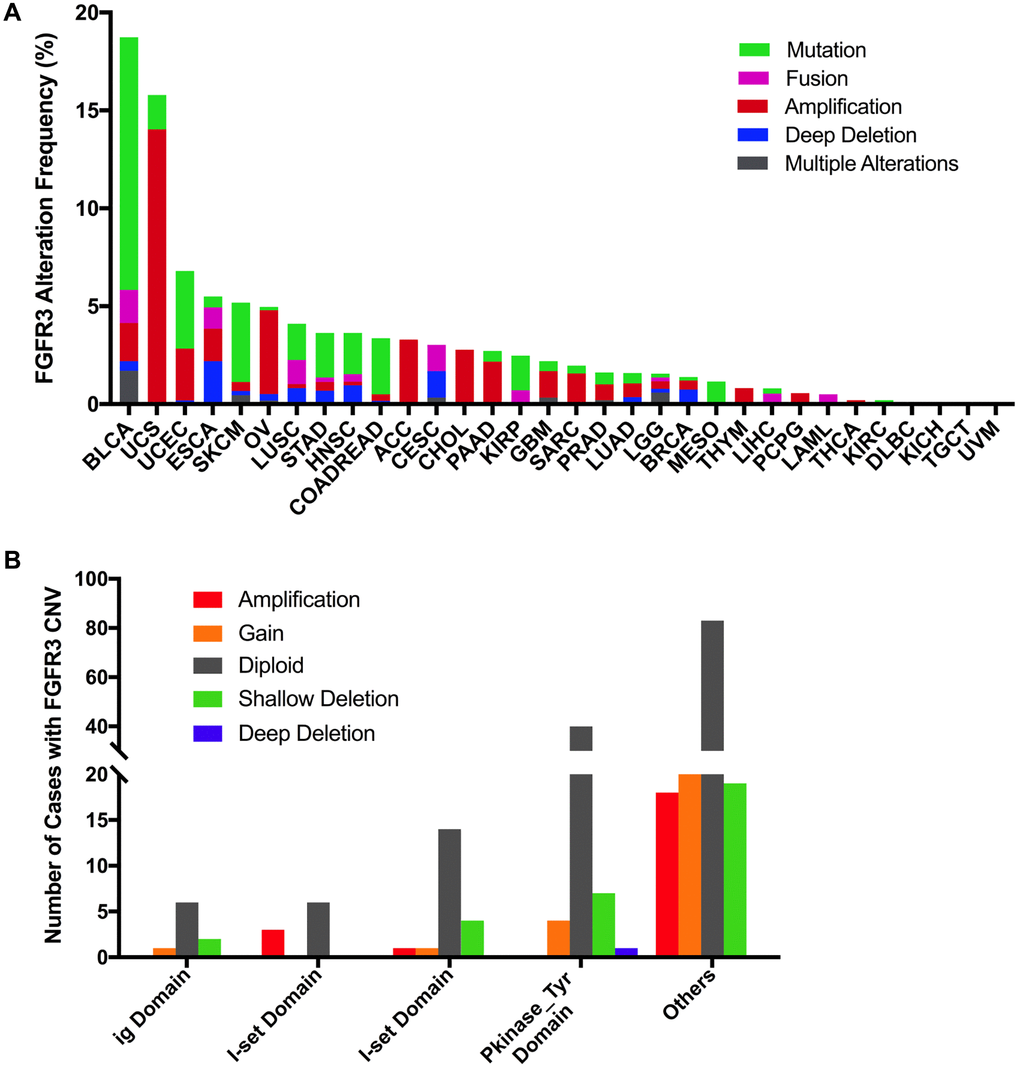
Figure 7. Pan-cancer analysis of FGFR3 alterations and distribution. (A) The alteration (mutation and CNVs) frequency of FGFR3 across various tumor types. (B) The distribution of CNV cases along with mutations located in protein functional domains.
Next, we found that mutation location and CNV occurrence of FGFR3 were correlated. As we mentioned above, 234 FGFR3 mutations across 32 TCGA cancers were detected in this analysis. Interestingly, we further found that nearly two-fifths of FGFR3 mutations in the other function-unknown domain were accompanied by shallow deletion, gain, and amplification (57 of 140 mutations). Approximately one-third of FGFR3 mutations in the ig domain, I-set domain (166–245 aa), or I-set domain (260–356 aa) harbored shallow deletion, gain, and amplification (3 of 9 mutations, 3 of 9 mutations, 6 of 20 mutations, respectively). About one-fifth of FGFR3 mutations in the Pkinase_Tyr domain were accompanied by deep deletion, shallow deletion, gain, and amplification (12 of 52 mutations) (Figure 7B).