


Introduction
Breast cancer (BC) is the most common malignancy in female patients worldwide. According to the latest report of the World Health Organization’s International Agency for Research on Cancer, approximately 2.7 million women were diagnosed with BC and approximately 42, 170 patients died from the disease in the United States in 2020 [1, 2]. Although the overall survival rate has greatly improved over the past decades, most of BC-related deaths are still caused by tumor relapse with or without metastatic progression [3]. BC is a heterogeneous disease, and routine diagnosis and treatment often fail to achieve good effect in some patients. Hence, novel and more reliable molecular biomarkers for diagnosis, treatment, and, prediction of the prognosis of patients with BC are urgently required.
Autophagy is an intracellular evolutionarily conserved catabolic degradation process that maintains cellular homeostasis by degrading senescent organelles and proteins. Studies have shown that autophagy affects the development of multiple cancers, either by recycling biosynthetic components to stimulate tumor growth (especially at advanced stages), or by triggering apoptosis to destroy cancerous or pre-cancerous cells [4–6]. Notably, autophagy can also affect the relationship between normal and tumor cells by alleviating cellular stress and suppressing antitumor immune responses [7]. Hence, in many cancers autophagy is closely correlated with drug resistance, tumor metastasis, and patient prognosis [8, 9].
Postoperative prognosis is traditionally based on the tumor-node-metastasis (TNM) staging system, a paradigm based on tumor size, depth of invasion, number of metastatic lymph nodes, and presence of distant metastasis. This system represents an excellent common language in the field of BC, but excludes prognostic factors such as age, Ki67 status, or expression of tumor-specific molecular markers. Therefore, comprehensive risk-stratified tools involving treatment selection and demographic factors should be created for BC. There is no information on the prognostic value of autophagy-related genes (ARGs) in patients with BC. Therefore, we used bioinformatics to identify candidate ARGs and construct a novel molecular-clinicopathological signature for BC recurrence.
Results
Development and validation of an autophagy-related prognostic gene signature for breast cancer
The study design is illustrated in Figure 1A. After the initial selection process, expression data from 303 and 216 breast cancer patients (reported in the GSE25066 and GSE22219 datasets, respectively) were used as the training and validation cohorts, respectively. After matching the mRNA expression data from the Human Autophagy Database’s autophagy gene list, a total of 219 autophagy-related genes (ARGs) were identified in the training cohort. Baseline clinical features of the studied cases are shown in Table 1.
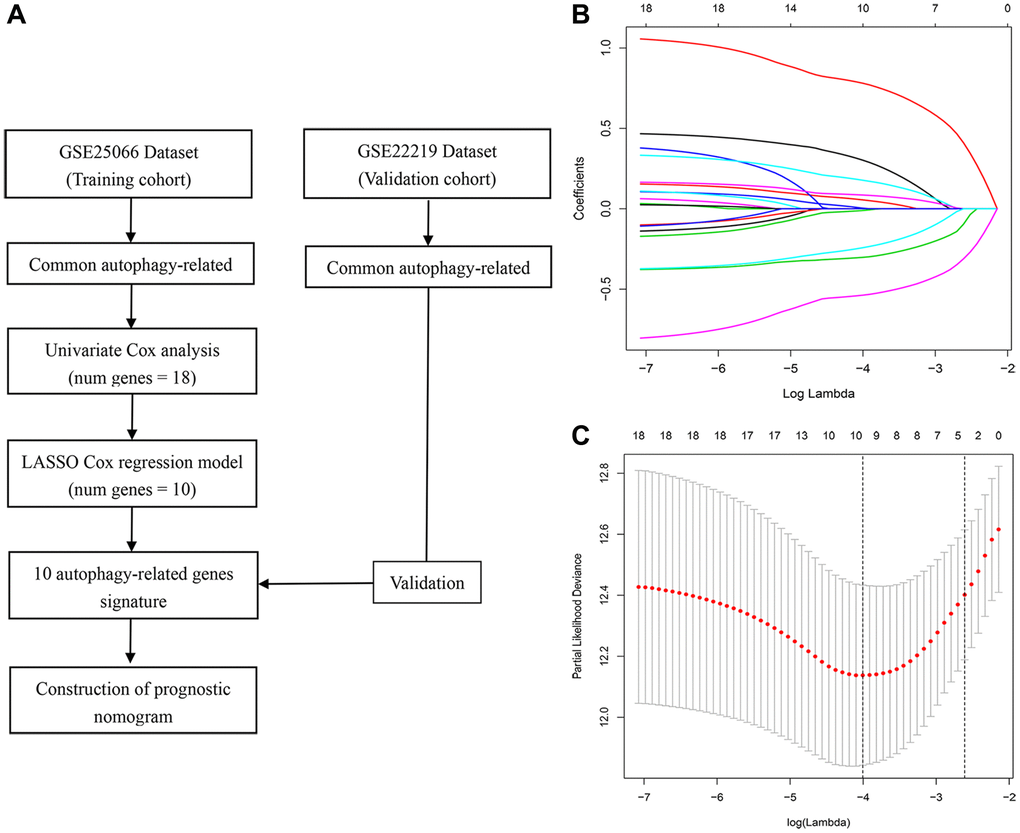
Figure 1. Study workflow and parameter selection. (A) Workflow of the construction and validation of the signature. (B) Ten-time cross-validation for tuning parameter selection in the LASSO Cox regression model. (C) Coefficient profiles of 18 autophagy genes.
Table 1. Baseline characteristics of study patients.
| Variables | Training cohort | Validation cohort |
| No. (%) | No. (%) | |
| No. of patients | 303 | 216 |
| Age (years) | 49 (26–75) | 55 (26–80) |
| ER status | ||
| Negative | 131 (43.2) | / |
| Positive | 172 (56.8) | / |
| PR status | ||
| Negative | 162 (53.5) | 82 (38.0) |
| Positive | 141 (46.5) | 134 (62.0) |
| HER2 status | ||
| Negative | 389 (95.4) | / |
| Positive | 3 (1.00) | / |
| Unknown | 11 (3.6) | / |
| Grade | ||
| I | 19 (6.3) | 41 (19.0) |
| II | 114 (37.6) | 87 (40.3) |
| III | 149 (49.2) | 63 (29.2) |
| Unknown | 21 (6.9) | 25 (11.5) |
| T stage | ||
| T1 | 22 (7.3) | / |
| T2 | 162 (53.5) | / |
| T3 | 71 (23.4) | / |
| T4 | 48 (15.8) | / |
| N stage | ||
| N0 | 86 (28.4) | / |
| N1 | 149 (49.1) | / |
| N2 | 38 (12.5) | / |
| N3 | 30 (1.0) | / |
| Stage | ||
| I | 9 (3.0) | / |
| II | 163 (53.8) | / |
| III | 131 (43.2) | / |
To identify genes related to recurrence-free survival (RFS), univariate Cox analysis was performed on 145 ARGs in the training cohort. We found that 18 ARGs were correlated with RFS (P < 0.05). Then, we performed LASSO Cox regression analysis and identified, among those, 10 recurrence-related genes (ATF4, BAK1, BCL2, BIRC5, CCL2, DDIT3, HIF1A, PRKAB1, RPS6KB1, and TM9SF1). These ARGs were then used to establish a prognostic signature (Figure 1B and 1C). The risk score was defined by computing the products of the mean LASSO β-coefficients by the corresponding expression level for each gene: (0.31532 × expression of ATF4) + (0.05986 × expression of BAK1) + (–0.013523 × expression of BCL2) + (0.183910 × expression of BIRC5) + (0.08745 × expression of CCL2) + (0.789860 × expression of DDIT3) + (0.008910 × expression of HIF1A) + (–0.305302 × expression of PRKAB1) + (0.24959 × expression of RPS6KB1) + (–0.54193 × expression of TM9SF1). We then divided patients into high- and low-score sub-populations and found that the ARG score was negatively related to prognosis in the training cohort (Figure 2). The signature’s risk score showed excellent ability (AUC = 0.815) in predicting breast cancer patients’ survival risk (Figure 2A). To validate the accuracy of the model in predicting OS, individual risk scores were calculated in patients from an independent dataset (GSE2219; validation cohort). This analysis demonstrated that patients in the high-risk group had worse RFS (p < 0.001; AUC = 0.77; Figure 2B). Thus, concordant results were obtained in the training and validation cohorts. Moreover, immunohistochemistry data from the Human Protein Atlas largely confirmed that the signature’s ARGs were dysregulated in BC samples. Specifically, expression levels of ATF4, BAK1, BCL2, CCL2, DDIT3, HIF1A, and RPS6KB1 were higher in BC than in normal breast tissue, whereas the opposite pattern was found for PRKAB1. In contrast, the expression of BIRC5 and TM9SF1 in tumor and normal tissues did not differ (Figure 3).
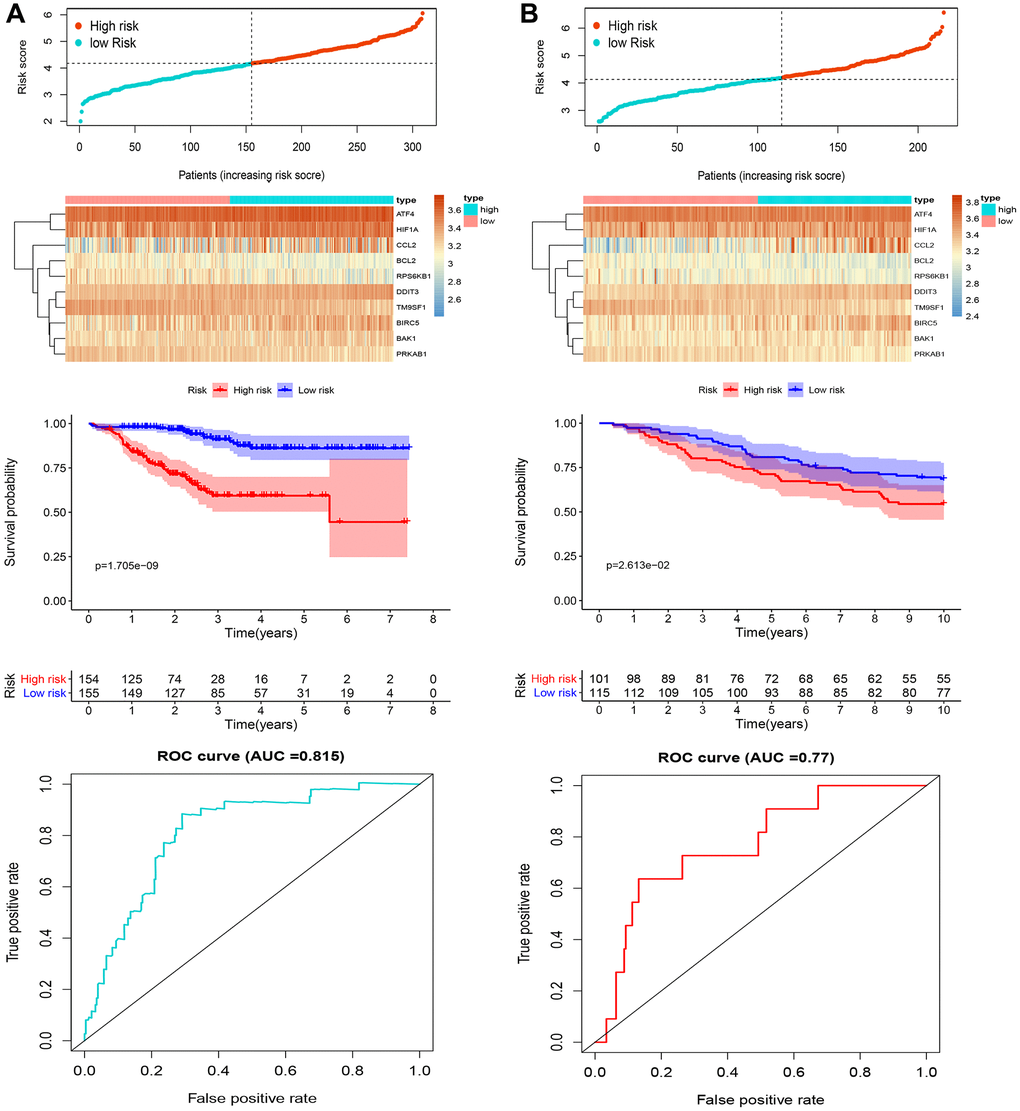
Figure 2. Analysis of candidate ARGs. Distribution of risk score, heatmap representation, Kaplan-Meier survival curves, and ROC curves for the autophagy-related signature in (A) the training cohort and (B) the validation cohort.
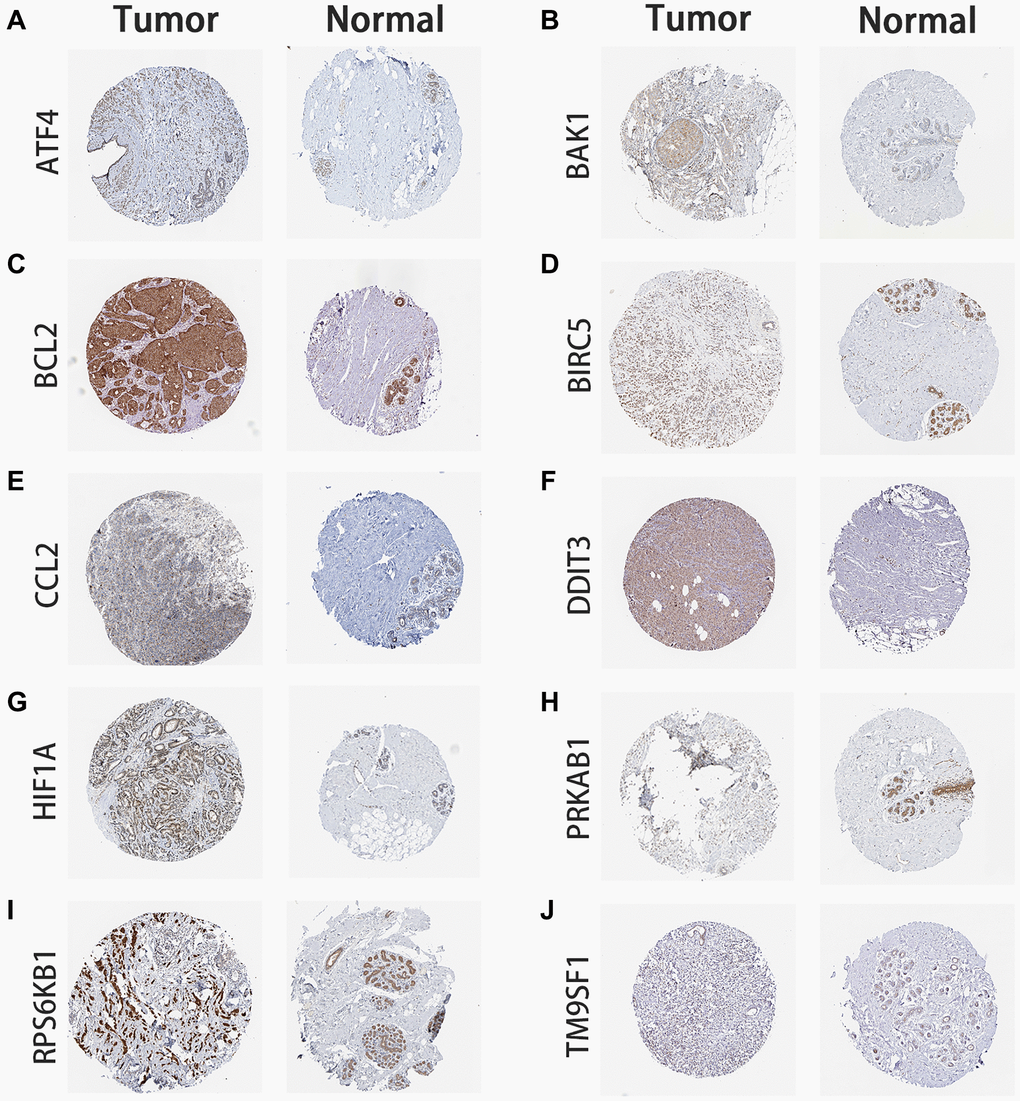
Figure 3. Immunohistochemistry of ARG expression. BC tumor and normal breast tissue images are shown for the signature’s ARG-coded proteins. (A) ATF4 expression. (B) BAK1 expression. (C) BCL2 expression. (D) BIRC5 expression. (E) CCL2 expression. (F) DDIT3 expression. (G) HIF1A expression. (H) PRKAB1 expression. (I) RPS6KB1 expression. (J) TM9SF1 expression. Images were obtained from the Human Protein Atlas database (https://www.proteinatlas.org/).
Comparison with other prognostic signatures
A comparison of our signature with 6 previously published BC prognostic models was next performed (Table 2). Time-dependent ROC curve analysis of our signature’s ability to predict 3- and 5-years RFS yielded AUC values of 0.815 and 0.765, respectively. These values were comparable to those reported for 9-TF [10] and 12-lncRNA [11] signatures, and superior in turn to the AUC values of another four signatures [12–15].
Table 2. The AUC of ROC curve show the sensitivity and specificity of the known signatures in predicting the prognosis of BC patients.
| Author | Year | Gene signature | AUC for RFS |
| Tang et al. | 2019 | 13-miRNA signature | 0.676 (5-year) |
| Chen et al. | 2020 | 9-TF signature | 0.794 (1-year), 0.822 (3-year), 0.843 (5-year) |
| Zhang et al. | 2020 | 10-lncRNA signature | 0.741 (1-year), 0.752 (3-year), 0.781 (5-year) |
| Feng et al. | 2021 | 5-gene metabolic signature | 0.769 (3-year) |
| Zhou et al. | 2016 | 12-lncRNA signature | 0.847 (5-year) |
| Lai et al. | 2019 | 5-miRNA signature | 0.710 (5-year) |
Correlation of the ARG signature with clinicopathological characteristics
Correlation analysis between the signature risk score and seven clinicopathological factors revealed that the signature was not associated with age, but was instead significantly correlated with tumor grade, as well as T and N stage, in BC patients (Figure 4). These data suggest that our ARG signature may reliably predict tumor progression in BC patients.
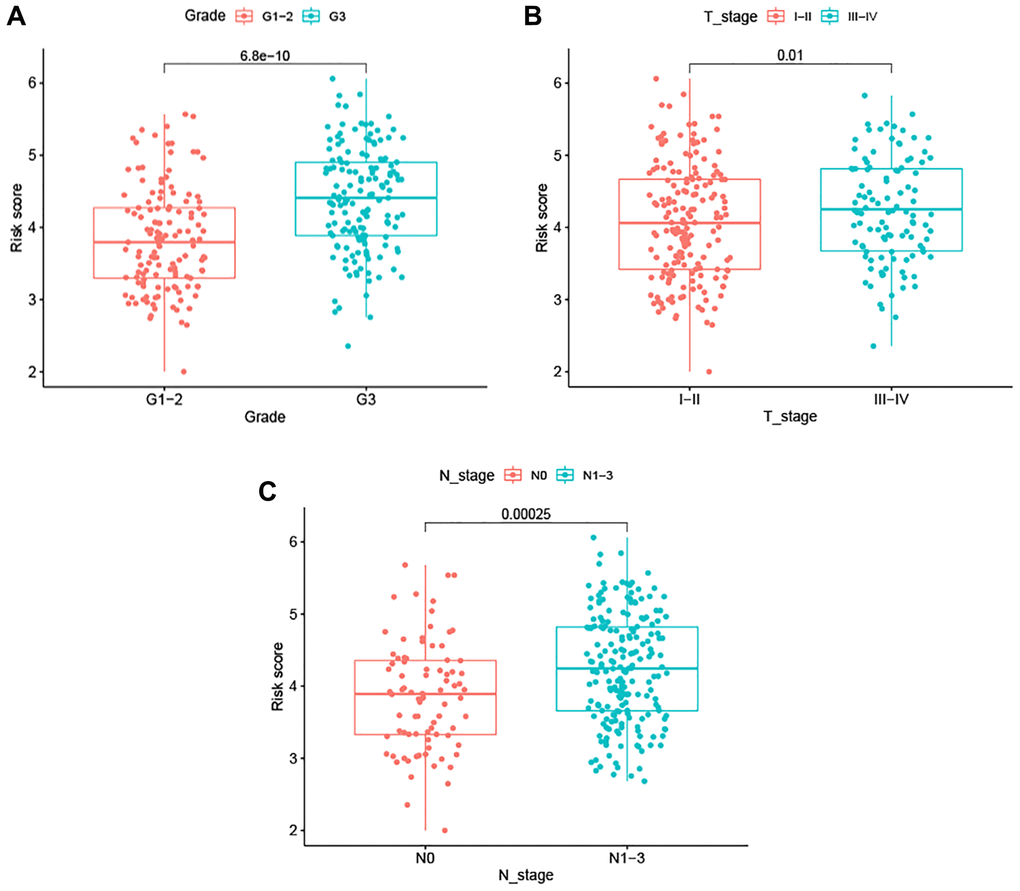
Figure 4. Association between the ARG-based signature and clinicopathological characteristics. (A) Tumor grade. (B) T stage. (C) N stage.
Construction of a predictive nomogram for BC
Univariable Cox regression analyses revealed that risk score, grade, ER status, PR status, and T and N stage were significantly associated with RFS. These 6 variables were next subjected to multivariate Cox regression analysis, from which we constructed a nomogram to predict the RFS of patients by integrating T and N stage data with the risk score of the prognostic signature (Figure 5). By combining the scores associated with each variable and projecting the total score to the bottom scale, the estimated 3-year and 5-year RFS probabilities can be easily calculated. The 3-year and 5-year AUC values of the nomogram were 0.829 and 0.795, respectively (Figure 6A). The ROC curves also indicated that compared with the signature only, the nomogram combining the signature and clinical variables had greater predictive accuracy. Calibration curves were then generated to graphically demonstrate the consistency between nomogram prediction and actual prognosis (Figure 6B).
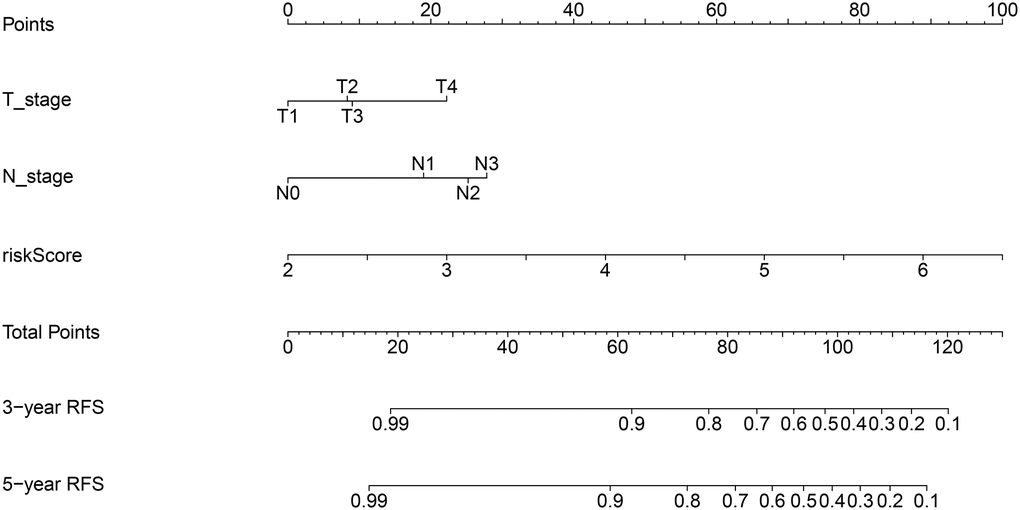
Figure 5. Nomogram for predicting 3- and 5-year RFS of BC patients. The nomogram was constructed by integrating ARG signature’s risk score and patient’s T and N stage data.
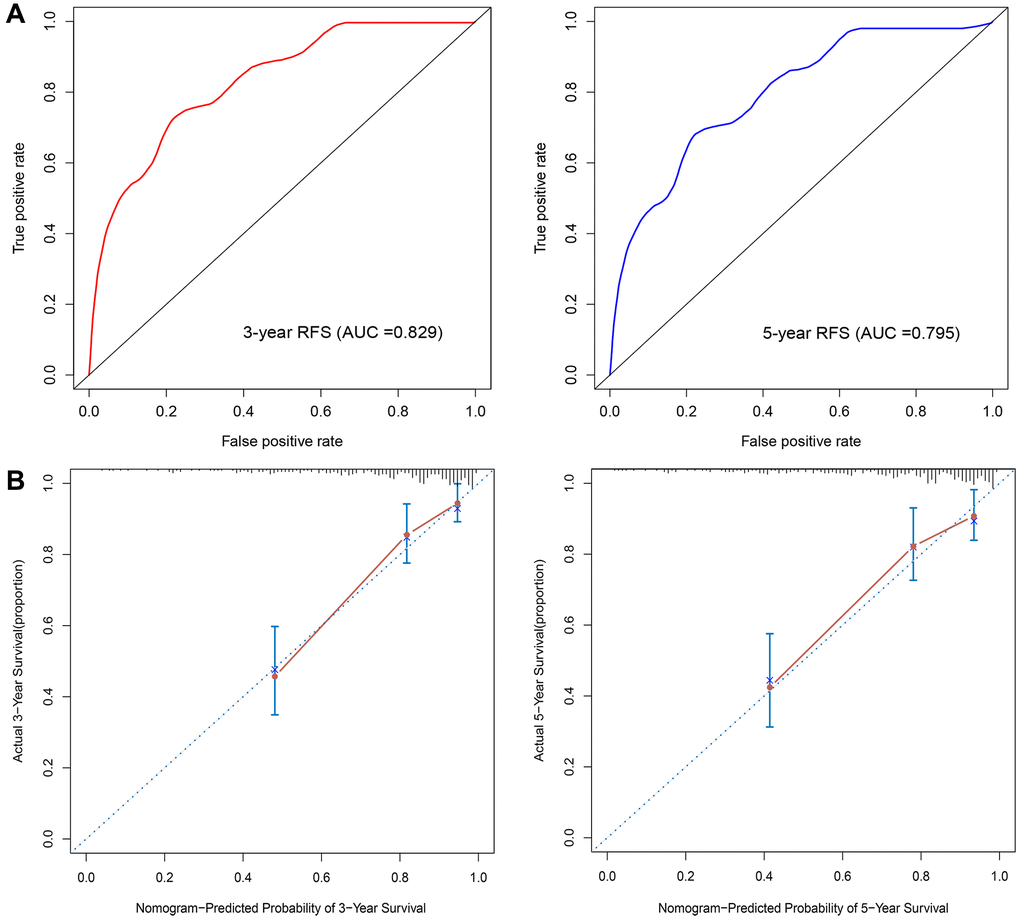
Figure 6. Nomogram validation. (A) Time-dependent ROC analysis. (B) Calibration curves for predicting 3- and 5-year RFS in BC patients.
Discussion
Despite breakthrough advancements in BC treatment, some BC patients still have a poor prognosis, especially when metastasis is detected. Autophagy plays different roles in different stages of tumorigenesis and in response to anti-tumor treatments. Studies have shown that autophagy is induced by almost all conventional BC treatments and is thus considered a target for clinical pharmacological blockade [16–18]. BC is a multifactorial disease that involves the participation of numerous dysregulated ARGs in tumorigenesis and progression. Therefore, a signature model that capitalizes this important information might provide a more accurate and detailed diagnosis and prognosis prediction than single gene-based predictive models.
In the present study, a total of 219 ARGs were identified in BC samples. Based on LASSO Cox analysis, we then established a 10-ARG-based signature to predict BC recurrence and observed significant differences in RFS for high- and low-risk score patients. The flexibility of LASSO Cox regression analysis allows to perform dimensional analyses more effectively, to construct more accurate genetic disease models and to improve the predictive ability of the corresponding molecular signatures [19]. We validated the predictive accuracy of the model in two independent GEO sets and confirmed the reliability of the model in the GSE22219 dataset. Then, a nomogram integrating risk score, T stage, and N stage was established in the training cohort. ROC curves and calibration plots showed excellent predictive ability for the model. By providing a visual, easily interpretable method for predicting individual RFS in BC patients, our novel nomogram may represent a valuable tool to guide individualized BC therapy.
Our BC signature includes 10 autophagy-associated, recurrence-related genes (ATF4, BAK1, BCL2, BIRC5, CCL2, DDIT3, HIF1A, PRKAB1, RPS6KB1, and TM9SF1). Among these, several have been previously investigated in BC. ATF4, a basic region-leucine zipper transcription factor, belongs to the ATF/CREB (activating transcription factor/cyclic AMP response element binding protein) family [20]. ATF4 overexpression was found to be associated with tumorigenesis in a variety of cancers, including BC [20–22]. During the integrated stress response (ISR), ATF4 regulates tumor growth, autophagy, drug resistance, and metastasis through the PERK and GCN2 pathways [23–25]. Milani et al. found that resistance of BC cells to the 26S proteasome inhibitor bortezomib relies on proteasomal stabilization of ATF4, which upregulates LC3B to activate autophagy [26]. Similarly, apoptosis inhibition in paclitaxel-treated BC cells was also shown to result from ATF4-dependent autophagy activation [27]. These results suggest that ATF4 might be a reliable biomarker for poor prognosis in BC and that targeting ATF4-induced autophagy may overcome BC resistance to various chemotherapies. Gao et al. found that ATF4 expression is upregulated in ER-negative BC and its expression is positively correlated with that of PSAT1, an enzyme involved in the serine synthesis pathway. Through in vitro and in vivo experiments, they showed that ATF4 silencing can reduce PSAT1 expression and inhibit cell proliferation and tumorigenesis by blocking GSK3β/β-catenin/cyclin D1 signaling [22]. In turn, Zeng et al. revealed that ATF4 is overexpressed in HER2-positive BC, where it upregulates ZEB1 and inhibits E-cadherin expression to promote cell migration [28].
C-C motif chemokine 2 (CCL2, also known as MCP-1) belongs to the CC chemokine family that recruits monocytes, memory T cells, and dendritic cells to sites of inflammation [29, 30]. Studies have shown that CCL2 in the tumor microenvironment promotes the progression and metastasis of different tumors, including BC [31, 32]. Indeed, CCL2 expression is often increased in BC tissues, and high CCL2 expression is associated with early recurrence and worse prognosis in BC [33, 34]. Fang et al. reported that CCL2 is significantly overexpressed in human luminal B BC specimens, as well as in MMTV-PyVmT and MMTV-Neu transgenic mammary tumors. Overexpression of CCL2 in luminal B cancer cells promoted cell growth and survival by inhibiting necrosis and autophagy [35]. DNA damage-inducible transcript 3 (DDIT3, also known as GADD153, or CHOP) is a member of the CCAAT/enhancer-binding proteins (C/EBPs). DDIT3 is regulated by ATF4 and acts as a multifunctional transcription factor during the ER-stress response [36, 37]. Block et al. indicated that properdin inhibited BC cell growth through testin-mediated DDIT3 upregulation [38]. In turn, Tan et al. revealed that DDIT3 was significantly up-regulated in T-47D breast cancer cells, and its silencing inhibited the formation of ER vacuoles and autophagosomes [39].
In conclusion, we established an ARG signature that can accurately predict RFS in BC patients. In addition, our nomogram combining risk score and clinical parameters can provide visual individualized estimates of potential survival benefits, which may aid the design of patient-tailored therapies. There are some limitations in the current research. Our signature was established using a computational frame, and although our quantitative prognostic model proved to be robust, the mechanisms by which some of the signature genes may modulate BC progression have not yet been elucidated. Therefore, in vitro and in vivo functional experiments are required to verify their biological effects.
Materials and Methods
Dataset acquisition and pre-processing
The GSE25066 and GSE22219 gene expression profiles were acquired from the GEO database (https://www.ncbi.nlm.nih.gov/geo/). The GSE25066 dataset is based on the GPL96 [HG-U133A] Affymetrix Human Genome U133A Array and includes data from 310 breast cancer patients. The GSE22219 microarray dataset is based on the GPL6098 Illumina human Ref-8 v1.0 expression beadchip and contains data from 216 breast cancer patients. The GSE25066 dataset was used as training set and the GSE22219 dataset was used as validation set. The autophagy gene list was obtained from the Human Autophagy Database (HADb, http://autophagy.lu/clustering/index.html). This study did not require ethics approval as all data were downloaded from public databases.
Signature development and validation
Univariate Cox regression analysis was used to select RFS-related genes from the candidate gene list using the “survival” package in R software. Then, LASSO Cox regression analysis was performed to select optimal genes using the “glment”, “survminer”, and “survival” R packages. Thus, a prognostic ARG signature that calculates individual risk scores was developed based on the nonzero coefficients in the LASSO regression model. An autophagy-related signature for RFS was conducted based on expression levels for these genes and their corresponding coefficients (β). The risk score = (βmRNA1 × expression level of mRNA1) + (βmRNA2 × expression level of mRNA2) + (βmRNA3 × expression level of mRNA3) + (βmRNAn × expression level of mRNAn). BC patients were dichotomized into high- and low-risk groups based on the median value of the risk score. Survival outcomes of high- and low-risk score groups were then examined using a Kaplan-Meier survival plot. ROC curves were used to evaluate the performance of the FRG signature. The GSE22219 cohort was used as validation set to examine the versatility and reliability of the signature in a similar way. To validate the signature genes at the protein level, immunohistochemistry (IHC) images of both normal and BC samples were downloaded from the Human Protein Atlas database (https://www.proteinatlas.org/).
Correlation of the ARG signature with clinicopathological characteristics
To explore the impact of the signature on the clinicopathological features of BC, we evaluated the correlation of the risk score with four clinicopathological factors (age, grade, and T and N stage).
Nomogram construction
Univariate and multivariate Cox regression analyses were performed to evaluate whether the risk scores are independent prognostic factors for OS. The variables examined included age, ER and PR status (negative and positive), tumor grade, T stage, and N stage. Using p < 0.05 as the cut-off value, we performed univariate Cox’s proportional hazards regression analysis for these variables. Based on the backward stepwise method, we applied a multivariate Cox’s proportional hazards regression model to identify key variables. Then, a nomogram was constructed to predict 3- and 5-year RFS rates in BC patients. The nomogram thus obtained was validated by measuring its discrimination and calibration abilities. We used the area under the curve (AUC) to evaluate our model’s discrimination performance and to assess heterogeneities in its predicting ability (i.e. predicted vs observed results) using the “rms” R package.
Statistical analyses
Continuous variables were expressed as mean ± standard deviation (SD) as appropriate. Chi-squared and t-tests were used to compare differences between two groups. The accuracy of the prognostic nomogram was assessed by the AUC values of ROC curves using the package “survivalROC” in R. Statistical analyses were performed with R software (version 3.6.1, http://www.r-project.org/).
Availability of data and material
The GSE25066 and GSE22219 datasets analyzed in the current study are available from the GEO database (https://www.ncbi.nlm.nih.gov/geo/). Additional information about results of this work is available from the corresponding author upon reasonable request.
Author Contributions
JYM, GL, and GSW designed the study. JYM, QL, and GL performed data acquisition. QL, GL, and SSP interpreted the data. JYM, QL, GL, and SSP analyzed and created visual layouts of the data. All authors drafted and revised the manuscript. The final manuscript was read and approved by all authors.
Conflicts of Interest
The authors declare no conflicts of interest related to this study.
Funding
The authors received no specific funding for this work.
References
- 1. Siegel RL, Miller KD, Jemal A. Cancer statistics, 2020. CA Cancer J Clin. 2020; 70:7–30. https://doi.org/10.3322/caac.21590 [PubMed]
- 2. Li N, Deng Y, Zhou L, Tian T, Yang S, Wu Y, Zheng Y, Zhai Z, Hao Q, Song D, Zhang D, Kang H, Dai Z. Global burden of breast cancer and attributable risk factors in 195 countries and territories, from 1990 to 2017: results from the Global Burden of Disease Study 2017. J Hematol Oncol. 2019; 12:140. https://doi.org/10.1186/s13045-019-0828-0 [PubMed]
- 3. Berry DA, Cronin KA, Plevritis SK, Fryback DG, Clarke L, Zelen M, Mandelblatt JS, Yakovlev AY, Habbema JD, Feuer EJ, and Cancer Intervention and Surveillance Modeling Network (CISNET) Collaborators. Effect of screening and adjuvant therapy on mortality from breast cancer. N Engl J Med. 2005; 353:1784–92. https://doi.org/10.1056/NEJMoa050518 [PubMed]
- 4. Li X, He S, Ma B. Autophagy and autophagy-related proteins in cancer. Mol Cancer. 2020; 19:12. https://doi.org/10.1186/s12943-020-1138-4 [PubMed]
- 5. White E. Deconvoluting the context-dependent role for autophagy in cancer. Nat Rev Cancer. 2012; 12:401–10. https://doi.org/10.1038/nrc3262 [PubMed]
- 6. Amaravadi R, Kimmelman AC, White E. Recent insights into the function of autophagy in cancer. Genes Dev. 2016; 30:1913–30. https://doi.org/10.1101/gad.287524.116 [PubMed]
- 7. Mele L, Del Vecchio V, Liccardo D, Prisco C, Schwerdtfeger M, Robinson N, Desiderio V, Tirino V, Papaccio G, La Noce M. The role of autophagy in resistance to targeted therapies. Cancer Treat Rev. 2020; 88:102043. https://doi.org/10.1016/j.ctrv.2020.102043 [PubMed]
- 8. Huang F, Wang BR, Wang YG. Role of autophagy in tumorigenesis, metastasis, targeted therapy and drug resistance of hepatocellular carcinoma. World J Gastroenterol. 2018; 24:4643–51. https://doi.org/10.3748/wjg.v24.i41.4643 [PubMed]
- 9. Wang Z, Gao L, Guo X, Feng C, Lian W, Deng K, Xing B. Development and validation of a nomogram with an autophagy-related gene signature for predicting survival in patients with glioblastoma. Aging (Albany NY). 2019; 11:12246–69. https://doi.org/10.18632/aging.102566 [PubMed]
- 10. Chen H, Ma X, Yang M, Wang M, Li L, Huang T. Transcription Factor Profiling to Predict Recurrence-Free Survival in Breast Cancer: Development and Validation of a Nomogram to Optimize Clinical Management. Front Genet. 2020; 11:333. https://doi.org/10.3389/fgene.2020.00333 [PubMed]
- 11. Zhou M, Zhong L, Xu W, Sun Y, Zhang Z, Zhao H, Yang L, Sun J. Discovery of potential prognostic long non-coding RNA biomarkers for predicting the risk of tumor recurrence of breast cancer patients. Sci Rep. 2016; 6:31038. https://doi.org/10.1038/srep31038 [PubMed]
- 12. Tang J, Ma W, Zeng Q, Tan J, Cao K, Luo L. Identification of miRNA-Based Signature as a Novel Potential Prognostic Biomarker in Patients with Breast Cancer. Dis Markers. 2019; 2019:3815952. https://doi.org/10.1155/2019/3815952 [PubMed]
- 13. Zhang Y, Wang Y, Tian G, Jiang T. Long non-coding RNA-based signatures to improve prognostic prediction of breast cancer. Medicine (Baltimore). 2020; 99:e22203. https://doi.org/10.1097/MD.0000000000022203 [PubMed]
- 14. Feng J, Ren J, Yang Q, Liao L, Cui L, Gong Y, Sun S. Metabolic gene signature for predicting breast cancer recurrence using transcriptome analysis. Future Oncol. 2021; 17:71–80. https://doi.org/10.2217/fon-2020-0281 [PubMed]
- 15. Lai J, Chen B, Zhang G, Wang Y, Mok H, Wen L, Pan Z, Su F, Liao N. Identification of a novel microRNA recurrence-related signature and risk stratification system in breast cancer. Aging (Albany NY). 2019; 11:7525–36. https://doi.org/10.18632/aging.102268 [PubMed]
- 16. Tyutyunyk-Massey L, Gewirtz DA. Roles of autophagy in breast cancer treatment: Target, bystander or benefactor. Semin Cancer Biol. 2020; 66:155–62. https://doi.org/10.1016/j.semcancer.2019.11.008 [PubMed]
- 17. Chiu CF, Chin HK, Huang WJ, Bai LY, Huang HY, Weng JR. Induction of Apoptosis and Autophagy in Breast Cancer Cells by a Novel HDAC8 Inhibitor. Biomolecules. 2019; 9:824. https://doi.org/10.3390/biom9120824 [PubMed]
- 18. Ulasov IV, Borovjagin AV, Timashev P, Cristofanili M, Welch DR. KISS1 in breast cancer progression and autophagy. Cancer Metastasis Rev. 2019; 38:493–506. https://doi.org/10.1007/s10555-019-09814-4 [PubMed]
- 19. Ternès N, Rotolo F, Michiels S. Empirical extensions of the lasso penalty to reduce the false discovery rate in high-dimensional Cox regression models. Stat Med. 2016; 35:2561–73. https://doi.org/10.1002/sim.6927 [PubMed]
- 20. Singleton DC, Harris AL. Targeting the ATF4 pathway in cancer therapy. Expert Opin Ther Targets. 2012; 16:1189–202. https://doi.org/10.1517/14728222.2012.728207 [PubMed]
- 21. van Geldermalsen M, Wang Q, Nagarajah R, Marshall AD, Thoeng A, Gao D, Ritchie W, Feng Y, Bailey CG, Deng N, Harvey K, Beith JM, Selinger CI, et al. ASCT2/SLC1A5 controls glutamine uptake and tumour growth in triple-negative basal-like breast cancer. Oncogene. 2016; 35:3201–08. https://doi.org/10.1038/onc.2015.381 [PubMed]
- 22. Gao S, Ge A, Xu S, You Z, Ning S, Zhao Y, Pang D. PSAT1 is regulated by ATF4 and enhances cell proliferation via the GSK3β/β-catenin/cyclin D1 signaling pathway in ER-negative breast cancer. J Exp Clin Cancer Res. 2017; 36:179. https://doi.org/10.1186/s13046-017-0648-4 [PubMed]
- 23. Bobrovnikova-Marjon E, Grigoriadou C, Pytel D, Zhang F, Ye J, Koumenis C, Cavener D, Diehl JA. PERK promotes cancer cell proliferation and tumor growth by limiting oxidative DNA damage. Oncogene. 2010; 29:3881–95. https://doi.org/10.1038/onc.2010.153 [PubMed]
- 24. Nagelkerke A, Bussink J, Mujcic H, Wouters BG, Lehmann S, Sweep FC, Span PN. Hypoxia stimulates migration of breast cancer cells via the PERK/ATF4/LAMP3-arm of the unfolded protein response. Breast Cancer Res. 2013; 15:R2. https://doi.org/10.1186/bcr3373 [PubMed]
- 25. Nagasawa I, Kunimasa K, Tsukahara S, Tomida A. BRAF-mutated cells activate GCN2-mediated integrated stress response as a cytoprotective mechanism in response to vemurafenib. Biochem Biophys Res Commun. 2017; 482:1491–97. https://doi.org/10.1016/j.bbrc.2016.12.062 [PubMed]
- 26. Milani M, Rzymski T, Mellor HR, Pike L, Bottini A, Generali D, Harris AL. The role of ATF4 stabilization and autophagy in resistance of breast cancer cells treated with Bortezomib. Cancer Res. 2009; 69:4415–23. https://doi.org/10.1158/0008-5472.CAN-08-2839 [PubMed]
- 27. Notte A, Rebucci M, Fransolet M, Roegiers E, Genin M, Tellier C, Watillon K, Fattaccioli A, Arnould T, Michiels C. Taxol-induced unfolded protein response activation in breast cancer cells exposed to hypoxia: ATF4 activation regulates autophagy and inhibits apoptosis. Int J Biochem Cell Biol. 2015; 62:1–14. https://doi.org/10.1016/j.biocel.2015.02.010 [PubMed]
- 28. Zeng P, Sun S, Li R, Xiao ZX, Chen H. HER2 Upregulates ATF4 to Promote Cell Migration via Activation of ZEB1 and Downregulation of E-Cadherin. Int J Mol Sci. 2019; 20:2223. https://doi.org/10.3390/ijms20092223 [PubMed]
- 29. Carr MW, Roth SJ, Luther E, Rose SS, Springer TA. Monocyte chemoattractant protein 1 acts as a T-lymphocyte chemoattractant. Proc Natl Acad Sci U S A. 1994; 91:3652–56. https://doi.org/10.1073/pnas.91.9.3652 [PubMed]
- 30. Van Coillie E, Van Damme J, Opdenakker G. The MCP/eotaxin subfamily of CC chemokines. Cytokine Growth Factor Rev. 1999; 10:61–86. https://doi.org/10.1016/s1359-6101(99)00005-2 [PubMed]
- 31. Qian BZ, Li J, Zhang H, Kitamura T, Zhang J, Campion LR, Kaiser EA, Snyder LA, Pollard JW. CCL2 recruits inflammatory monocytes to facilitate breast-tumour metastasis. Nature. 2011; 475:222–25. https://doi.org/10.1038/nature10138 [PubMed]
- 32. Yumimoto K, Sugiyama S, Mimori K, Nakayama KI. Potentials of C-C motif chemokine 2-C-C chemokine receptor type 2 blockers including propagermanium as anticancer agents. Cancer Sci. 2019; 110:2090–99. https://doi.org/10.1111/cas.14075 [PubMed]
- 33. Heiskala M, Leidenius M, Joensuu K, Heikkilä P. High expression of CCL2 in tumor cells and abundant infiltration with CD14 positive macrophages predict early relapse in breast cancer. Virchows Arch. 2019; 474:3–12. https://doi.org/10.1007/s00428-018-2461-7 [PubMed]
- 34. Fujimoto H, Sangai T, Ishii G, Ikehara A, Nagashima T, Miyazaki M, Ochiai A. Stromal MCP-1 in mammary tumors induces tumor-associated macrophage infiltration and contributes to tumor progression. Int J Cancer. 2009; 125:1276–84. https://doi.org/10.1002/ijc.24378 [PubMed]
- 35. Fang WB, Yao M, Jokar I, Alhakamy N, Berkland C, Chen J, Brantley-Sieders D, Cheng N. The CCL2 chemokine is a negative regulator of autophagy and necrosis in luminal B breast cancer cells. Breast Cancer Res Treat. 2015; 150:309–20. https://doi.org/10.1007/s10549-015-3324-4 [PubMed]
- 36. Averous J, Bruhat A, Jousse C, Carraro V, Thiel G, Fafournoux P. Induction of CHOP expression by amino acid limitation requires both ATF4 expression and ATF2 phosphorylation. J Biol Chem. 2004; 279:5288–97. https://doi.org/10.1074/jbc.M311862200 [PubMed]
- 37. Ubeda M, Wang XZ, Zinszner H, Wu I, Habener JF, Ron D. Stress-induced binding of the transcriptional factor CHOP to a novel DNA control element. Mol Cell Biol. 1996; 16:1479–89. https://doi.org/10.1128/MCB.16.4.1479 [PubMed]
- 38. Block I, Müller C, Sdogati D, Pedersen H, List M, Jaskot AM, Syse SD, Lund Hansen P, Schmidt S, Christiansen H, Casella C, Bering Olsen S, Blomstrøm MM, et al. CFP suppresses breast cancer cell growth by TES-mediated upregulation of the transcription factor DDIT3. Oncogene. 2019; 38:4560–73. https://doi.org/10.1038/s41388-019-0739-0 [PubMed]
- 39. Tan HK, Muhammad TST, Tan ML. 14-Deoxy-11,12-didehydroandrographolide induces DDIT3-dependent endoplasmic reticulum stress-mediated autophagy in T-47D breast carcinoma cells. Toxicol Appl Pharmacol. 2016; 300:55–69. https://doi.org/10.1016/j.taap.2016.03.017 [PubMed]