


Introduction
Acute myocardial infarction (AMI) is the leading cause of death worldwide, and the major adverse cardiovascular and cerebrovascular events (MACEs) resulting from AMI are not only a direct cause of death but also a huge economic burden on the health care system [1–3]. The American College of Cardiology (ACC)/American Heart Association (AHA) and the European Society of Cardiology (ESC) guidelines recommend the Global Registry of Acute Coronary Events (GRACE) score as one of the main tools for the risk assessment of patients with acute coronary syndrome (ACS) [4, 5]. It has a certain predictive ability for hospitalization and provides long-term mortality risk for patients with ACS [6], but its composition lacks inflammation assessment. Our previous study [7] showed that the inflammation-based Glasgow Prognostic Score (GPS) was similar to GRACE in predicting MACEs in patients with AMI. The combined model of the two scores may improve the predictive power for MACEs in patients with AMI. The GPS is composed of hypersensitive C-reactive protein (H-CRP) and albumin, and H-CRP is widely recognized as one of the strongest risk indicators for predicting cardiovascular disease in addition to being considered an important marker of inflammatory factors [8]. Albumin is considered to be as important as H-CRP in predicting the prognosis of myocardial infarction [9]. The reason may be that under stress, albumin serves as an important energy source, and its reduction indicates the energy loss of AMI patients. In addition, albumin has also been found to act against oxidative stress damage [10], which may be involved in the inhibition of platelet activation and anti-vascular endothelial cell apoptosis [11]. However, the GPS was derived from the prognostic data from cancer patients, and the cutoff values established based on their H-CRP and albumin levels may not be the most appropriate for patients with AMI. In addition, in recent years, some studies [12–14] have reported that the platelet-to-lymphocyte ratio (PLR) can also predict MACEs in ACS patients. Sia et al. [15] investigated AMI patients without undergoing percutaneous coronary intervention (PCI) and found that PLR was an independent predictor of thrombosis. Toprak et al. [16] found that a high level of PLR was associated with the no reflow phenomenon in ST-elevation myocardial infarction (STEMI) patients with undergoing primary PCI.
Therefore, in this study, we conducted a retrospective cohort study to jointly evaluate the predictive ability of the GPS, PLR and GRACE in predicting adverse outcomes in patients with AMI during hospitalization and to optimize the calculation of the GPS.
Materials and Methods
Participants
Patients were recruited from the Zhejiang Hospital of Integrated Traditional Chinese and Western Medicine from January 1, 2015, to October 9, 2020. An exemption from the informed consent requirement was approved by the ethics committee of Zhejiang Hospital of Integrated Traditional Chinese and Western Medicine (Ethical Application Ref: 2020KS195), as this was a retrospective cohort study. This study protocol strictly complied with the requirements of the Helsinki Declaration of the World Medical Association and the international ethics guide for human biomedical research of the Council for International Organizations of Medical Sciences (CIOMS).
Study design
According to the GPS data from our previous study7, the optimal threshold was obtained by the Youden index, and the sensitivity of the optimal expectation was 0.883, and the specificity was 0.664. So the estimation of the sample size for evaluation of the diagnostic test was calculated [17, 18]; a sample size of at least 175 was calculated using MedSci Sample Size tools (MSST) (https://www.medsci.cn/medsci-tools).
According to the third global definition of myocardial infarction [19], 175 patients met the inclusion criteria during the retrospective retrieval period. The following exclusion criteria were used: (1) lack of data on H-CRP serum albumin, platelets or lymphocytes; and (2) critical patients discharged automatically without MACEs.
Data collection
This process was similar to previous studies; in brief, the baseline data included age, sex, diagnosis, hypertension, diabetes, acute infection, autoimmune diseases, tumors, nephrotic syndrome, cirrhosis, uremia, MACEs, blood pressure, PCI type, Killip classification, and biochemical indicators, including H-CRP, albumin, platelets, lymphocytes, hemoglobin, creatine kinase (CK), creatine kinase MB (CK-MB), troponin I (TNI), type B natriuretic peptide (BNP), low-density lipoprotein (LDL), creatinine, D-dimer, and alanine aminotransferase (ALT). All biochemical indicators were selected as the first biochemical results after admission.
Definition of each score
GPS was defined as follows: patients with an elevated H-CRP level (> 10 mg/L) and a low albumin level (< 35 g/L) were designated as a GPS of 2. The presence of one abnormality associated with either the H-CRP level or albumin level was designated as a GPS of 1. If both metrics were normal, its value was designated as 0 point.
The redefined GPS (RGPS) was based on high-sensitivity H-CRP and albumin data from the previous study7 and redefined by optimal thresholds: patients with an elevated H-CRP level (> 12.57 mg/L) and a low albumin level (< 35.95 g/L) were designated as a GPS of 2. The presence of one abnormality associated with either the H-CRP level or albumin level was designated as a GPS of 1. If both metrics were normal, its value was designated as 0 point.
The definition of the PLR score (PLRS) was based on the quartile range of the PLR in the previous study, as follows: patients with an elevated PLR (> 211.25) were designated as a PLRS of 2, but if patients with a decreased PLR (< 105.71) were designated as a PLRS of 0, its value was designated as 1 point (i.e., between the two).
According to Granger CB et al. [20–22], the GRACE score was completed. In brief, age, heart rate, systolic blood pressure, creatinine, prehospital cardiac arrest, Killip classification, ST segment deviation, and myocardial enzyme elevation were used to determine the GRACE score.
End points
The primary outcome was MACEs during hospitalization, which were calculated as a combination of deterioration of heart failure, cardiogenic shock, cardiovascular death, mechanical complications of myocardial infarction, stroke, and persistent ventricular arrhythmias. For all eligible individuals, observation period from inclusion to the first occurrence of MACEs (Supplementary Figure 1).
Statistical analysis
Data analysis referred to previous studies7. Briefly, continuous variables were summarized as medians and quartiles and compared using the Kruskal-Wallis test. Univariate/multivariate associations between clinical variables and the primary outcome were estimated by logistic regression analysis using a forward stepwise logistic regression (LR) model. The variables of clinical interest and clinical variables in the univariate analysis (P < 0.10) were included in multivariate analysis, but those variables that were included in the scoring system were excluded. The calibration of the multivariate logistic regression model was done using the Hosmer-Lemeshow good of fit test. The area under the curve (AUC) was calculated by receiver operating characteristic (ROC) curve analysis to determine the prediction of each score for the primary outcome. Pairwise comparisons of ROC curves were quantitatively analyzed by the Delong method. Subgroup analysis were completed according to the type of PCI, the type of AMI, and the presence or absence of acute infection. Expectation maximization (EM) was used to fill in missing variables. In addition, the optimal thresholds for the RGPS and PLRS were determined by comprehensive evaluation of the Youden, Product and Euclidean indices. The odds ratio (OR) and 95% confidence interval (CI), AUC and 95% CI, rate, and median (quartile) were calculated a summary statistic. The data were analyzed using SPSS 25.0 (SPSS, Inc., Chicago, IL).
Results
Characteristics of the included patients
The main clinical features of the patients are shown in Table 1. A total of 175 patients were included in this study (Figure 1). The average age was 65 (54-80) years, 73.1% of patients were male, 60.6% of patients had a history of hypertension, 37.7% of patients had a history of diabetes mellitus, and 34.3% had acute infection. Of these patients, 40 (22.9%) had MACEs. The baseline characteristics of patients were categorized according to the GPSs. Compared with the low-score group, the high-score group had older patients (P < 0.001), a higher prevalence of diabetes (P < 0.05), a higher acute infection rate (P < 0.001), a higher prevalence of severe kidney disease (P = 0.015), lower hemoglobin levels (P < 0.001), higher Killip classes (P < 0.001), lower blood lymphocyte levels (P<0.001), higher D-dimer levels (P < 0.001), higher creatinine levels (P < 0.001) and higher BNP levels (P < 0.001). There were missing values for LDL, BNP, and D-dimers, with missing rates of 1.7%, 3.4, and 1.7, respectively, that were completed through the EM method (Supplementary Table 1).
Table 1. Relationships between clinical characteristics and the GPS in patients with acute myocardial infarction.
| Variable | GPS | P | |||||||||||||||||||||||||||||||||||||||||||||||||||||||||||||||||||||||||||||||||||||||||||||||||
| 0 | 1 | 2 | |||||||||||||||||||||||||||||||||||||||||||||||||||||||||||||||||||||||||||||||||||||||||||||||||
| Age, (years) | 58.0(49.0-70.5) | 66.0(58.0-81.0) | 80.0(63.5-89.0) | <0.001 | |||||||||||||||||||||||||||||||||||||||||||||||||||||||||||||||||||||||||||||||||||||||||||||||
| Males, (n, %) | 57(78.1) | 42(70.0) | 29(69.0) | 0.457 | |||||||||||||||||||||||||||||||||||||||||||||||||||||||||||||||||||||||||||||||||||||||||||||||
| Hypertension, (n, %) | 44(60.3) | 35(58.3) | 27(64.3) | 0.831 | |||||||||||||||||||||||||||||||||||||||||||||||||||||||||||||||||||||||||||||||||||||||||||||||
| Diabetics, (n, %) | 21(28.8) | 25(41.7) | 20(47.6) | 0.098 | |||||||||||||||||||||||||||||||||||||||||||||||||||||||||||||||||||||||||||||||||||||||||||||||
| Acute infections, (n, %) | 9(12.3) | 23(38.3) | 28(66.7) | <0.001 | |||||||||||||||||||||||||||||||||||||||||||||||||||||||||||||||||||||||||||||||||||||||||||||||
| Autoimmune diseases, (n, %) | 1(1.4) | 3(5.0) | 3(7.1) | 0.225 | |||||||||||||||||||||||||||||||||||||||||||||||||||||||||||||||||||||||||||||||||||||||||||||||
| Nephrotic syndrome or uremia, (n, %) | 0(0) | 2(3.3) | 4(9.5) | 0.015 | |||||||||||||||||||||||||||||||||||||||||||||||||||||||||||||||||||||||||||||||||||||||||||||||
| Liver cirrhosis, (n, %) | 0(0) | 1(1.7) | 2(4.8) | 0.111 | |||||||||||||||||||||||||||||||||||||||||||||||||||||||||||||||||||||||||||||||||||||||||||||||
| Heart rate, (times/min) | 78.0(68.0-89.5) | 76.5(70.0-99.8) | 86.0(75.0-96.0) | 0.066 | |||||||||||||||||||||||||||||||||||||||||||||||||||||||||||||||||||||||||||||||||||||||||||||||
| SBP, (mmHg) | 130.0(114.0-146.5) | 133.0(120.0-146.0) | 128.5(108.0-150.0) | 0.553 | |||||||||||||||||||||||||||||||||||||||||||||||||||||||||||||||||||||||||||||||||||||||||||||||
| DBP, (mmHg) | 74.0(67.5-81.0) | 72.0(68.0-88.8) | 70.0(62.0-80.0) | 0.200 | |||||||||||||||||||||||||||||||||||||||||||||||||||||||||||||||||||||||||||||||||||||||||||||||
| Killip > 2, (n, %) | 7(9.6) | 19(31.7) | 21(50.0) | <0.001 | |||||||||||||||||||||||||||||||||||||||||||||||||||||||||||||||||||||||||||||||||||||||||||||||
| Hemoglobin, (g/L) | 136.0(121.5-144.0) | 122.0(110.0-141.0) | 123.0(106.8-131.3) | <0.001 | |||||||||||||||||||||||||||||||||||||||||||||||||||||||||||||||||||||||||||||||||||||||||||||||
| Platelet, (×10^12/L) | 192.0(150.0-230.0) | 191.5(153.0-235.5) | 171.5(141.0-226.0) | 0.788 | |||||||||||||||||||||||||||||||||||||||||||||||||||||||||||||||||||||||||||||||||||||||||||||||
| Lymphocyte, (×10^12/L) | 1.4(1.1-1.8) | 1.4(1.0-1.8) | 1.0(0.7-1.4) | <0.001 | |||||||||||||||||||||||||||||||||||||||||||||||||||||||||||||||||||||||||||||||||||||||||||||||
| D-Dimer, (mg/L) | 0.3(0.2-0.5) | 0.6(0.3-1.2) | 1.5(0.7-2.9) | <0.001 | |||||||||||||||||||||||||||||||||||||||||||||||||||||||||||||||||||||||||||||||||||||||||||||||
| ALT, (U/L) | 29.0(18.5-53.0) | 36.0(22.0-55.0) | 28.5(17.0-53.3) | 0.465 | |||||||||||||||||||||||||||||||||||||||||||||||||||||||||||||||||||||||||||||||||||||||||||||||
| CK, (U/L) | 462.0(163.5-1734.5) | 866.0(176.8-1652.8) | 261.5(96.8-622.3) | 0.019 | |||||||||||||||||||||||||||||||||||||||||||||||||||||||||||||||||||||||||||||||||||||||||||||||
| CK-MB, (U/L) | 51.0(17.5-157.0) | 59.0(20.0-126.0) | 28.5(15.0-46.0) | 0.031 | |||||||||||||||||||||||||||||||||||||||||||||||||||||||||||||||||||||||||||||||||||||||||||||||
| LDL, (mmol/L) | 2.4(1.8-3.0) | 2.2(1.6-2.6) | 2.2(1.7-2.5) | 0.335 | |||||||||||||||||||||||||||||||||||||||||||||||||||||||||||||||||||||||||||||||||||||||||||||||
| Creatinine, (umol/L) | 87.6(76.4-97.8) | 90.9(81.4-5101.1) | 112.2(85.3-127.3) | 0.001 | |||||||||||||||||||||||||||||||||||||||||||||||||||||||||||||||||||||||||||||||||||||||||||||||
| BNP, (pg/mL) | 125.0(58.5-274.0) | 380.0(145.8-688.3) | 900.0(339.8-1634.3) | <0.001 | |||||||||||||||||||||||||||||||||||||||||||||||||||||||||||||||||||||||||||||||||||||||||||||||
| TNI, (ng/mL) | 9.8(2.3-48.7) | 19.1(3.9-51.5) | 8.1(1.3-28.0) | 0.067 | |||||||||||||||||||||||||||||||||||||||||||||||||||||||||||||||||||||||||||||||||||||||||||||||
| BNP, type B natriuretic peptide; CK, creatine kinase; CK-MB, creatine kinase MB; DBP, diastolic blood pressure; GPS, inflammation-based Glasgow Prognostic Score; GRACE, Global Registry of Acute Coronary Events; LDL, low density lipoproteincreatinine; PCI, percutaneous coronary intervention; SBP, systolic blood pressure; SD, standard deviation; TNI, troponin I. Values are numbers (%) or medians (interquartile ranges). | |||||||||||||||||||||||||||||||||||||||||||||||||||||||||||||||||||||||||||||||||||||||||||||||||||
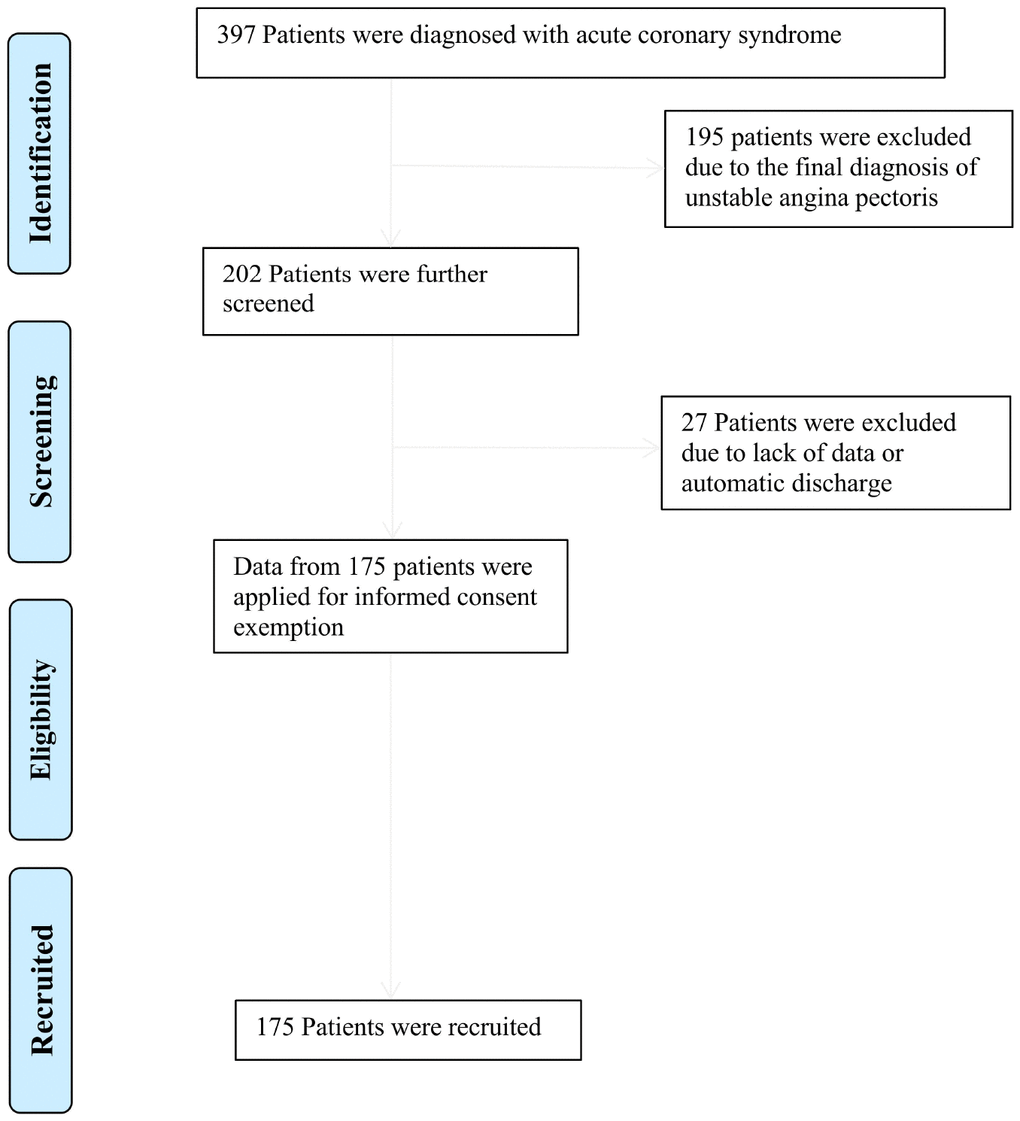
Figure 1. Flow diagram for recruitment of patients.
Prediction of the primary outcome
The results of unit ROC curve analysis for the MACEs showed that the AUCs were 0.780 (95% CI 0.696-0.864) for the GPS, 0.766 (95% CI 0.682-0.850) for RGPS, 0.561 (95% CI 0.458-0.664) for PLRS, and 0.793 (95% CI 0.706-0.880) for GRACE (Figure 2A and Table 2). The GPS, RGPS and GRACE had higher AUC values than the PLRS (P < 0.001, P < 0.001, and P < 0.001, respectively) (Supplementary Table 2).
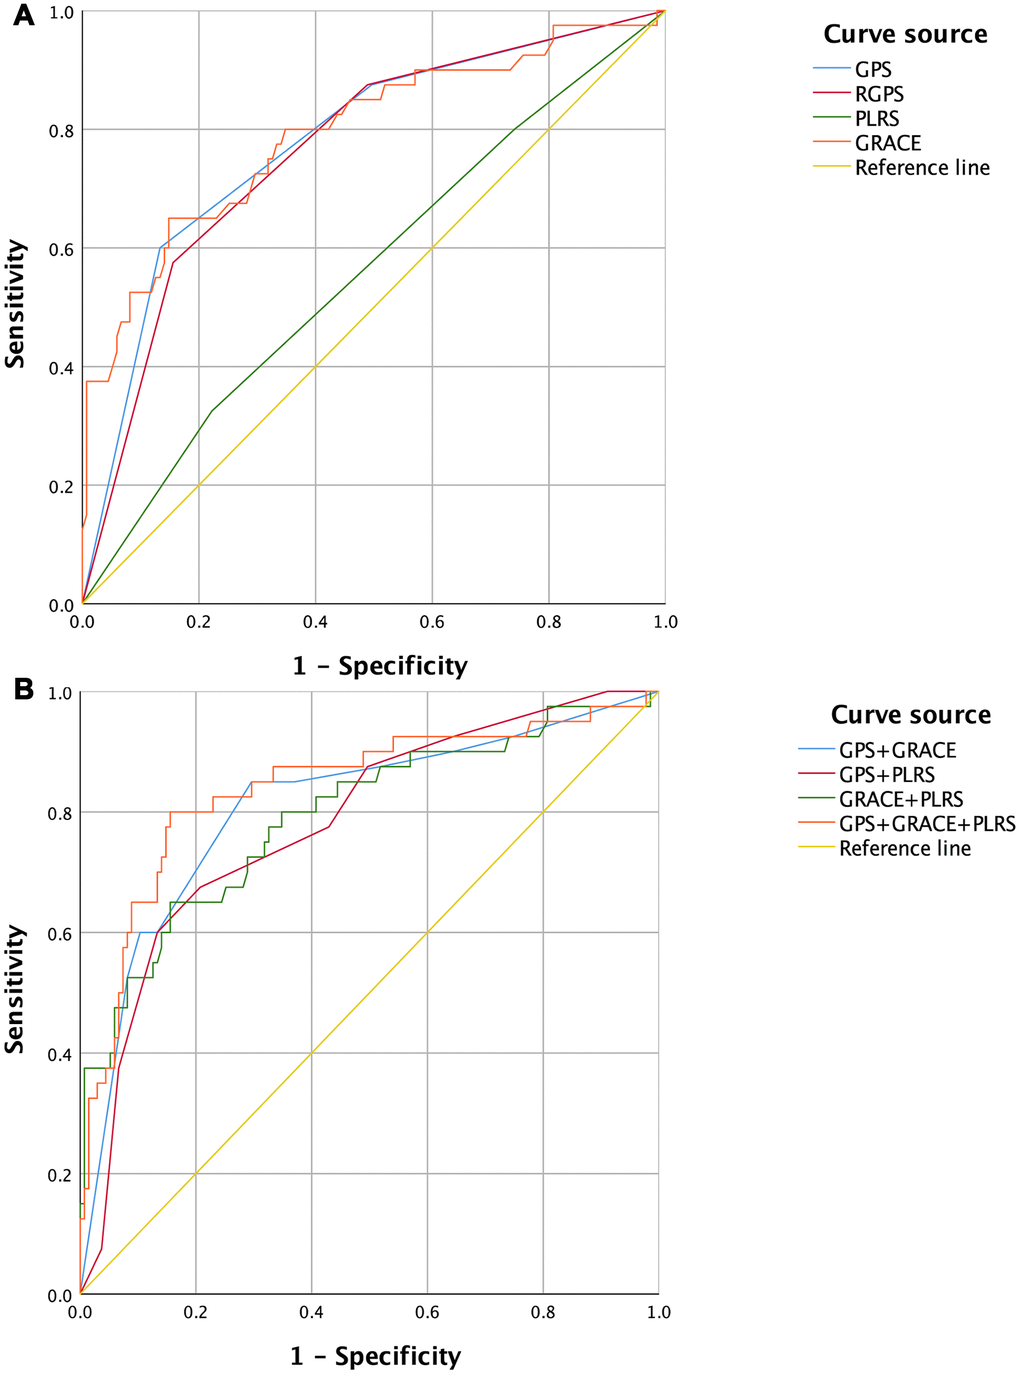
Figure 2. ROC Curves of GPSs, PLRS, GRACE and combined diagnostic models for the occurrence of MACEs in patients with acute myocardial infarction. (A) Univariate ROC curves. (B) Multivariate ROC curves. GPS, inflammation-based Glasgow Prognostic Score; GRACE, Global Registry of Acute Coronary Events; MACEs, major adverse cardiovascular and cerebrovascular events; PLRS, platelet-to-lymphocyte score; RGPS, Redefined inflammation-based Glasgow Prognostic Score; ROC, receiver operating characteristic.
Multivariate ROC curve analysis revealed that this AUC value was 0.809 (95% CI 0.726-0.893) for the GPS combined with GRACE, 0.783 (95% CI 0.701-0.864) for the GPS combined with the PLRS, 0.794 (95% CI 0.707-0.880) for GRACE combined with the PLRS, and 0.841 (95% CI 0.761-0.921) for the GPS combined with GRACE and the PLRS (Figure 2B and Table 2 and Supplementary Table 3). The combined diagnostic model of the GPS plus GRACE and the PLRS had a higher AUC value than the combination of the GPS, RGPS and GRACE (P = 0.014, P = 0.004, and P = 0.038, respectively) (Supplementary Table 4).
Table 2. ROC analysis of in-hospital MACEs.
| Variable | AUC | CI | P | ||||||||||||||||||||||||||||||||||||||||||||||||||||||||||||||||||||||||||||||||||||||||||||||||
| GPS | 0.780 | 0.696-0.864 | <0.001 | ||||||||||||||||||||||||||||||||||||||||||||||||||||||||||||||||||||||||||||||||||||||||||||||||
| RGPS | 0.766 | 0.682-0.850 | <0.001 | ||||||||||||||||||||||||||||||||||||||||||||||||||||||||||||||||||||||||||||||||||||||||||||||||
| PLRS | 0.561 | 0.458-0.664 | 0.241 | ||||||||||||||||||||||||||||||||||||||||||||||||||||||||||||||||||||||||||||||||||||||||||||||||
| GRACE | 0.793 | 0.706-0.880 | <0.001 | ||||||||||||||||||||||||||||||||||||||||||||||||||||||||||||||||||||||||||||||||||||||||||||||||
| GPS+GRACE | 0.809 | 0.726-0.893 | <0.001 | ||||||||||||||||||||||||||||||||||||||||||||||||||||||||||||||||||||||||||||||||||||||||||||||||
| GPS+PLRS | 0.783 | 0.701-0.864 | <0.001 | ||||||||||||||||||||||||||||||||||||||||||||||||||||||||||||||||||||||||||||||||||||||||||||||||
| GRACE+PLRS | 0.794 | 0.707-0.880 | <0.001 | ||||||||||||||||||||||||||||||||||||||||||||||||||||||||||||||||||||||||||||||||||||||||||||||||
| GPS+GRACE+PLRS | 0.841 | 0.761-0.921 | <0.001 | ||||||||||||||||||||||||||||||||||||||||||||||||||||||||||||||||||||||||||||||||||||||||||||||||
| AUC, area under the curve; CI, confidence interval; GPS, inflammation-based Glasgow Prognostic Score; GRACE, Global Registry of Acute Coronary Events; MACEs, Global Registry of Acute Coronary Events; PLRS, platelet-to-lymphocyte score; RGPS, Redefined inflammation-based Glasgow Prognostic Score. | |||||||||||||||||||||||||||||||||||||||||||||||||||||||||||||||||||||||||||||||||||||||||||||||||||
Logistic regression analysis
Univariate logistic regression analysis revealed that the OR for in-hospital MACEs was 3.053 (95% CI 0.997-9.349) for the GPS (1 vs 0) (Table 3), 18.133 (95% CI 0.997-9.349) for the GPS (2 vs 0), 1.029 (95% CI 1.018-1.039) for the GRACE score, 1.052 (95% CI 1.024-1.081) for age, 5.517 (95% CI 2.588-11.762) for acute infection, 7.389 (95% CI 1.301-41.965) for severe renal damage, 0.515 (95% CI 0.282-0.941) for PCI type, 1.027 (95% CI 1.005-1.049) for heart rate, 2.850 (95% CI 1.964-4.136) for Killip classification, 0.963 (95% CI 0.945-0.982) for hemoglobin, 0.411 (95% CI 0.207-0.817) for lymphocyte count, 1.604 (95% CI 1.214-2.121) for D-dimer, 0.676 (95% CI 0.592-0.771) for albumin, 1.011 (95% CI 1.002-1.019) for H-CRP, 1.012 (95% CI 1.003-1.022) for creatinine and 1.001 (95% CI 1.001-1.002) for BNP.
Table 3. Logistic regression analysis of MACEs during hospitalization.
| Variable | OR | Univariate analysis for 95% CI | P | OR | Multivariate analysis for 95% CI | P | |||||||||||||||||||||||||||||||||||||||||||||||||||||||||||||||||||||||||||||||||||||||||||||
| GPS | <0.001 | 0.016 | |||||||||||||||||||||||||||||||||||||||||||||||||||||||||||||||||||||||||||||||||||||||||||||||||
| GPS (1 vs 0) | 3.053 | 0.997-9.349 | 0.051 | 1.810 | 0.536-6.113 | 0.339 | |||||||||||||||||||||||||||||||||||||||||||||||||||||||||||||||||||||||||||||||||||||||||||||
| GPS (2 vs 0) | 18.133 | 6.068-54.185 | <0.001 | 5.573 | 1.588-19.554 | 0.007 | |||||||||||||||||||||||||||||||||||||||||||||||||||||||||||||||||||||||||||||||||||||||||||||
| PLRS | 1.395 | 0.837-2.323 | 0.201 | 0.326 | |||||||||||||||||||||||||||||||||||||||||||||||||||||||||||||||||||||||||||||||||||||||||||||||
| GRACE score | 1.029 | 1.018-1.039 | <0.001 | 1.023 | 1.009-1.036 | 0.001 | |||||||||||||||||||||||||||||||||||||||||||||||||||||||||||||||||||||||||||||||||||||||||||||
| Age | 1.052 | 1.024-1.081 | <0.001 | - | |||||||||||||||||||||||||||||||||||||||||||||||||||||||||||||||||||||||||||||||||||||||||||||||
| Males | 0.518 | 0.244-1.100 | 0.087 | 0.742 | |||||||||||||||||||||||||||||||||||||||||||||||||||||||||||||||||||||||||||||||||||||||||||||||
| Hypertension | 1.277 | 0.612-2.662 | 0.515 | 0.839 | |||||||||||||||||||||||||||||||||||||||||||||||||||||||||||||||||||||||||||||||||||||||||||||||
| Diabetics | 1.694 | 0.829-3.461 | 0.148 | 0.445 | |||||||||||||||||||||||||||||||||||||||||||||||||||||||||||||||||||||||||||||||||||||||||||||||
| Acute infections | 5.517 | 2.588-11.762 | <0.001 | 0.136 | |||||||||||||||||||||||||||||||||||||||||||||||||||||||||||||||||||||||||||||||||||||||||||||||
| Autoimmune diseases | 2.655 | 0.569-12.396 | 0.214 | - | |||||||||||||||||||||||||||||||||||||||||||||||||||||||||||||||||||||||||||||||||||||||||||||||
| Nephrotic syndrome or uremia | 7.389 | 1.301-41.965 | 0.024 | 0.740 | |||||||||||||||||||||||||||||||||||||||||||||||||||||||||||||||||||||||||||||||||||||||||||||||
| Liver cirrhosis | 7.053 | 0.623-79.897 | 0.115 | - | |||||||||||||||||||||||||||||||||||||||||||||||||||||||||||||||||||||||||||||||||||||||||||||||
| PCI type | 0.515 | 0.282-0.941 | 0.031 | 0.332 | |||||||||||||||||||||||||||||||||||||||||||||||||||||||||||||||||||||||||||||||||||||||||||||||
| Heart rate | 1.027 | 1.005-1.049 | 0.015 | - | |||||||||||||||||||||||||||||||||||||||||||||||||||||||||||||||||||||||||||||||||||||||||||||||
| SBP | 1.000 | 0.985-1.016 | 0.976 | - | |||||||||||||||||||||||||||||||||||||||||||||||||||||||||||||||||||||||||||||||||||||||||||||||
| DBP | 0.988 | 0.962-1.014 | 0.362 | - | |||||||||||||||||||||||||||||||||||||||||||||||||||||||||||||||||||||||||||||||||||||||||||||||
| Killip class | 2.850 | 1.964-4.136 | <0.001 | - | |||||||||||||||||||||||||||||||||||||||||||||||||||||||||||||||||||||||||||||||||||||||||||||||
| Hemoglobin | 0.963 | 0.945-0.982 | <0.001 | 0.091 | |||||||||||||||||||||||||||||||||||||||||||||||||||||||||||||||||||||||||||||||||||||||||||||||
| Platelet | 0.998 | 0.993-1.003 | 0.456 | - | |||||||||||||||||||||||||||||||||||||||||||||||||||||||||||||||||||||||||||||||||||||||||||||||
| Lymphocyte | 0.411 | 0.207-0.817 | 0.011 | - | |||||||||||||||||||||||||||||||||||||||||||||||||||||||||||||||||||||||||||||||||||||||||||||||
| D-dimer | 1.604 | 1.214-2.121 | 0.001 | 1.208 | 0.993-1.471 | 0.059 | |||||||||||||||||||||||||||||||||||||||||||||||||||||||||||||||||||||||||||||||||||||||||||||
| ALT | 1.006 | 0.999-1.014 | 0.086 | 1.013 | 0.999-1.026 | 0.060 | |||||||||||||||||||||||||||||||||||||||||||||||||||||||||||||||||||||||||||||||||||||||||||||
| CK | 1.000 | 1.000-1.000 | 0.259 | 0.724 | |||||||||||||||||||||||||||||||||||||||||||||||||||||||||||||||||||||||||||||||||||||||||||||||
| CK-MB | 0.999 | 0.996-1.002 | 0.517 | 0.691 | |||||||||||||||||||||||||||||||||||||||||||||||||||||||||||||||||||||||||||||||||||||||||||||||
| Albumin | 0.676 | 0.592-0.771 | <0.001 | - | |||||||||||||||||||||||||||||||||||||||||||||||||||||||||||||||||||||||||||||||||||||||||||||||
| HS-CRP | 1.011 | 1.002-1.019 | 0.011 | - | |||||||||||||||||||||||||||||||||||||||||||||||||||||||||||||||||||||||||||||||||||||||||||||||
| LDL | 0.678 | 0.430-1.070 | 0.095 | 0.407 | |||||||||||||||||||||||||||||||||||||||||||||||||||||||||||||||||||||||||||||||||||||||||||||||
| Creatinine | 1.012 | 1.003-1.022 | 0.013 | 0.439 | |||||||||||||||||||||||||||||||||||||||||||||||||||||||||||||||||||||||||||||||||||||||||||||||
| BNP | 1.001 | 1.001-1.002 | <0.001 | 0.374 | |||||||||||||||||||||||||||||||||||||||||||||||||||||||||||||||||||||||||||||||||||||||||||||||
| TNI | 0.999 | 0.996-1.002 | 0.423 | 0.936 | |||||||||||||||||||||||||||||||||||||||||||||||||||||||||||||||||||||||||||||||||||||||||||||||
| ALT, Alanine aminotransferase; BNP, type B natriuretic peptide; CI, confidence interval; CK, creatine kinase; CK-MB, creatine kinase MB; DBP, diastolic blood pressure; GPS, inflammation-based Glasgow Prognostic Score; GRACE, Global Registry of Acute Coronary Events; LDL, low density lipoproteincreatinine; MACEs, Global Registry of Acute Coronary Events; OR, odds ratio; PCI, percutaneous coronary intervention; PLRS, platelet-to-lymphocyte score; SBP, systolic blood pressure; TNI, troponin I. | |||||||||||||||||||||||||||||||||||||||||||||||||||||||||||||||||||||||||||||||||||||||||||||||||||
The multivariate logistic regression model goodness-of-fit test was completed using the Hosmer-Lemeshow method, which showed that the model had sufficient calibration (P = 0.838). The results showed that the OR for hospitalized MACEs was 5.573 (95% CI 1.588-19.554) for GPS (2 vs 0), and the OR for MACEs was 1.023 (95% CI 1.009-1.036) for GRACE score (Table 3).
Subgroup analysis
In the STEMI group, the AUC for in-hospital MACEs was 0.737 (95% CI 0.647-0.814) for the GPS, 0.732 (95% CI 0.643-0.810) for the RGPS, 0.586 (95% CI 0.491-0.676) for the PLRS, and 0.788 (95% CI 0.703-0.858) for GRACE (Supplementary Figure 2 and Supplementary Table 5). The AUC was 0.807 (95% CI 0.724-0.874) for the GPS combined with GRACE, 0.738 (95% CI 0.649-0.815) for the GPS combined with the PLRS, 0.791 (95% CI 0.706-0.860) for GRACE combined with the PLRS, and 0.816 (95% CI 0.734-0.882) for the GPS combined with GRACE and the PLRS. The combined diagnostic model of the GPS plus GRACE and the PLRS had a higher AUC value than the GPS and RGPS (P = 0.0274 and P = 0.0231, respectively). In the non-ST-elevation myocardial infarction (NSTEMI) group, the AUCs were 0.864 (95% CI 0.749-0.940) for the GPS, 0.830 (95% CI 0.708-0.916) for the RGPS, 0.511 (95% CI 0.376-0.644) for the PLRS, and 0.877 (95% CI 0.764-0.948) for GRACE. The AUC was 0.913 (95% CI 0.809-0.971) for the GPS combined with GRACE, 0.869 (95% CI 0.755-0.943) for the GPS combined with the PLRS, 0.877 (95% CI 0.764-0.948) for GRACE combined with the PLRS, and 0.912 (95% CI 0.808-0.971) for the GPS combined with GRACE and the PLRS. The combined diagnostic model of the GPS plus GRACE seemed to have a higher AUC value than each single score, but there was no significant difference. The combined diagnostic model of the GPS plus GRACE and the PLRS had a higher AUC value than the RGPS (P = 0.0483).
In the PCI group, the AUC for in-hospital MACEs was 0.738 (95% CI 0.654-0.811) for the GPS, 0.731 (95% CI 0.647-0.805) for the RGPS, 0.522 (95% CI 0.433-0.610) for the PLRS, and 0.704 (95% CI 0.618-0.781) for GRACE (Supplementary Figure 3 and Supplementary Table 6). The AUC was 0.760 (95% CI 0.677-0.830) for the GPS combined with GRACE, 0.763 (95% CI 0.681-0.833) for the GPS combined with the PLRS, 0.718 (95% CI 0.633-0.793) for GRACE combined with the PLRS, and 0.776 (95% CI 0.695-0.844) for the GPS combined with GRACE and the PLRS. The combined diagnostic model of the GPS plus GRACE and the PLRS seemed to have a higher AUC value than each single score, but there was not statistically significantly different. In the non-PCI group, the AUCs were 0.808 (95% CI 0.662-0.911) for the GPS, 0.788 (95% CI 0.638-0.896) for the RGPS, 0.642 (95% CI 0.483-0.780) for the PLRS, and 0.828 (95% CI 0.684-0.925) for GRACE. This AUC was 0.856 (95% CI 0.718-0.944) for the GPS combined with GRACE, 0.826 (95% CI 0.682-0.924) for the GPS combined with the PLRS, 0.834 (95% CI 0.692-0.929) for GRACE combined with the PLRS, and 0.862 (95% CI 0.725-0.948) for the GPS combined with GRACE and the PLRS. The combined diagnostic model of the GPS plus GRACE and the PLRS had a higher AUC value than the RGPS alone (P = 0.0429).
In the acute infection group, the AUC for in-hospital MACEs was 0.693 (95% CI 0.560-0.806) for the GPS, 0.664 (95% CI 0.530-0.781) for the RGPS, 0.551 (95% CI 0.417-0.680) for the PLRS, and 0.700 (95% CI 0.568-0.812) for GRACE (Supplementary Figure 4 and Supplementary Table 7). This AUC was 0.762 (95% CI 0.635-0.863) for the GPS combined with GRACE, 0.701 (95% CI 0.569-0.813) for the GPS combined with the PLRS, 0.705 (95% CI 0.571-0.816) for GRACE combined with the PLRS, and 0.761 (95% CI 0.634-0.862) for the GPS combined with GRACE and the PLRS. Compared with the RGPS alone, the combined diagnostic model of the GPS plus GRACE and the PLRS and the combined diagnostic model of the GPS plus GRACE had a higher AUC value (P = 0.0184 and P = 0.0156, respectively). In the nonacute infection group, the AUCs were 0.731 (95% CI 0.640-0.809) for the GPS, 0.726 (95% CI 0.635-0.805) for the RGPS, 0.510 (95% CI 0.415-0.604) for the PLRS, and 0.786 (95% CI 0.700-0.857) for GRACE. This AUC was 0.802 (95% CI 0.717-0.870) for the GPS combined with GRACE, 0.760 (95% CI 0.672-0.835) for the GPS combined with the PLRS, 0.811 (95% CI 0.728-0.878) for GRACE combined with the PLRS, and 0.832 (95% CI 0.751-0.895) for the GPS combined with GRACE and the PLRS. The combined diagnostic model of the GPS plus GRACE and the PLRS seemed to have a higher AUC value than each single score, but there was not statistically significantly different.
Discussion
This present study investigated the predictive ability of the GPS, PLRS and GRACE for the MACEs during hospitalization in patients with acute myocardial infarction. The main findings are listed below. (1) The GPS and GRACE had good predictive ability for the MACEs during hospitalization, multivariate logistic regression analysis showed that they were both independent risk factors for MACEs, and the combined diagnostic model of the GPS and GRACE tended to have a higher predictive ability than each individual score. (2) The PLRS could not effectively predict the occurrence of MACEs during hospitalization, but the diagnostic model of the PLRS combined with the GPS and GRACE had a better predictive ability than each individual score.
Although GRACE is considered to have some predictive power for the risk of hospitalization and 5-year mortality in ACS patients [6], its composition lacks an inflammation assessment component. Two large-scale randomized controlled trials, COLCOT [23] and CANTOS [24], were designed to investigate the efficacy of anti-inflammatory therapy in patients who had myocardial infarction with high H-CRP levels, and they were found to reduce the incidence of MACEs. Another recent large-scale clinical randomized controlled trial, LoDoCo2 [25], was designed to investigate the efficacy of colchicine for long-term outcomes in patients with chronic coronary disease, the results of which showed that long-term anti-inflammatory therapy could reduce the occurrence of cardiovascular events, and that the patients started to show benefit manifestations at the beginning of the intervention, and the benefit increased gradually and further with the duration of treatment. Our previous study7 also showed that the GPS has similar predictive power to GRACE in predicting MACEs in patients with AMI. In addition to demonstrating, once again, that the GPS had a predictive ability that is not inferior to that of GRACE and that the GPS was an independent risk factor for the MACEs, the results of this study were also the first to explore the predictive ability of the combined diagnostic model of the GPS plus GRACE through ROC analysis; the combined model tended to have a higher predictive value than each individual score, although the differences were not statistically significant. In addition, the cutoff values of H-CRP and albumin in the GPS were derived using prognosis data from cancer patients. Therefore, another aim of this present study was to investigate the cutoff values of H-CRP and albumin suitable for the prognosis of patients with AMI. Unfortunately, RGPS, as defined by the data from previous studies, was slightly less predictive of MACEs in AMI patients than the GPS in both the overall and subgroup results. The possible reason for this is that our previous study also had a small sample size, so the cutoff values for H-CRP and albumin in the RGPS were not accurately obtained. Although further optimization of the GPS has not been completed, this finding also implies that this current GPS has a good predictive value for the prognosis of patients with AMI.
Thrombosis is also considered a key factor affecting the prognosis of patients with MI. Platelet count is associated with the risk of cardiovascular events, and its elevation is thought to be associated with thrombosis [7, 26, 27]. Lymphocyte counts, in addition to exerting immune functions, also been suggested to be associated with prognosis in patients with coronary artery disease (CAD). Drobni et al. [28] investigated lymphocyte counts in relation to patients with myocarditis and found that low levels of lymphocyte counts were associated with the occurrence of MACEs. Another prospective cohort study [29] aimed to investigate the ability of leukocytes to predict long-term outcome in patients with multivessel CAD, and its results also suggested that lymphocyte count was an independent risk factor for death. PLR, as the ratio of platelet count to lymphocyte count, has recently been reported by several studies to have a good ability to predict the prognosis of patients with ACS [12–14]. Arcy et al. [14] found that a high PLR (>137) was associated with a higher in-hospital risk MACEs than a low PLR (<137) in patients with AMI, and the PLR was an independent risk factor for MACEs. Additionally, Maimaiti et al. [12] found that a high PLR (>165.33) was associated with a higher in-hospital risk of MACEs than a low PLR (<165.33) in patients with MI with anterior descending artery disease. However, our present study found that the PLRS could not effectively predict MACEs in patients with AMI. Part of the reason may be that the definition of MACEs as a composite endpoint differed in different studies, and the trials by Arcy et al. and/or Maimaiti et al. did not include outcomes such as stroke and cardiovascular death. The different populations included may also be one of the reasons. Maimaiti et al. included only patients with anterior descending artery disease and myocardial infarction. In other words, patients with single vessel disease were included. Compared with patients with multiple vessel disease, the difference in coronary microcirculation function and ischemic preconditioning may have an impact on the outcome. In addition, the PLRS in this study was derived from the data from our previous study because it belonged to a small sample trial, so the selection of cutoff values for platelets and lymphocytes in the PLRS were not accurate, and MACEs could not be predicted statistically by redefining the cutoff values of the PLRS (Arcy) to 137 or (Maimaiti) 165.33 (Supplementary Figure 5 and Supplementary Table 8). Another important reason may be the different follow-up times in the various studies. A prospective cohort study [13] showed that with the increase of follow-up time, the incidence of cardiovascular events in patients with a high PLR was higher than that in patients with a low PLR. The results of another study [30] also showed that during hospitalization, the level of PLR had no correlation with cardiovascular mortality, whereas after one month of follow-up, high levels of PLR seemed to have higher cardiovascular mortality than low levels of PLR. And after six months of follow-up, high-level PLR had higher cardiovascular mortality compared with low-level PLR accompanied by statistical difference. Interestingly, the diagnostic model of GPS combined with GRACE tended to have higher predictive value than individual scores. But building into a triple diagnostic model consisting of GPS, GRACE and PLRS could further improve prediction of risks of MACEs. Although some studies have indicated the PLRS to be a possible indicator of the long-term prognosis of cardiovascular events, there is controversy about the predictive ability of MACEs during hospitalization [12, 14, 30]. Our results showed that although the PLRS could not independently predict MACEs during hospitalization, it could further optimize the predictive ability of the combined model with the GPS and GRACE. We also revisited data from the previous study7 to assess the predictive value of GPS, GRACE and PLRS for AMI and found similar results (data not shown).
The results of the subgroup analysis suggested that both the GPS and GRACE had similar predictive abilities for MACEs during hospitalization, regardless of inclusion in the STEMI and NSTEMI group, the PCI or non-PCI group, or the infection or noninfection group, while the PLRS could not effectively predict MACEs. Compared with the RGPS, the GPS still seemed to have better prediction ability. In addition, pairwise comparisons in the multivariate ROC analysis were performed for each subgroup, and the results were generally consistent with the overall results, which demonstrated the robustness of the results of this study.
The current study has some limitations. First, it was a single-center, small-sample trial. Second, we only observed MACEs during hospitalization, and long-term follow-up would give a more comprehensive evaluation. In addition, the optimization of the cutoff values for H-CRP and albumin in the GPS was not completed, and the cutoff values of the PLRS varied greatly among different studies, which may have affected the prediction of MACEs by the joint diagnostic model.
Overall, our study showed that the combined diagnostic model including the GPS plus GRACE and the PLRS had better predictive ability for MACEs during hospitalization compared with that of each individual score. Thus, the use of a combined model with the GPS plus GRACE and the PLRS will be of clinical benefit in a broad group of individuals with AMI. However, large, multicenter, and prospective studies still need to be performed to clarify the predictive power of the combined diagnostic model for patients with AMI during hospitalization and follow-up and to further optimize this model.
Supplementary Materials
Author Contributions
Designed the study: Jinyu Huang and Houyong Zhu. Performed the study: Xiaoqun Xu and Long Cai. Verified the data: Beibei Gao and Xiaoqun Xu. Analyzed the data: Shibiao Ding and Fengwei Zhang. Wrote the paper: Xiaoqun Xu and Long Cai. Revised the paper: Tielong Chen, Jinyu Huang and Houyong Zhu.
Conflicts of Interest
The authors declare that they have no conflicts of interest.
Funding
This study was supported by the Science Technology Department of Zhejiang Province (2019C03SA100640 and 2020C0318), the Zhejiang Health Commission (2021KY916), the Hangzhou Science and Technology Bureau (A20200624 and 20201203B178), the Hangzhou Red Cross Hospital Young Fund (HHQN2021006), and the Hangzhou Key Discipline of Integrated Traditional Chinese and Western Medicine. The sponsors played no role in the study design, data collection and analysis, or decision to submit the article for publication.
References
- 1. Chen WW, Gao RL, Liu LS. Summary of China Cardiovascular Disease Report 2016. Chinese Circulation Journal. 2017; 32:521–30.
- 2. Ibanez B, James S, Agewall S, Antunes MJ, Bucciarelli-Ducci C, Bueno H, Caforio AL, Crea F, Goudevenos JA, Halvorsen S, Hindricks G, Kastrati A, Lenzen MJ, et al, and ESC Scientific Document Group. 2017 ESC Guidelines for the management of acute myocardial infarction in patients presenting with ST-segment elevation: The Task Force for the management of acute myocardial infarction in patients presenting with ST-segment elevation of the European Society of Cardiology (ESC). Eur Heart J. 2018; 39:119–77. https://doi.org/10.1093/eurheartj/ehx393 [PubMed]
- 3. O’Gara PT, Kushner FG, Ascheim DD, Casey DE
Jr , Chung MK, de Lemos JA, Ettinger SM, Fang JC, Fesmire FM, Franklin BA, Granger CB, Krumholz HM, Linderbaum JA, et al, and American College of Cardiology Foundation/American Heart Association Task Force on Practice Guidelines. 2013 ACCF/AHA guideline for the management of ST-elevation myocardial infarction: a report of the American College of Cardiology Foundation/American Heart Association Task Force on Practice Guidelines. Circulation. 2013; 127:e362–425. https://doi.org/10.1161/CIR.0b013e3182742cf6 [PubMed] - 4. Anderson JL, Adams CD, Antman EM, Bridges CR, Califf RM, Casey DE
Jr , Chavey WE 2nd, Fesmire FM, Hochman JS, Levin TN, Lincoff AM, Peterson ED, Theroux P, et al, and American College of Cardiology, and American Heart Association Task Force on Practice Guidelines (Writing Committee to Revise the 2002 Guidelines for the Management of Patients With Unstable Angina/Non-ST-Elevation Myocardial Infarction), and American College of Emergency Physicians, and Society for Cardiovascular Angiography and Interventions, and Society of Thoracic Surgeons, and American Association of Cardiovascular and Pulmonary Rehabilitation, and Society for Academic Emergency Medicine. ACC/AHA 2007 guidelines for the management of patients with unstable angina/non-ST-Elevation myocardial infarction: a report of the American College of Cardiology/American Heart Association Task Force on Practice Guidelines (Writing Committee to Revise the 2002 Guidelines for the Management of Patients With Unstable Angina/Non-ST-Elevation Myocardial Infarction) developed in collaboration with the American College of Emergency Physicians, the Society for Cardiovascular Angiography and Interventions, and the Society of Thoracic Surgeons endorsed by the American Association of Cardiovascular and Pulmonary Rehabilitation and the Society for Academic Emergency Medicine. J Am Coll Cardiol. 2007; 50:e1–157. https://doi.org/10.1016/j.jacc.2007.02.013 [PubMed] - 5. Bassand JP, Hamm CW, Ardissino D, Boersma E, Budaj A, Fernández-Avilés F, Fox KA, Hasdai D, Ohman EM, Wallentin L, Wijns W, Vahanian A, Camm J, et al, and Task Force for Diagnosis and Treatment of Non-ST-Segment Elevation Acute Coronary Syndromes of European Society of Cardiology. Guidelines for the diagnosis and treatment of non-ST-segment elevation acute coronary syndromes. Eur Heart J. 2007; 28:1598–660. https://doi.org/10.1093/eurheartj/ehm161 [PubMed]
- 6. Fox KA, Carruthers KF, Dunbar DR, Graham C, Manning JR, De Raedt H, Buysschaert I, Lambrechts D, Van de Werf F. Underestimated and under-recognized: the late consequences of acute coronary syndrome (GRACE UK-Belgian Study). Eur Heart J. 2010; 31: 2755–64. https://doi.org/10.1093/eurheartj/ehq326 [PubMed]
- 7. Zhu H, Li Z, Xu X, Fang X, Chen T, Huang J. Predictive value of three Inflammation-based Glasgow Prognostic Scores for major cardiovascular adverse events in patients with acute myocardial infarction during hospitalization: a retrospective study. PeerJ. 2020; 8:e9068. https://doi.org/10.7717/peerj.9068 [PubMed]
- 8. Pearson TA, Mensah GA, Alexander RW, Anderson JL, Cannon RO 3rd, Criqui M, Fadl YY, Fortmann SP, Hong Y, Myers GL, Rifai N, Smith SC
Jr , Taubert K, et al, Centers for Disease Control and Prevention, and American Heart Association. Markers of inflammation and cardiovascular disease: application to clinical and public health practice: A statement for healthcare professionals from the Centers for Disease Control and Prevention and the American Heart Association. Circulation. 2003; 107:499–511. https://doi.org/10.1161/01.cir.0000052939.59093.45 [PubMed] - 9. Djoussé L, Rothman KJ, Cupples LA, Levy D, Ellison RC. Serum albumin and risk of myocardial infarction and all-cause mortality in the Framingham Offspring Study. Circulation. 2002; 106:2919–24. https://doi.org/10.1161/01.cir.0000042673.07632.76 [PubMed]
- 10. Kawai Y, Masutani K, Torisu K, Katafuchi R, Tanaka S, Tsuchimoto A, Mitsuiki K, Tsuruya K, Kitazono T. Association between serum albumin level and incidence of end-stage renal disease in patients with Immunoglobulin A nephropathy: A possible role of albumin as an antioxidant agent. PLoS One. 2018; 13:e0196655. https://doi.org/10.1371/journal.pone.0196655 [PubMed]
- 11. Fernández J, Clària J, Amorós A, Aguilar F, Castro M, Casulleras M, Acevedo J, Duran-Güell M, Nuñez L, Costa M, Torres M, Horrillo R, Ruiz-Del-Árbol L, et al. Effects of Albumin Treatment on Systemic and Portal Hemodynamics and Systemic Inflammation in Patients With Decompensated Cirrhosis. Gastroenterology. 2019; 157:149–62. https://doi.org/10.1053/j.gastro.2019.03.021 [PubMed]
- 12. Maimaiti A, Li Y, Wang YT, Yang X, Li XM, Yang YN, Ma YT. Association of platelet-to-lymphocyte count ratio with myocardial reperfusion and major adverse events in patients with acute myocardial infarction: a two-centre retrospective cohort study. BMJ Open. 2019; 9:e025628. https://doi.org/10.1136/bmjopen-2018-025628 [PubMed]
- 13. Zhou D, Fan Y, Wan Z, Wen W, Wang X, Zhou J, Chen T, Yuan Z. Platelet-to-Lymphocyte Ratio Improves the Predictive Power of GRACE Risk Score for Long-Term Cardiovascular Events in Patients with Acute Coronary Syndrome. Cardiology. 2016; 134:39–46. https://doi.org/10.1159/000442939 [PubMed]
- 14. Ayça B, Akin F, Okuyan E. Platelet to lymphocyte ratio as a prognostic marker in primary percutaneous coronary intervention. Platelets. 2015; 26:816. https://doi.org/10.3109/09537104.2015.1015410 [PubMed]
- 15. Sia CH, Leow AS, Tan BY, Low CJ, Kaur R, Yeo TC, Chan MY, Tay EL, Yeo LL, Yap ES, Loh JP. The neutrophil-lymphocyte ratio and platelet-lymphocyte ratio predict left ventricular thrombus resolution in acute myocardial infarction without percutaneous coronary intervention. Thromb Res. 2020; 194:16–20. https://doi.org/10.1016/j.thromres.2020.06.003 [PubMed]
- 16. Toprak C, Tabakci MM, Simsek Z, Arslantas U, Durmus HI, Ocal L, Demirel M, Ozturkeri B, Ozal E, Kargin R. Platelet/lymphocyte ratio was associated with impaired myocardial perfusion and both in-hospital and long-term adverse outcome in patients with ST-segment elevation acute myocardial infarction undergoing primary coronary intervention. Postepy Kardiol Interwencyjnej. 2015; 11:288–97. https://doi.org/10.5114/pwki.2015.55599 [PubMed]
- 17. Obuchowski NA, Zhou XH. Prospective studies of diagnostic test accuracy when disease prevalence is low. Biostatistics. 2002; 3:477–92. https://doi.org/10.1093/biostatistics/3.4.477 [PubMed]
- 18. Li J, Fine J. On sample size for sensitivity and specificity in prospective diagnostic accuracy studies. Stat Med. 2004; 23:2537–50. https://doi.org/10.1002/sim.1836 [PubMed]
- 19. Thygesen K, Alpert JS, Jaffe AS, Simoons ML, Chaitman BR, White HD, and Writing Group on behalf of the Joint ESC/ACCF/AHA/WHF Task Force for the Universal Definition of Myocardial Infarction. Third universal definition of myocardial infarction. Glob Heart. 2012; 7:275–95. https://doi.org/10.1016/j.gheart.2012.08.001 [PubMed]
- 20. Granger CB, Goldberg RJ, Dabbous O, Pieper KS, Eagle KA, Cannon CP, Van De Werf F, Avezum A, Goodman SG, Flather MD, Fox KA, and Global Registry of Acute Coronary Events Investigators. Predictors of hospital mortality in the global registry of acute coronary events. Arch Intern Med. 2003; 163:2345–53. https://doi.org/10.1001/archinte.163.19.2345 [PubMed]
- 21. Fox KA, Dabbous OH, Goldberg RJ, Pieper KS, Eagle KA, Van de Werf F, Avezum A, Goodman SG, Flather MD, Anderson FA
Jr , Granger CB. Prediction of risk of death and myocardial infarction in the six months after presentation with acute coronary syndrome: prospective multinational observational study (GRACE). BMJ. 2006; 333:1091. https://doi.org/10.1136/bmj.38985.646481.55 [PubMed] - 22. Eagle KA, Lim MJ, Dabbous OH, Pieper KS, Goldberg RJ, Van de Werf F, Goodman SG, Granger CB, Steg PG, Gore JM, Budaj A, Avezum A, Flather MD, Fox KA, and GRACE Investigators. A validated prediction model for all forms of acute coronary syndrome: estimating the risk of 6-month postdischarge death in an international registry. JAMA. 2004; 291:2727–33. https://doi.org/10.1001/jama.291.22.2727 [PubMed]
- 23. Tardif JC, Kouz S, Waters DD, Bertrand OF, Diaz R, Maggioni AP, Pinto FJ, Ibrahim R, Gamra H, Kiwan GS, Berry C, López-Sendón J, Ostadal P, et al. Efficacy and Safety of Low-Dose Colchicine after Myocardial Infarction. N Engl J Med. 2019; 381:2497–505. https://doi.org/10.1056/NEJMoa1912388 [PubMed]
- 24. Ridker PM, Everett BM, Thuren T, MacFadyen JG, Chang WH, Ballantyne C, Fonseca F, Nicolau J, Koenig W, Anker SD, Kastelein JJ, Cornel JH, Pais P, et al, and CANTOS Trial Group. Antiinflammatory Therapy with Canakinumab for Atherosclerotic Disease. N Engl J Med. 2017; 377:1119–31. https://doi.org/10.1056/NEJMoa1707914 [PubMed]
- 25. Nidorf SM, Fiolet AT, Mosterd A, Eikelboom JW, Schut A, Opstal TS, The SH, Xu XF, Ireland MA, Lenderink T, Latchem D, Hoogslag P, Jerzewski A, et al, and LoDoCo2 Trial Investigators. Colchicine in Patients with Chronic Coronary Disease. N Engl J Med. 2020; 383:1838–47. https://doi.org/10.1056/NEJMoa2021372 [PubMed]
- 26. Davì G, Patrono C. Platelet activation and atherothrombosis. N Engl J Med. 2007; 357:2482–94. https://doi.org/10.1056/NEJMra071014 [PubMed]
- 27. Gibson CM, Karha J, Murphy SA, James D, Morrow DA, Cannon CP, Giugliano RP, Antman EM, Braunwald E, and TIMI Study Group. Early and long-term clinical outcomes associated with reinfarction following fibrinolytic administration in the Thrombolysis in Myocardial Infarction trials. J Am Coll Cardiol. 2003; 42:7–16. https://doi.org/10.1016/s0735-1097(03)00506-0 [PubMed]
- 28. Drobni ZD, Zafar A, Zubiri L, Zlotoff DA, Alvi RM, Lee C, Hartmann S, Gilman HK, Villani AC, Nohria A, Groarke JD, Sullivan RJ, Reynolds KL, et al. Decreased Absolute Lymphocyte Count and Increased Neutrophil/Lymphocyte Ratio With Immune Checkpoint Inhibitor-Associated Myocarditis. J Am Heart Assoc. 2020; 9:e018306. https://doi.org/10.1161/JAHA.120.018306 [PubMed]
- 29. Zhao X, Jiang L, Xu L, Tian J, Xu Y, Zhao Y, Feng X, Wu Y, Zhang Y, Wang D, Sun K, Xu J, Liu R, et al. Predictive value of in-hospital white blood cell count in Chinese patients with triple-vessel coronary disease. Eur J Prev Cardiol. 2019; 26:872–82. https://doi.org/10.1177/2047487319826398 [PubMed]
- 30. Ugur M, Gul M, Bozbay M, Cicek G, Uyarel H, Koroglu B, Uluganyan M, Aslan S, Tusun E, Surgit O, Akkaya E, Eren M. The relationship between platelet to lymphocyte ratio and the clinical outcomes in ST elevation myocardial infarction underwent primary coronary intervention. Blood Coagul Fibrinolysis. 2014; 25:806–11. https://doi.org/10.1097/MBC.0000000000000150 [PubMed]