


This article has been corrected: The authors replaced the HO-2 panel of the Western blot in Figure 4B, which was accidently mislabeled and duplicated with the HO-2 panel from Figure 2B. Figure 5 was replaced because the original Figure 5 was misprinted with an additional panel at the bottom, which was a partial copy of the above AU 45 mg/kg panel. In addition, the authors corrected Supplementary Figure 3, where the Nrf2 band was misplaced during figure preparation. All replacements were done using representative images from the original sets of experiments. These alterations do not affect the results or conclusions of this work.
The new Figure 4, Figure 5 and Supplementary Figure 3 are presented below.
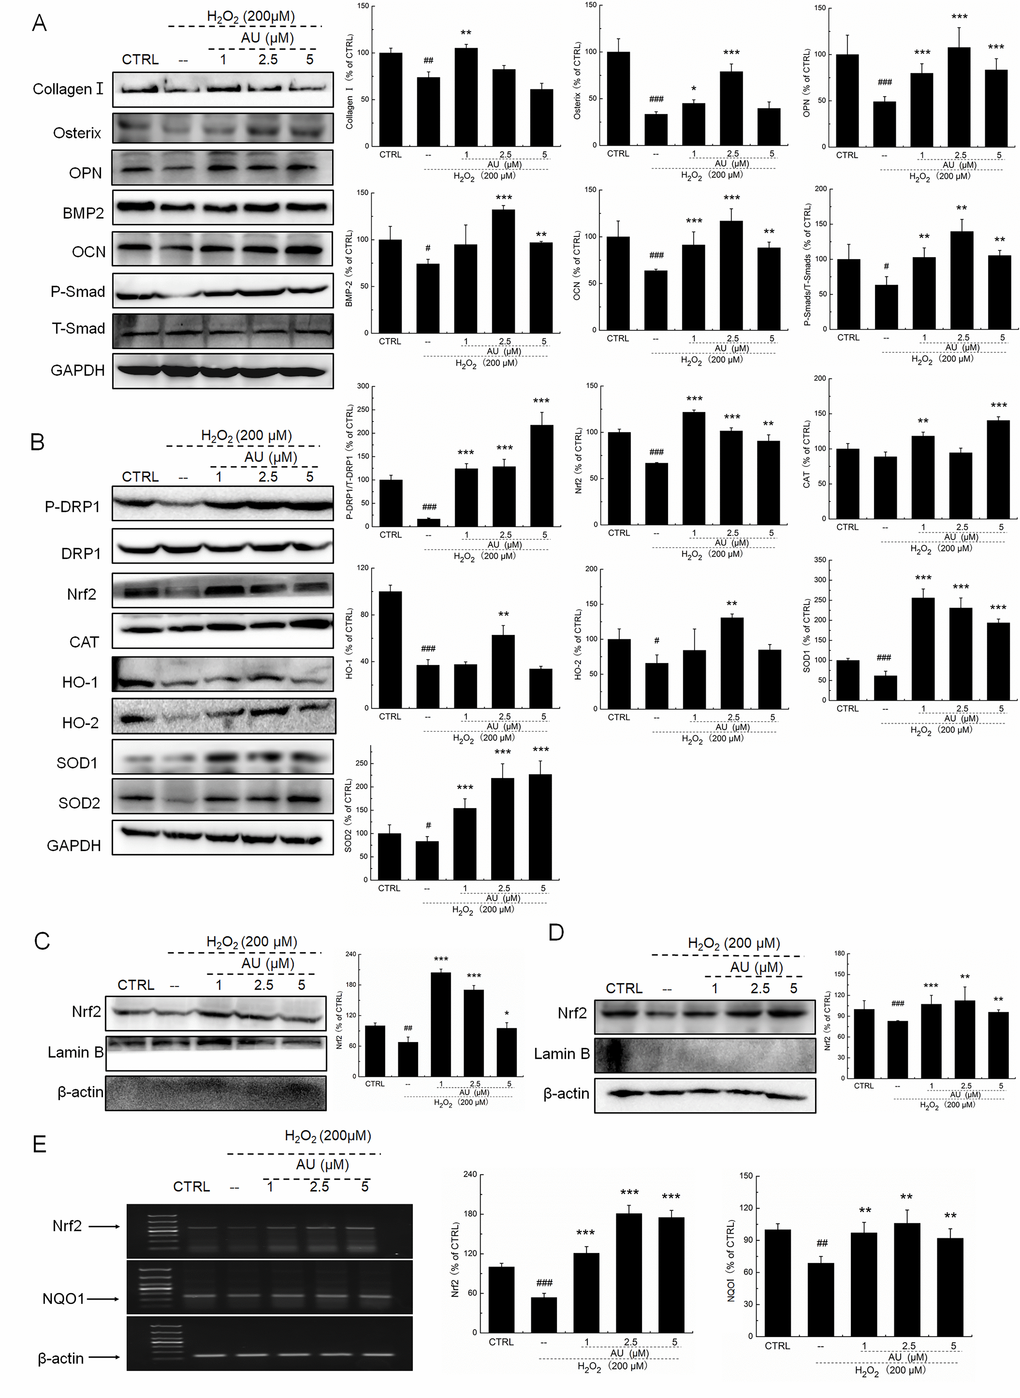
Figure 4. AU protected the H2O2-caused MG63 cells apoptosis via regulation the Nrf2/HO-1 signaling. (A) AU up-regulated the expression levels of osteoblast differentiation related proteins including Collagen I, Osterix, OPN, BMP2, OCN and P-Smad in MG63 cells exposed to H2O2. (B) AU increased the expression levels of proteins within the Nrf2/HO-1 signaling including P-DPR1, Nrf2, CAT, HO-1, HO-2, SOD-1 and SOD-2 in MG63 cells exposed to H2O2. AU enhanced the expression levels of Nrf2 in both (C) nucleus and (D) cytoplasm of MG63 cells exposed to H2O2. The quantification data of proteins were normalized by corresponding GAPDH, Lamin B, β-actin or total proteins, respectively (n=4). (E) AU increased the mRNA levels of Nrf2 and NQO-1 in MG63 cells exposed to H2O2. Marker size from top to bottom: 1000 bp, 700 bp, 500 bp, 400 bp, 300 bp, 200 bp and 100 bp. The data on quantified mRNA expression were normalized to the levels of β-actin (n=4). Data are expressed as mean ± S.D. and analyzed using a one-way ANOVA. # P<0.05, ## P<0.01 and ### P<0.001 vs. control cells, *P<0.05, **P<0.01 and ***P<0.001 vs. H2O2-exposed cells.
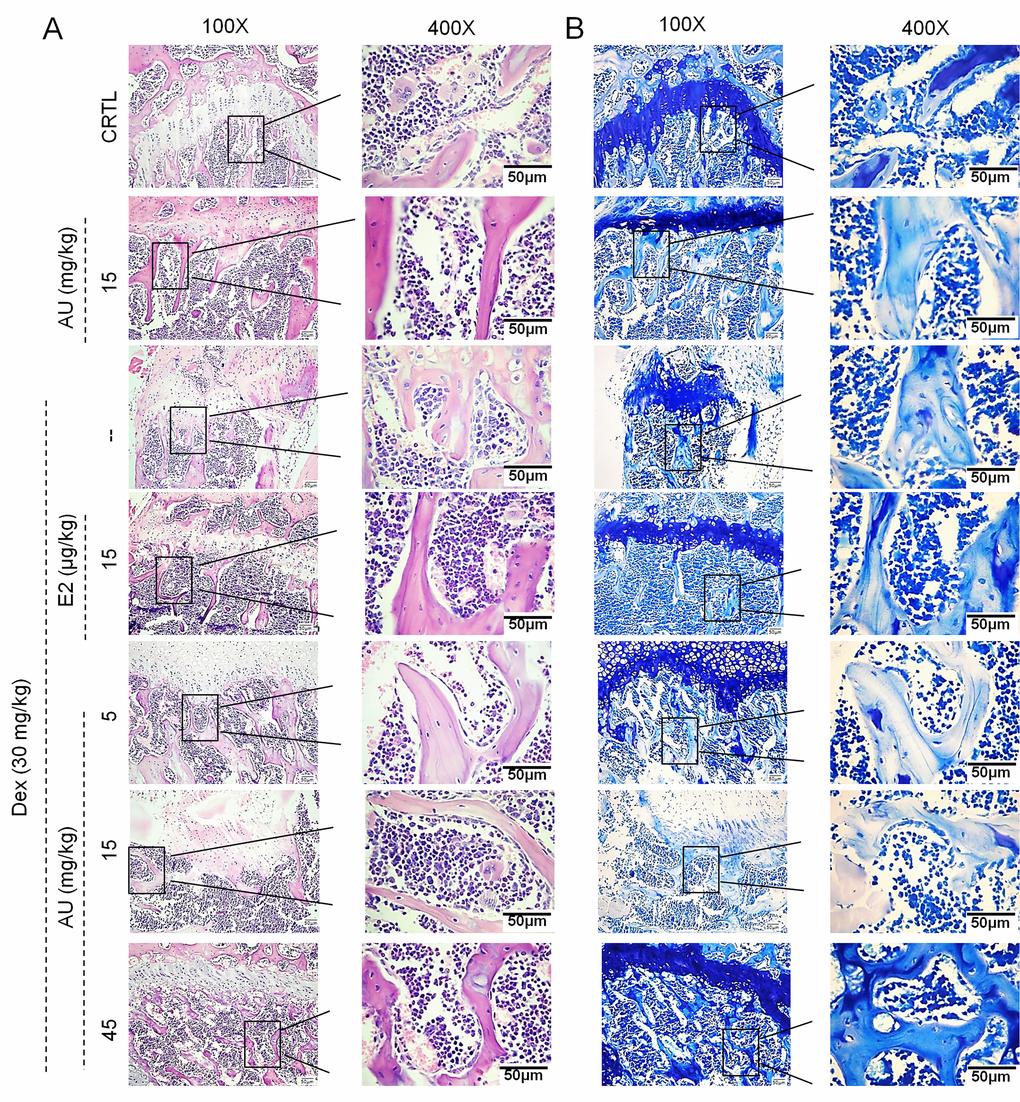
Figure 5. The effects of AU on the femoral histological changes of osteoporotic mice were detected by (A) H&E staining and (B) Giemsa staining (n=6).
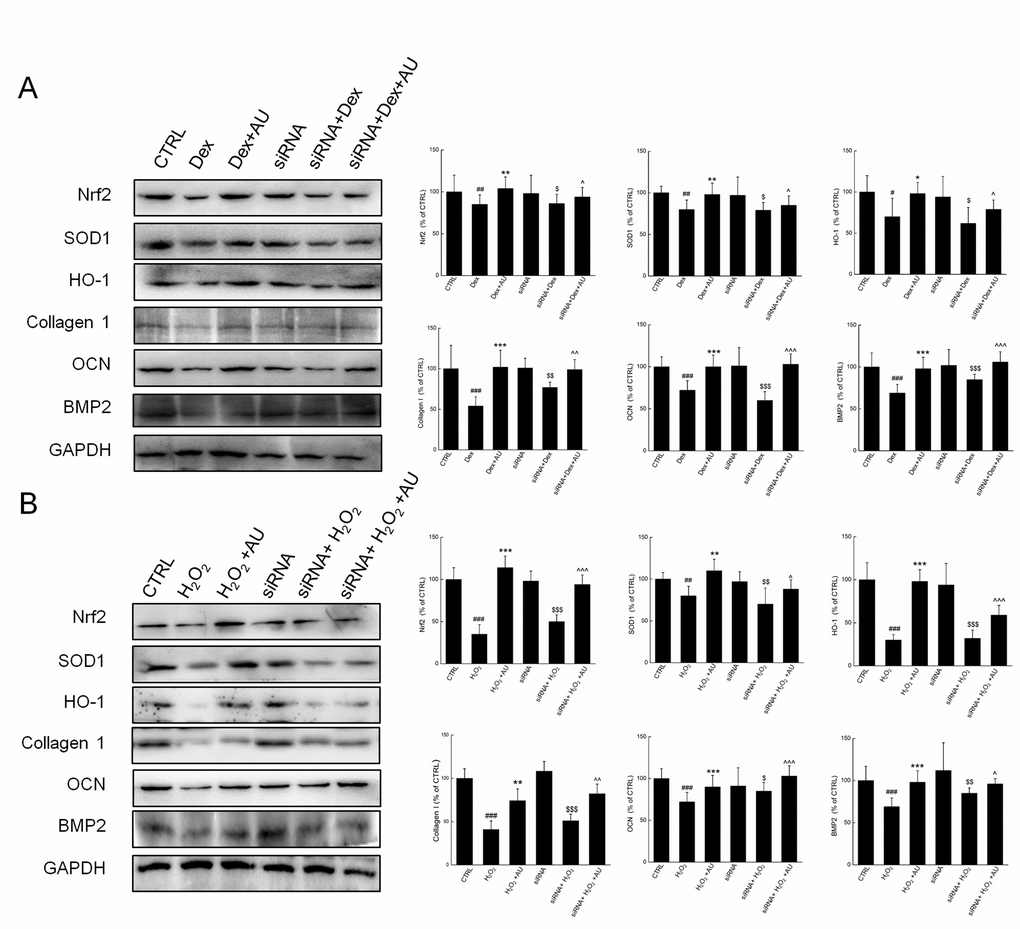
Supplementary Figure 3. Negative siRNA transfection failed to influence the effects of AU on the protein expressions in (A) Dex and (B) H2O2 damaged MG63 cells. The quantification data of proteins were normalized by corresponding GAPDH, respectively, expressed as mean±S.D. (n=4) and analyzed using a one-way ANOVA. # P<0.05, ## P<0.01 and ### P<0.001 vs. control cells, *P<0.05, **P<0.01 and ***P<0.001 vs. Dex or H2O2-exposed cells, $ P<0.05, $$ P<0.01 and $$$ P<0.001 vs. negative siRNA transfected control cells, ^ P<0.05, ^^ P<0.01 and ^^^ P<0.001 vs. Dex or H2O2-exposed negative siRNA transfected cells.