


Introduction
Globally, hepatocellular carcinoma (HCC) ranks fifth in the incidence and ranks second in leading cause of cancer-related deaths of all malignant tumors [1]. There are many factors that can cause HCC, hepatitis B is well known as the main risk factor of HCC, and there are other risk factors such as alcoholic liver disease, hepatitis C and carcinogens for instance aflatoxin [2–5]. The sole radical treatment for HCC is surgical resection [6, 7]. However, most HCC patients are normally diagnosed at intermediate to advanced stages. As such they become ineligible for radical therapies. Besides, the rate of recurrence is high even with surgical resection [7]. At present, it is thus important to determine original prognostic markers and therapeutic targets for HCC.
PPM1D gene, encoding Wip1 phosphatase, is expressed in neutrophils, stem cells, macrophages, hematopoietic progenitors, B and T lymphocytes in peripheral blood and bone marrow [8]. Previous studies indicate that PPM1D is amplified and overexpressed in various tumors and it is hence considered an oncogene [9, 10]. PPM1D is a phosphatase which promote growth and its numerous downstream targets are important tumor promoting factors. In our previous study, we found PPM1D was overexpressed in renal clear cell carcinoma and intrahepatic cholangiocarcinoma. Its overexpression is related to poor prognosis [11–14]. It is also reported that PPM1D is one of underlying prognostic biomarkers and treatment targets for HCC [15]. However, its functions and mechanisms of HCC progression is unknown.
Based on the expression of specific markers, we studied the expression of PPM1D, its association with prognosis of HCC, while level of the various tumor-infiltrating immune cells (TIICs) in this research. Tumor Immune Estimation Resource (TIMER), Gene Expression Profiling Interactive Analysis (GEPIA) and the Kaplan-Meier plotter databases were applied in the analyses above. Our results revealed the vital contribution of PPM1D in HCC prognosis. Besides, they implied that expression of PPM1D might regulate tumor immunity through modulating the infiltration of the immune cells of HCC.
Materials and Methods
PPM1D gene expression database analysis
PPM1D mRNA status of various tumors including HCC and the corresponding normal tissues were identified from the sangerbox database (http://sangerbox.com/Tool). The threshold was established with respect to the following values: P-value of 0.001, fold change of 1.5.
Kaplan-meier plotter database analysis
Our researchers used Kaplan-Meier plotter to establish the correlation between the expression of genes and the survival rates of 21 different tumors from >10,000 tumor samples. We used the Kaplan-Meier plotter to analyse the correlation between PPM1D gene expression and the survival rates of the lung, ovarian, breast, gastric, pancreatic and liver tumors. We select the required conditions according to the default settings to get the required results; and this was foundation of hazard ratios (HR), with log-rank P-values and 95% confidence intervals.
TIMER database analysis
TIMER (https://cistrome.shinyapps.io/timer/) is a systematic database, and we used it to analyse the TIICs in 32 tumor types from >10,000 tumor samples in The Cancer Genome Atlas (TCGA) database systematically (https://cistrome.shinyapps.io/timer/). Foundation on the investigation of the gene expression profiles, TIMER inferred the abundance of the TIICs. PPM1D expression in various tumor types was studied. We also determined the relationship between the status of PPM1D gene and the plenty of the infiltrating immune cells (macrophages, CD8+ T cells, CD4+ T cells, dendritic cells (DCs), B cells and neutrophils), according to the expression of the specific marker gene in various tumors inclusive of HCC. The gene markers for the TIICS included the markers for monocytes, neutrophils, natural killer (NK) cells, tumor-associated macrophages (TAMs), DCs, CD8+ T cells, T cells (general), B cells, T-helper 2 (Th2) cells, T-helper 1 (Th1) cells, M1 macrophages, M2 macrophages, exhausted T cells, T-helper 17 (Th17) cells, follicular helper T (Tfh) cells and regulatory T cells (Tregs). These gene markers were consulted in the prior researches [16–19].
Gene correlation analysis in GEPIA
GEPIA database (http://gepia.cancer-pku.cn/index.html) confirmed the significantly correlated genes in TIMER. It aided in analyzing the RNA expression data of the GTEx and TCGA projects inclusive of 8,587 normal and 9,736 cancer tissue samples. Besides, GEPIA helped in generating the survival curves, which includes disease-free survival (DFS) and overall survival (OS) rates.
Immunohistochemistry
The tissues were fixed by formalin, embedded by paraffin, and sliced into thin sections. Then, we immunostained the tissue sections with a polyclonal anti-Wip1 antibody (Santa Cruz Biotechnology, Santa Cruz, CA, USA), by using standard techniques to detect the expression of Wip1 protein [11]. Afterwards, all tissue sections were read by optical microscopies and evaluated for ≥5 fields at a × 400 magnification independently by more than two pathological professors who were not conscious of any outcome or clinical data. While the cell membrane and cytoplasm stained brown, the tissue sections were considered as wip1 positive. All images were captured by microscopic imaging system (Nikon E1000, Tokyo, Japan).
Statistical analysis
Based on the Sangerbox and TIMER database, the gene expression analysis entailed determination of the ranks, fold changes and P-values. We used Kaplan-Meier plots to generate the survival curves. Gene expression corrections were performed in the GEPIA and TIMER databases by Spearman’s correlation analysis. The statically significant difference was considered when p < 0.05.
Ethics approval and consent to participate
All procedures performed in studies involving human participants were in accordance with the ethical standards of the institutional and/or national research committee and with the 1964 Helsinki declaration and its later amendments or comparable ethical standards. This study was approved by the ethical committee of Hunan Normal University.
Availability of data and materials
Data and materials are included in the manuscript.
Results
The levels of PPM1D mRNA in various human tumors
To determine the differences between PPM1D mRNA expression in normal and tumor tissues, the status of PPM1D mRNA were analyzed through Sangerbox and TIMER database. The results of the analyses demonstrated that the PPM1D expression was higher in various tumors, such as esophageal carcinoma (ESCA), glioblastoma multiforme (GBM), colon adenocarcinoma (COAD), cholangiocarcinoma (CHOL), adrenocortical carcinoma (ACC), stomach adenocarcinoma (STAD), lung adenocarcinoma (LUAD), pancreatic adenocarcinoma (PAAD), brain lower grade glioma (LGG), breast invasive carcinoma (BRCA), hepatocellular carcinoma (HCC), acute myeloid leukemia (LAML), skin cutaneous melanoma (SKCM), testicular germ cell tumors (TGCT), prostate adenocarcinoma (PRAD), kidney renal papillary cell carcinoma (KIRP), kidney renal clear cell carcinoma (KIRC), thyroid carcinoma (THCA) and uterine carcinosarcoma (UCS) tissue; and they were significantly lower in rectum adenocarcinoma (READ), uterine corpus endometrial carcinoma (UCEC), lung squamous cell carcinoma (LUSC) and ovarian serous cystadenocarcinoma (OV) than in the normal tissues, which were shown in Figure 1A. The analysis of TCGA RNA-seq data demonstrated that mRNA expression of PPM1D was significantly lower in BRCA, kidney chromophobe (KICH), lung squamous cell carcinoma (LUSC), COAD, LUAD, THCA, and UCEC comparing with the corresponding normal tissue. Though, PPM1D expression was remarkably higher in HCC in comparison to the corresponding normal tissue (Figure 1B). However, there was difference in the expression of PPM1D in some tumors, such as BRCA, COAD, LUAD and THCA, between the two databases. The results of the two databases consistently show that PPM1D was significantly extremely expressed in CHOL and HCC.
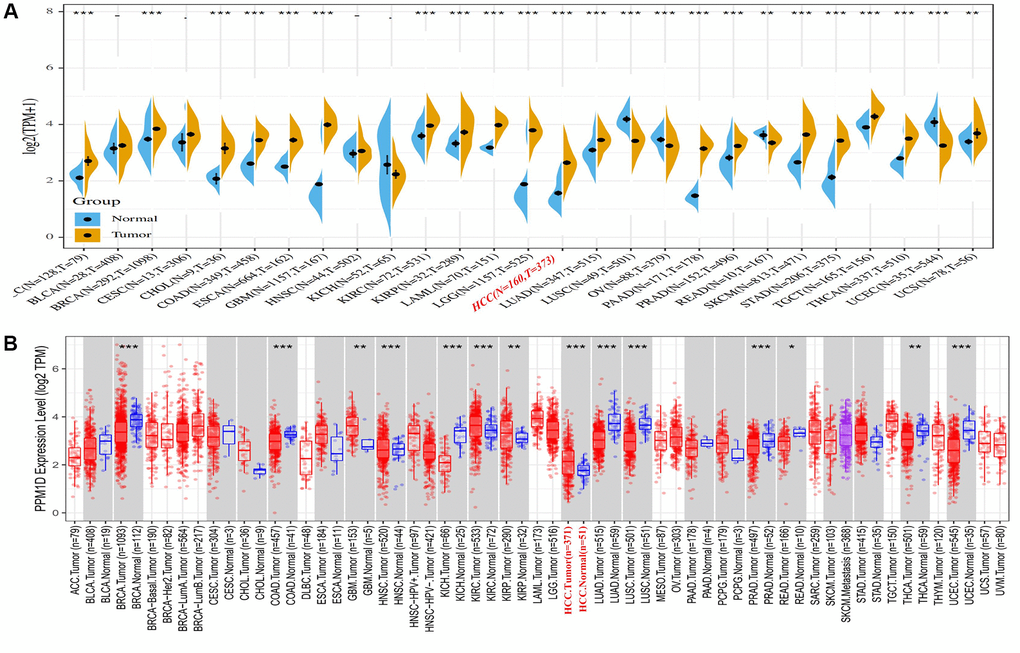
Figure 1. PPM1D expression in different types of human cancers. (A) High or low expression of PPM1D in different human cancer tissues compared with normal tissues using the Sangerbox database. (B) The level of PPM1D expression in different tumor types from the TCGA database in TIMER. Note: *P < 0.05, **P < 0.01, ***P < 0.001. Abbreviations: ACC: Adrenocortical carcinoma; BLCA: Bladder Urothelial Carcinoma; BRCA: Breast invasive carcinoma; CHOL: Cervical and endocervical cancers(CESC), Cholangiocarcinoma; COAD: Colon adenocarcinoma; DLBC: Lymphoid Neoplasm Diffuse Large B-cell Lymphoma; ESCA: Esophageal carcinoma; GBM: Glioblastoma multiforme; HNSC: Head and Neck squamous cell carcinoma; KICH: Kidney Chromophobe; KIRC: Kidney renal clear cell carcinoma; KIRP: Kidney renal papillary cell carcinoma; LAML: Acute Myeloid Leukemia; LGG: Brain Lower Grade Glioma; HCC: Hepatocellular Carcinoma; LUAD: Lung adenocarcinoma; LUSC: Lung squamous cell carcinoma; MESO: Mesothelioma; OV: Ovarian serous cystadenocarcinoma; PAAD: Pancreatic adenocarcinoma; PCPG: Pheochromocytoma and Paraganglioma; PRAD: Prostate adenocarcinoma; READ: Rectum adenocarcinoma; SKCM: Skin Cutaneous Melanoma; STAD: Stomach adenocarcinoma; TGCT: Testicular Germ Cell Tumors; THCA: Thyroid carcinoma; UCEC: Uterine Corpus Endometrial Carcinoma; UCS: Uterine Carcinosarcoma; UVM: Uveal Melanoma.
Prognostic significance of PPM1D expression in cancers
High PPM1D expressions were not associated with OS in HCC (Figure 2A), however the mRNA expressions of PPM1D was significant related with poor prognosis in HCC (PFS: HR = 1.5, 95% CI = 1.12 to 2.02, P = 0.0066; Figure 2B). However, PFS in PAAD (Figure 2F) have no associated with mRNA expression of PPM1D. In gastric cancer, the high PPM1D mRNA expression was significant correlated with better prognosis (Figure 2C, 2D and 2E). These findings imply that the prognostic significance of the status of PPM1D expressions in different tumors is inconsistent (Figure 2).
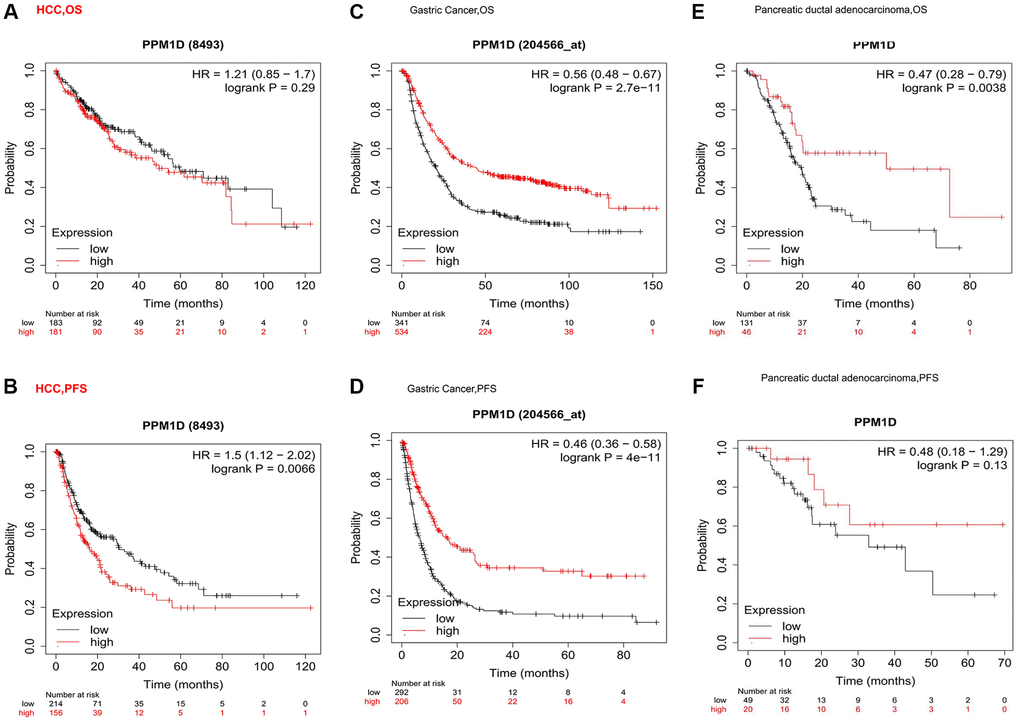
Figure 2. Kaplan-Meier survival curve analysis of the prognostic significance of high and low expression of PPM1D in different types of human cancers using the Kaplan-Meier plotter database (A–F). (A, B) OS and High PPM1D expression was correlated with poor PFS in HCC (n = 364, n = 370). (C, D) Survival curves of OS and PFS survival curves in the gastric cancer (n = 875, n = 498). (E, F) OS and PFS survival curves in the Pancreatic ductal adenocarcinoma (n = 177, n = 69). Abbreviations: OS: overall survival; PFS: progression-free survival.
In some tumors, high expression of PPM1D indicates a poor prognosis such as MESO, high expression of PPM1D in some cancers indicates a good prognosis such as KIRC, and the expression level of PPM1D in some cancers has no correlation with the prognosis such as HNSC (Supplementary Figure 1). The above results suggest that the prognostic significance of PPM1D mRNA expression in various tumors depends on tumor types.
Association of PPM1D expressions with different clinical HCC patients through Kaplan-Meier plotter
Higher expression of PPM1D associated with poor OS, PFS, RFS and DSS (Table 1). Combined with univariate and multivariate analyses of clinicopathological factors affecting PFS of HCC patients (Table 2), we found PPM1D expression was associated with male, non-vascular infiltrating, Asian, and hepatitis virus-infected of HCC patients. In particular, the high PPM1D mRNA expression correlated with worse disease-specific (DSS), recurrence-free (RFS) and progression-free survival (PFS) in stage 1 and AJCC-T 1 of HCC patients. However, the expression of PPM1D does not seem to be related to the prognosis for the middle and late stages of HCC (Table 1).
Table 1. Correlation of PPM1D mRNA expression and prognosis in HCC with different characteristics by Kaplan-Meier plotter.
| Characteristics | OS (n = 364) | PFS (n = 366) | RFS (n = 313) | DSS (n = 357) | ||||||||
| N | Hazard Ratio | P-value | N | Hazard Ratio | p-value | N | Hazard Ratio | p-value | N | Hazard Ratio | p-value | |
| SEX | ||||||||||||
| Male | 246 | 1.87 (0.91–3.87) | 0.085 | 246 | 1.52 (1.05–2.2) | 0.027 | 208 | 1.62 (1.07–2.46) | 0.023 | 241 | 1.87 (0.91–3.87) | 0.085 |
| Female | 118 | 1.69 (0.87–3.27) | 0.120 | 120 | 1.66 (0.98–2.8) | 0.057 | 105 | 1.55 (0.84–2.84) | 0.160 | 116 | 2.12 (1–4.45) | 0.044 |
| STAGE | ||||||||||||
| 1 | 170 | 1.56 (0.85–2.88) | 0.150 | 170 | 2.31 (1.4–3.8) | 0.000 | 153 | 2.19 (1.27–3.76) | 0.004 | 167 | 2.72 (1.12–6.61) | 0.021 |
| 2 | 83 | 1.71 (0.68–4.28) | 0.250 | 84 | 0.8 (0.42–1.51) | 0.490 | 74 | 0.67 (0.34–1.29) | 0.230 | 82 | 2.55 (0.56–9.52) | 0.21 |
| 3 | 83 | 0.65 (0.36–1.18) | 0.150 | 83 | 0.75 (0.44–1.29) | 0.300 | 68 | 0.78 (0.42–1.47) | 0.440 | 81 | 0.65 (0.32–1.34) | 0.24 |
| 4 | 5 | – | – | – | – | – | – | – | – | – | – | – |
| AJCC_T | ||||||||||||
| 1 | 180 | 1.54 (0.86–2.77) | 0.140 | 180 | 2.18 (1.34–3.54) | 0.001 | 160 | 2.06 (1.22–3.49) | 0.006 | 177 | 2.25 (1.01–5.04) | 0.042 |
| 2 | 90 | 1.8 (0.73–4.42) | 0.190 | 92 | 0.77 (0.42–1.41) | 0.400 | 79 | 0.68 (0.36–1.27) | 0.220 | 89 | 2.95 (0.67–12.9) | 0.13 |
| 3 | 78 | 0.58 (0.31–1.09) | 0.086 | 78 | 1.57 (0.76–3.25) | 0.220 | 65 | 0.76 (0.4–1.44) | 0.390 | 75 | 0.52 (0.23–1.18) | 0.11 |
| 4 | 13 | – | – | 13 | – | – | 6 | – | – | 13 | – | – |
| Vascular invasion | ||||||||||||
| None | 203 | 1.72 (1.03–2.87) | 0.036 | 204 | 2.11 (1.33–3.35) | 0.001 | 175 | 1.95 (1.21–3.15) | 0.006 | 200 | 1.81 (0.88–3.71) | 0.099 |
| Micro | 90 | 2.14 (0.93–4.93) | 0.066 | 91 | 1.41 (0.79–2.49) | 0.240 | 81 | 0.52 (0.26–1.01) | 0.050 | 88 | 2.45 (0.76–7.97) | 0.12 |
| Race | ||||||||||||
| white | 181 | 0.73 (0.45–1.18) | 0.190 | 183 | 1.45 (0.98–2.16) | 0.060 | 147 | 1.41 (0.9–2.21) | 0.130 | 177 | 1.34 (0.71–2.52) | 0.37 |
| Asian | 155 | 1.9 (1.03–3.49) | 0.035 | 155 | 1.8 (1.12–2.88) | 0.014 | 143 | 2.01 (1.2–3.36) | 0.007 | 152 | 5.57 (1.31–9.65) | 0.0086 |
| Hepatitis virus | ||||||||||||
| Yes | 150 | 2.17 (1.11–4.28) | 0.021 | 152 | 1.97 (1.24–3.12) | 0.003 | 138 | 2.07 (1.26–3.4) | 0.003 | 149 | 2.75 (1.13–6.69) | 0.02 |
| None | 167 | 1.54 (0.97–2.44) | 0.067 | 167 | 1.54 (0.97–2.44) | 0.067 | 142 | 0.72 (0.43–1.18) | 0.190 | 163 | 2 (0.99–4.05) | 0.049 |
Table 2. Univariate and multivariate analyses of clinicopathological factors affecting PFS of HCC patients.
| Characteristics | Univariate analysis | Multivariate analysis | ||
| HR (95% CI) | P value | HR (95% CI) | P value | |
| SEX | ||||
| Male | 1.52 (1.05–2.2) | 0.027 | 1.42 (0.95–1.8) | 0.069 |
| Female | 1.66 (0.98–2.8) | 0.057 | - | – |
| STAGE | ||||
| 1 | 2.31(1.4–3.8) | 0.00071 | 2.02 (1.6–3.2) | 0.005 |
| 2 | 0.8(0.42–1.51) | 0.49 | – | – |
| 3 | 0.75(0.44–1.29) | 0.3 | – | – |
| AJCC_T | ||||
| 1 | 2.18 (1.34–3.54) | 0.0013 | 1.62 (1.42–2.85) | 0.02 |
| 2 | 0.77 (0.42–1.41) | 0.4 | – | – |
| 3 | 1.57 (0.76–3.25) | 0.22 | – | – |
| Vascular invasion | ||||
| None | 2.11 (1.33–3.35) | 0.0012 | 1.85 (1.45–3.20) | 0.034 |
| Micro | 1.41 (0.79–2.49) | 0.24 | – | – |
| Race | ||||
| White | 1.45 (0.98–2.16) | 0.06 | – | – |
| Asian | 1.8 (1.12–2.88) | 0.014 | 1.62 (0.92–2.45) | 0.32 |
| Hepatitis virus | ||||
| Yes | 1.97 (1.24–3.12) | 0.0033 | 1.52 (0.67–2.86) | 0.47 |
| None | 1.54 (0.97–2.44) | 0.067 | – | – |
The association of the levels of PPM1D with the infiltration level of immune cells in HCC
Based on TIMER database, we analyzed the association of PPM1D mRNA expression with the infiltrating immune cells in 8 types of digestive tumors inclusive of HCC. These results showed the expression of PPM1D mRNA remarkably associated with tumor purity, CD8+ T cells, macrophages, CD4+ T cells, DCs and B cells of them. (Figure 3 and Supplementary Figure 2).
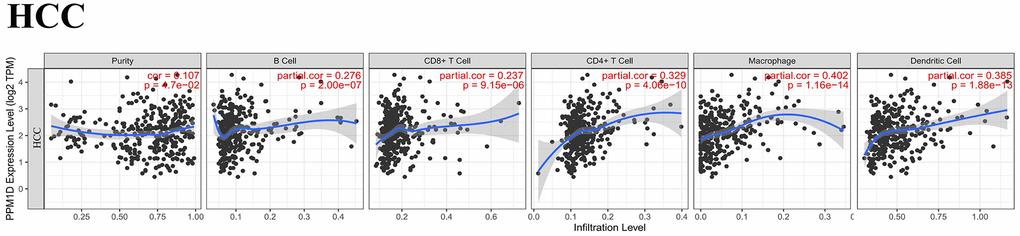
Figure 3. Correlation analysis of PPM1D expression and infiltration levels of immune cells in HCC tissues based on the TIMER database. PPM1D expression in HCC tissues positively correlates with tumor purity and infiltration levels of B cells, CD8+ T cells, CD4+ T cells, macrophages, and DCs.
We also detected that higher PPM1D mRNA expression related with higher immune cells infiltration and worse prognosis in HCC (Figure 3). The PPM1D mRNA expression positively associated with the infiltration rates of the CD4+ T cells (r = 0.329, P = 4.06e-10), CD8+ T cells (r = 0.237, P = 9.15e-06), B cells (r = 0.276, P = 2.00e-07), macrophages (r = 0.402, P = 1.16e-14), and DCs (r = 0.385, p = 1.88e-13) in HCC tissues. These findings indicate that PPM1D is vital in immune cells infiltration in HCC, particularly in macrophages. Although these findings indicate differences in the level of tumor infiltration by the immune cell, the mRNA expression of PPM1D and prognosis in various tumors, the results generally imply that mRNA expression of PPM1D modulates the infiltration of the immune cells to cancer tissues.
Association analysis of PPM1D mRNA expression with the marker of distinct subgroups of immune cell
The relation between PPM1D mRNA expression and the level of TIICs in HCC tissues was analysed based on the GEPIA and TIMER databases. Considering that the analysis of immune infiltration is affected by tumor purity of clinical samples, so we used purity to adjust the analysis (Table 3). The immune cells in HCC tissue including T cells (general), B cells, CD8+ T cells, TAMs, DCs, NK cells, M1 and M2 macrophages, monocytes, Tregs, Th17, Th1, Th2, exhausted T and Tfh cells were analyzed, using CHOL as the control.
Table 3. Correlation analysis between PPM1D and related genes and markers of immune cells in TIMER.
| Description | Gene markers | HCC | CHOL | ||||||
| None | Purity | None | Purity | ||||||
| Core | P | Core | P | Core | P | Core | P | ||
| CD8+ T cell | CD8A | 0.17 | ** | 0.254 | *** | 1.107 | 0.533 | 0.019 | 0.914 |
| CD8B | 0.07 | 0.18 | 0.15 | ** | 0.073 | 0.673 | 0.003 | 0.987 | |
| T cell (general) | CD3D | 0.03 | 0.59 | 0.1 | 0.06 | 0.232 | 0.173 | 0.152 | 0.385 |
| CD3E | 0.1 | 0.06 | 0.206 | *** | 0.172 | 0.315 | 0.066 | 0.705 | |
| CD2 | 0.08 | 0.12 | 0.182 | *** | 0.151 | 0.377 | 0.046 | 0.791 | |
| B cell | CD19 | 0.18 | *** | 0.222 | *** | 0.307 | 0.068 | 0.243 | 0.160 |
| CD79A | 0.14 | ** | 0.238 | *** | 0.287 | 0.090 | 0.221 | 0.203 | |
| Monocyte | CD86 | 0.27 | *** | 0.392 | *** | 0.127 | 0.460 | 0.023 | 0.897 |
| CSF1R | 0.21 | *** | 0.326 | *** | 0.172 | 0.315 | 0.100 | 0.568 | |
| TAM | CCL2 | 0.19 | *** | 0.295 | *** | 0.281 | 0.096 | 0.246 | 0.155 |
| CD68 | 0.18 | *** | 0.255 | *** | 0.181 | 0.289 | 0.132 | 0.449 | |
| IL10 | 0.23 | *** | 0.324 | *** | 0.251 | 0.140 | 0.158 | 0.364 | |
| Ml Macro-phage | NOS2 | 0.21 | *** | 0.223 | *** | 0.307 | 0.069 | 0.312 | 0.068 |
| IRF5 | 0.39 | *** | 0.381 | *** | 0.219 | 0.199 | 0.179 | 0.304 | |
| PTGS2 | 0.28 | *** | 0.404 | *** | 0.383 | 0.021 | 0.338 | 0.046 | |
| M2 Macro-phage | CD163 | 0.28 | *** | 0.393 | *** | 0.392 | 0.018 | 0.343 | 0.044 |
| VSIG4 | 0.18 | *** | 0.285 | *** | 0.28 | 0.099 | 0.216 | 0.213 | |
| MS4A4A | 0.22 | *** | 0.33 | *** | 0.286 | 0.091 | 0.21 | 0.227 | |
| Natural killer cell | KIR2DL1 | 0.06 | 0.23 | 0.058 | 0.28 | -0.202 | 0.237 | –0.239 | 0.166 |
| KIR2DL3 | 0.18 | *** | 0.217 | *** | -0.015 | 0.929 | –0.04 | 0.818 | |
| KIR2DL4 | 0.12 | 0.02 | 0.152 | ** | -0.214 | 0.211 | –0.272 | 0.114 | |
| KIR3DL1 | 0.13 | 0.01 | 0.157 | ** | -0.124 | 0.471 | –0.158 | 0.364 | |
| KIR3DL2 | 0.08 | 0.12 | 0.130 | 0.02 | -0.105 | 0.542 | –0.113 | 0.516 | |
| KIR3DL3 | 0.04 | 0.5 | 0.017 | 0.75 | -0.191 | 0.265 | –0.225 | 0.193 | |
| KIR2DS4 | 0.09 | 0.08 | 0.099 | 0.07 | -0.114 | 0.507 | –0.149 | 0.392 | |
| Dendritic cell | HLA-DPB1 | 0.16 | ** | 0.253 | *** | 0.088 | 0.608 | –0.004 | 0.982 |
| HLA-DQB1 | 0.07 | 0.21 | 0.147 | ** | 0.311 | 0.066 | 0.269 | 0.118 | |
| HLA-DRA | 0.22 | *** | 0.321 | *** | 0.071 | 0.681 | –0.033 | 0.850 | |
| HLA-DPA1 | 0.22 | *** | 0.322 | *** | 0.056 | 0.743 | –0.048 | 0.783 | |
| BDCA-1 | 0.19 | *** | 0.263 | *** | 0.136 | 0.428 | 0.052 | 0.767 | |
| BDCA-4 | 0.51 | *** | 0.541 | *** | 0.515 | ** | 0.484 | ** | |
| CD11c | 0.27 | *** | 0.356 | *** | 0.288 | 0.089 | 0.219 | 0.206 | |
| Th1 | TBX21 | 0.10 | 0.05 | 0.176 | ** | 0.147 | 0.390 | 0.033 | 0.852 |
| STAT4 | 0.18 | *** | 0.232 | *** | 0.099 | 0.564 | 0.04 | 0.820 | |
| STAT1 | 0.41 | *** | 0.446 | *** | 0.4 | * | 0.379 | * | |
| TNF | 0.12 | 0.02 | 0.187 | *** | 0.037 | 0.83 | –0.067 | 0.703 | |
| INF-α | 0.22 | *** | 0.309 | *** | 0.319 | 0.059 | 0.294 | 0.087 | |
| Th2 | GATA3 | 0.16 | ** | 0.280 | *** | 0.046 | 0.79 | –0.082 | 0.638 |
| STAT6 | 0.39 | *** | 0.366 | *** | 0.529 | ** | 0.548 | *** | |
| STAT5A | 0.35 | *** | 0.404 | *** | 0.228 | 0.181 | 0.196 | 0.258 | |
| IL13 | 0.09 | 0.08 | 0.097 | 0.07 | 0.04 | 0.818 | –0.011 | 0.95 | |
| Tfh | BCL6 | 0.41 | *** | 0.401 | *** | 0.407 | * | 0.4 | * |
| IL21 | 0.12 | 0.02 | 0.162 | ** | 0.326 | 0.053 | 0.286 | 0.095 | |
| Th17 | STAT3 | 0.49 | *** | 0.528 | *** | 0.547 | *** | 0.557 | *** |
| IL17A | 0.1 | 0.06 | 0.107 | 0.05 | 0.053 | 0.759 | 0.005 | 0.979 | |
| Treg | FOXP3 | 0.3 | *** | 0.335 | *** | 0.264 | 0.12 | 0.189 | 0.277 |
| CCR8 | 0.43 | *** | 0.513 | *** | 0.344 | * | 0.293 | 0.088 | |
| STAT5B | 0.74 | *** | 0.731 | *** | 0.642 | *** | 0.637 | *** | |
| TGFB1 | 0.21 | *** | 0.297 | *** | 0.307 | 0.069 | 0.265 | 0.124 | |
| T cell exhaustion | PD-1 | 0.14 | ** | 0.198 | *** | 0.203 | 0.234 | 0.157 | 0.369 |
| CTLA4 | 0.11 | 0.03 | 0.186 | *** | 0.225 | 0.186 | 0.171 | 0.325 | |
| LAG3 | 0.11 | 0.04 | 0.149 | ** | 0.08 | 0.64 | 0.005 | 0.977 | |
| TIM-3 | 0.23 | *** | 0.351 | *** | 0.126 | 0.464 | 0.036 | 0.839 | |
| GZMB | 0.04 | 0.43 | 0.075 | 0.17 | 0.039 | 0.823 | –0.058 | 0.742 | |
According to the GEPIA and TIMER databases, PPM1D mRNA expression in HCC tissue remarkably associated with the expression of marker gene due to TAMs, tumor-infiltrating Monocytes, M1 Macrophage, M2 Macrophage, DCs, Th and Treg (Figure 4 and Table 4), while the association was not remarkable in CHOL (Supplementary Figure 3 and Table 4).
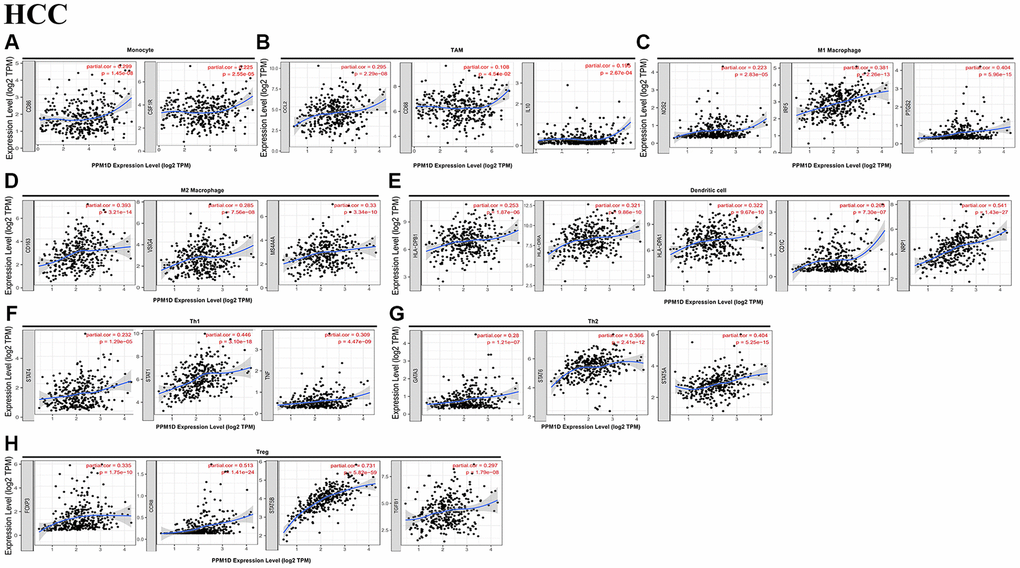
Figure 4. Correlation analysis of PPM1D mRNA expression and the expression of marker genes of infiltrating immune cells in HCC (A–H) using the TIMER database. (A–G) The scatter plots show correlation between PPM1D expression and the gene markers of (A) Monocytes (CD86 and CSF1R); (B) TAMs (CCL2, IL-10 and CD68); (C) M1 Macrophage (NOS2, IRF5 and PTGS2); (D)M2 Macrophage (CD163, VSIG4 and MS4A4A); (E) DCs (HLA-DPB1, HLA-DRA, HLA-DPA1, CD1C and NRP1); (F) Th1 cells (STAT4, STAT1 and TNF); (G) Th2 cells (GATA3, STAT6 and STAT5A) and (H) Tregs (FOXP3, CCR8, STAT5B and TGFB1) in HCC samples (n = 371). PPM1D gene was on the x-axis and the related marker genes were on the y-axis.
Table 4. Correlation analysis between PPM1D and related genes and markers in GEPIA.
| Description | Gene markers | HCC | CHOL | ||||||||||||||||||||||||||||||||||||||||||||||||||||||||||||||||||||||||||||||||||||||||||||||||
| Tumor | Normal | Tumor | Normal | ||||||||||||||||||||||||||||||||||||||||||||||||||||||||||||||||||||||||||||||||||||||||||||||||
| R | P | R | P | R | P | R | P | ||||||||||||||||||||||||||||||||||||||||||||||||||||||||||||||||||||||||||||||||||||||||||||
| Monocyte | CD86 | 0.28 | *** | 0.55 | *** | 0.13 | 0.44 | 0.60 | 0.097 | ||||||||||||||||||||||||||||||||||||||||||||||||||||||||||||||||||||||||||||||||||||||||||
| CD115 | 0.25 | *** | 0.52 | *** | 0.20 | 0.25 | 0.23 | 0.55 | |||||||||||||||||||||||||||||||||||||||||||||||||||||||||||||||||||||||||||||||||||||||||||
| TAM | CCL2 | 0.18 | *** | 0.23 | 0.11 | 0.25 | 0.14 | 0.55 | 0.13 | ||||||||||||||||||||||||||||||||||||||||||||||||||||||||||||||||||||||||||||||||||||||||||
| CD68 | 0.21 | *** | 0.57 | *** | 0.21 | 0.21 | 0.43 | 0.25 | |||||||||||||||||||||||||||||||||||||||||||||||||||||||||||||||||||||||||||||||||||||||||||
| IL10 | 0.25 | *** | 0.39 | ** | 0.29 | 0.08 | 0.38 | 0.32 | |||||||||||||||||||||||||||||||||||||||||||||||||||||||||||||||||||||||||||||||||||||||||||
| Ml Macrophage | iNOS | 0.25 | *** | 0.14 | 0.33 | 0.37 | * | –0.10 | 0.80 | ||||||||||||||||||||||||||||||||||||||||||||||||||||||||||||||||||||||||||||||||||||||||||
| IRF5 | 0.38 | *** | 0.26 | 0.07 | 0.21 | 0.22 | 0.25 | 0.52 | |||||||||||||||||||||||||||||||||||||||||||||||||||||||||||||||||||||||||||||||||||||||||||
| M2 Macrophage | VSIG4 | 0.17 | ** | 0.43 | ** | 0.30 | 0.08 | 0.05 | 0.91 | ||||||||||||||||||||||||||||||||||||||||||||||||||||||||||||||||||||||||||||||||||||||||||
| MS4A4A | 0.22 | *** | 0.50 | *** | 0.30 | 0.08 | 0.13 | 0.74 | |||||||||||||||||||||||||||||||||||||||||||||||||||||||||||||||||||||||||||||||||||||||||||
| Dendritic cell | HLA-DPB1 | 0.18 | *** | 0.45 | *** | 0.10 | 0.57 | 0.13 | 0.74 | ||||||||||||||||||||||||||||||||||||||||||||||||||||||||||||||||||||||||||||||||||||||||||
| HLA-DQB1 | –0.05 | 0.38 | 0.20 | 0.17 | 0.24 | 0.16 | 0.20 | 0.61 | |||||||||||||||||||||||||||||||||||||||||||||||||||||||||||||||||||||||||||||||||||||||||||
| HLA-DRA | 0.22 | *** | 0.47 | *** | 0.042 | * | 0.18 | 0.64 | |||||||||||||||||||||||||||||||||||||||||||||||||||||||||||||||||||||||||||||||||||||||||||
| HLA-DPA1 | 0.22 | *** | 0.46 | *** | 0.026 | 0.88 | 0.12 | 0.78 | |||||||||||||||||||||||||||||||||||||||||||||||||||||||||||||||||||||||||||||||||||||||||||
| BDCA-1(CD1C) | 0.18 | *** | 0.31 | * | 0.073 | 0.67 | 0.05 | 0.91 | |||||||||||||||||||||||||||||||||||||||||||||||||||||||||||||||||||||||||||||||||||||||||||
| CD11c(ITGAX) | 0.30 | *** | 0.40 | ** | 0.30 | 0.07 | 0.62 | 0.09 | |||||||||||||||||||||||||||||||||||||||||||||||||||||||||||||||||||||||||||||||||||||||||||
| “R” is a correlation coefficient, the higher the value, the stronger the correlation. | |||||||||||||||||||||||||||||||||||||||||||||||||||||||||||||||||||||||||||||||||||||||||||||||||||
The mRNA expression of PPM1D revealed that the association with the expression of the markers of particular immune cell including the monocyte marker, such as CD86 (r = 0.392; P = 3.77e-14), IRF5 (r = 0.381; P = 2.26e-13), COX2 (r = 0.404; P = 5.96e-15), CD163 (r = 0.393; P = 3.21e-14), BDCA-4 (r = 0.541; P = 1.43e-27), STAT1 (r = 0.446; P = 3.10e-18), STAT6 (r = 0.366; P = 2.41e-12), STAT5A (r = 0.404; P = 5.25e-15), CCR8 (r = 0.513; P = 1.41e-24), and STAT5B (r = 0.731; P = 5.82e-59) (Table 1). These findings imply that PPM1D mRNA expression correlated with infiltration of the immune cell in HCC.
Immunohistochemical examination about the expression of Wip1 in HCC samples
We collected 40 patient specimens for immunohistochemical examination and completed the follow-up work. All the patients were divided into two groups with good prognosis and poor prognosis by the median survival time. Then the expression levels of Wip1 were analyzed in the two groups. Wip1 was highly expressed in hepatocellular carcinoma compared with precancerous tissue (Figure 5). There were 6 patients with high wip1 expression in good prognosis group, and 15 patients with high wip1 expression in poor prognosis group. In summary, higher expressions of Wip1 were intently correlated to worse prognosis, as shown in Table 5.
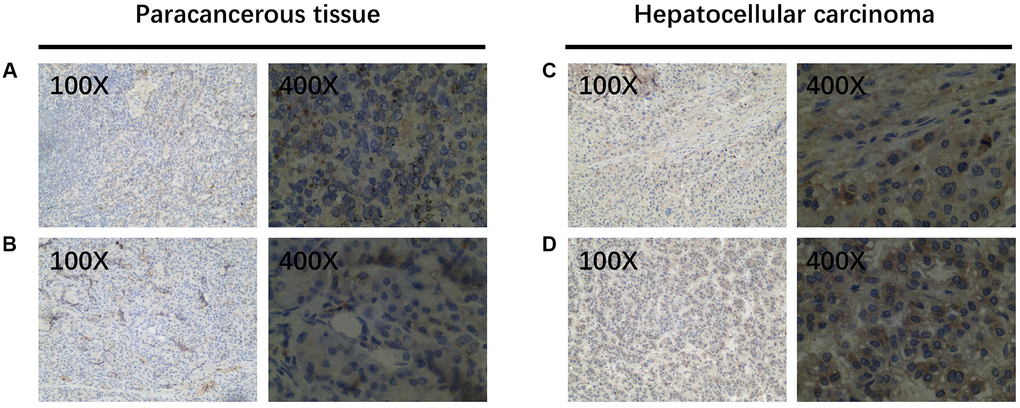
Figure 5. WIP1 expression in paracancerous and hepatocellular carcinoma tissues. (A, B) Wip1 is low expressed in paracancerous tissues; (C, D) Wip1 is highly expressed in tumor tissues.
Table 5. The relationship between Wip1 expression and prognosis in HCC.
| Prognosis | Wip1 expression | χ2 | P value | |
| Low | High | |||
| Good prognosis | 14 | 6 | 8.120 | 0.004 |
| Poor prognosis | 5 | 15 | ||
Discussion
This study illustrated that mRNA expression of PPM1D were correlated with several human cancer prognosis. High PPM1D mRNA levels correlated with poor prognosis in HCC. Furthermore, PPM1D mRNA levels associated with the level of TIICs, with respect to the status of the markers for the various immune cell types in HCC. These findings suggested that PPM1D is an underlying prognostic marker for HCC and other tumors.
The Sangerbox, TIMER, GEPIA, and Kaplan-Meier Plotter databases were used to study the status of PPM1D mRNA in tumor tissue. The analysis demonstrated that PPM1D expression was significantly upregulated in most cancers. However, the expression of PPM1D differed in various cancers. This reflects differences in different methods of data collection as well as hidden causative mechanism. Furthermore, our results of PPM1D expression was consistent in HCC tissues with other databases. Moreover, we also found PPM1D protein was upregulated in HCC tissue than the paracancerous tissue. The GEPIA database gene expression analysis revealed that higher PPM1D expression related with worse prognosis in cancers including HCC, BLCA, CESC, MESO and UVM. Besides, Kaplan-Meier Plotter analysis disclosed that PPM1D higher expression related with worse prognosis in HCC. Through immunohistochemistry, we also verified the high expression of PPM1D protein. The high PPM1D expression related with poor prognosis of the patients in early stage (stage 1 and AJCC_1), and long PFS and OS in HCC patients with low PPM1D expression (Table 1). The findings imply that PPM1D is one of underlying prognostic markers for HCC, especially for patients in early stage.
Dissimilar to traditional tumor treatments such as chemotherapy and radiotherapy, immunotherapy is an innovative treatment method that dynamically regulates the immune system to attack tumor cells in diverse targets and directions [20]. In various basic experiments and clinical researches, it has been found that immunotherapy does have an incomparable advantage over traditional cancer treatments, and can prolong OS and PFS [21]. Current research shows that immunotherapy also plays a significant role in HCC [22, 23]. In recent years, immune checkpoint inhibitors (anti-CTLA-4, anti-PD-1 and anti-PD-L1 antibodies) have shown therapeutic potentiality on advanced HCC [24, 25]. Therefore, an in-depth understanding of tumor immune infiltration can help provide prognostic predictors for immunotherapy, and provide more precise and individualized treatment for HCC.
A previous study showed that a PPM1D-deficient mouse has defective immune response [26]. There was cumulative evidence suggested that a PPM1D-deficient mouse has immune response deficiency [27], neutrophil migration and development via p38-MAPK-STAT1 pathway [28]; macrophage migration and phagocytosis [29]; dendritic spine memory and morphology via p53MAPK signaling. PPM1D mutations assembled in H3F3A-mutated malignant brainstem gliomas, and high intratumoral CD8+ T cell density was less common in the H3F3A-mutated tumors. Moreover, patients with H3F3A-mutated tumors experienced worse prognoses in comparison to other patients. It is speculated that PPM1D may be related to poor prognosis resulting from low intracranial CD8+ T cells [30].
Our study demonstrates that higher PPM1D expression correlated with worse prognosis in HCC and infiltration of different types of immune cell inclusive of CD4+, CD8+ T cells, macrophages, B cells and DCs. As an important component of the tumor microenvironment, TAM play a vital role in immune regulation. The increase of TAM and PD-L1 in liver cancer shows the characteristics of immune escape [31]. We established the relationship between expression of PPM1D mRNA and TAM markers, IL-10 and CD68, and iNOS, M1 macrophage marker, IRF5 and COX2. This implies that PPM1D activates the infiltration and TAM’s activity. PPM1D expression was also associated with the expression of the markers various subsets of Th cells, including Tregs (FOXP3, STAT5B and TGF-β), Tfh (BCL6), and Th1 (STAT-1, STAT-4 and TNF-α), Th2 (GATA3, STAT6, STAT35A). This suggests the vital contribution of the PPM1D in adjusting tumor-infiltration of the Th cells. Besides, the expression of the deficient T cells marker, TIM-3 and PD-1, which were critical inhibitory immune checkpoint proteins definitely associated with the PPM1D expression. Interestingly, PPM1D is highly expressed in HCC and CHOL from Sangerbox and TIMER database., and our previous researches have illustrated that PPM1D is associated with poor prognosis of cholangiocarcinoma [11]. However, the analysis found that PPM1D is not correlated to the immune cell infiltration of CHOL, suggesting that the association of PPM1D on immune cell infiltration has a special role in HCC, which is worthy of further study.
Currently, researchers are concerned about the contribution of PPM1D in HCC. It is reported that mRNA of PPM1D was remarkably higher in HCC than corresponding normal tissue from 86 HCC. The high PPM1D was related to TNM stage, alpha- fetoprotein (AFP) level, tumor size, recurrence incidence and the family history for HCC. Nevertheless, PPM1D expression and age, gender, alcohol intake, lymph node metastasis, hepatitis B virus infection or portal vein invasion did not show any correlation [32]. In this study, we realized that the upregulation of PPM1D correlated with poor prognosis in specific patients who had some specific clinical characteristics inclusive of alcohol consumers, Asians, males, those in early stages (stage 1 and AJCC_1), and the suffering from hepatitis viral infections. The findings in this study consistent with our previous study [11, 14]. However, the credibility of this study could be higher than that of a single-center study since it emanates from multiple databases. In general, our findings imply that a high expression of PPM1D could be related with poor prognosis of HCC.
Final note: Our research has some limitations. The first point is that many of our data sources are previously reported data, not all of our own clinical data. The second point is that some tumors in the database have too few samples.
Conclusions
Our findings suggest that PPM1D might be an underlying prognostic marker for HCC, that could be taken to determine the rate of immune cells infiltration in cancer tissue. The comparatively high levels of PPM1D in HCC and other cancers imply a high risk for tumor relapse after treatment. As such, close medical monitoring is vital for these patients.
Supplementary Materials
Author Contributions
Zhangtao Yu, Zhihua Zhang, Yu Jiang, Lianhong Zou and Xiehong Liu performed the analysis data; Yinghui Song, Nanhui Yu and Le Wang contributed significantly to analysis and manuscript preparation; Chuang Peng and Mengting Cai performed the data analyses and wrote the manuscript; Bo Jiang, Chuang Peng and Sulai Liu contributed to the conception of the study; Zhangtao Yu, Yinghui Song, Xianhai Mao helped perform the analysis with constructive discussions.
Conflicts of Interest
The authors declare no conflicts of interest related to this study.
Funding
This work was financially supported by following funds: Youth Talent of Hunan (Grant No. 2020RC3066); Postdoctoral Innovation Talents Project (NO. 2020RC2064); Hunan Provincial Natural Science Foundation of China (Grant No. 2020JJ5610); Hunan Provincial Development and Reform Commission Project (NO. 2019FGW26); The Project of Improving the Diagnosis and Treatment Capacity of Hepatobiliary, Pancreas and Intestine in Hunan Province (Xiangwei [2019] No. 118); China Postdoctoral Science Foundation (NO.2020M68115/ 2021T140197); Hunan Natural Science Fund for Excellent Young Scholars (NO. 2021JJ20003).
References
- 1. Fitzmaurice C, Dicker D, Pain A, Hamavid H, Moradi-Lakeh M, MacIntyre MF, Allen C, Hansen G, Woodbrook R, Wolfe C, Hamadeh RR, Moore A, Werdecker A, et al, and Global Burden of Disease Cancer Collaboration. The Global Burden of Cancer 2013. JAMA Oncol. 2015; 1:505–27. https://doi.org/10.1001/jamaoncol.2015.0735 [PubMed]
- 2. Makarova-Rusher OV, Altekruse SF, McNeel TS, Ulahannan S, Duffy AG, Graubard BI, Greten TF, McGlynn KA. Population attributable fractions of risk factors for hepatocellular carcinoma in the United States. Cancer. 2016; 122:1757–65. https://doi.org/10.1002/cncr.29971 [PubMed]
- 3. Zhang BH, Yang BH, Tang ZY. Randomized controlled trial of screening for hepatocellular carcinoma. J Cancer Res Clin Oncol. 2004; 130:417–22. https://doi.org/10.1007/s00432-004-0552-0 [PubMed]
- 4. Akinyemiju T, Abera S, Ahmed M, Alam N, Alemayohu MA, Allen C, Al-Raddadi R, Alvis-Guzman N, Amoako Y, Artaman A, Ayele TA, Barac A, Bensenor I, et al, and Global Burden of Disease Liver Cancer Collaboration. The Burden of Primary Liver Cancer and Underlying Etiologies From 1990 to 2015 at the Global, Regional, and National Level: Results From the Global Burden of Disease Study 2015. JAMA Oncol. 2017; 3:1683–91. https://doi.org/10.1001/jamaoncol.2017.3055 [PubMed]
- 5. Fattovich G, Stroffolini T, Zagni I, Donato F. Hepatocellular carcinoma in cirrhosis: incidence and risk factors. Gastroenterology. 2004 (Suppl 1); 127:S35–50. https://doi.org/10.1053/j.gastro.2004.09.014 [PubMed]
- 6. European Association for the Study of the Liver. EASL Clinical Practice Guidelines: Management of hepatocellular carcinoma. J Hepatol. 2018; 69:182–236. https://doi.org/10.1016/j.jhep.2018.03.019 [PubMed]
- 7. Kishi Y, Hasegawa K, Sugawara Y, Kokudo N. Hepatocellular carcinoma: current management and future development-improved outcomes with surgical resection. Int J Hepatol. 2011; 2011:728103. https://doi.org/10.4061/2011/728103 [PubMed]
- 8. Uyanik B, Grigorash BB, Goloudina AR, Demidov ON. DNA damage-induced phosphatase Wip1 in regulation of hematopoiesis, immune system and inflammation. Cell Death Discov. 2017; 3:17018. https://doi.org/10.1038/cddiscovery.2017.18 [PubMed]
- 9. Fiscella M, Zhang H, Fan S, Sakaguchi K, Shen S, Mercer WE, Vande Woude GF, O'Connor PM, Appella E. Wip1, a novel human protein phosphatase that is induced in response to ionizing radiation in a p53-dependent manner. Proc Natl Acad Sci U S A. 1997; 94:6048–53. https://doi.org/10.1073/pnas.94.12.6048 [PubMed]
- 10. Lu X, Nguyen TA, Moon SH, Darlington Y, Sommer M, Donehower LA. The type 2C phosphatase Wip1: an oncogenic regulator of tumor suppressor and DNA damage response pathways. Cancer Metastasis Rev. 2008; 27:123–35. https://doi.org/10.1007/s10555-008-9127-x [PubMed]
- 11. Liu S, Jiang B, Li H, He Z, Lv P, Peng C, Wang Y, Cheng W, Xu Z, Chen W, Liu Z, Zhang B, Shen S, Xiang S. Wip1 is associated with tumorigenity and metastasis through MMP-2 in human intrahepatic cholangiocarcinoma. Oncotarget. 2017; 8:56672–83. https://doi.org/10.18632/oncotarget.18074 [PubMed]
- 12. Liu S, Jiang J, Huang L, Jiang Y, Yu N, Liu X, Lv Y, Li H, Zou L, Peng C, Yu X, Jiang B. iNOS is associated with tumorigenicity as an independent prognosticator in human intrahepatic cholangiocarcinoma. Cancer Manag Res. 2019; 11:8005–22. https://doi.org/10.2147/CMAR.S208773 [PubMed]
- 13. Chen C, Jiang J, Fang M, Zhou L, Chen Y, Zhou J, Song Y, Kong G, Zhang B, Jiang B, Li H, Peng C, Liu S. MicroRNA-129-2-3p directly targets Wip1 to suppress the proliferation and invasion of intrahepatic cholangiocarcinoma. J Cancer. 2020; 11:3216–24. https://doi.org/10.7150/jca.41492 [PubMed]
- 14. Liu S, Qi L, Han W, Wan X, Jiang S, Li Y, Xie Y, Liu L, Zeng F, Liu Z, Zu X. Overexpression of wip1 is associated with biologic behavior in human clear cell renal cell carcinoma. PLoS One. 2014; 9:e110218. https://doi.org/10.1371/journal.pone.0110218 [PubMed]
- 15. Xu Z, Cao C, Xia H, Shi S, Hong L, Wei X, Gu D, Bian J, Liu Z, Huang W, Zhang Y, He S, Lee NP, Chen J. Protein phosphatase magnesium-dependent 1δ is a novel tumor marker and target in hepatocellular carcinoma. Front Med. 2016; 10:52–60. https://doi.org/10.1007/s11684-016-0433-3 [PubMed]
- 16. Henriksson J, Chen X, Gomes T, Ullah U, Meyer KB, Miragaia R, Duddy G, Pramanik J, Yusa K, Lahesmaa R, Teichmann SA. Genome-wide CRISPR Screens in T Helper Cells Reveal Pervasive Crosstalk between Activation and Differentiation. Cell. 2019; 176:882–96.e18. https://doi.org/10.1016/j.cell.2018.11.044 [PubMed]
- 17. Cózar B, Greppi M, Carpentier S, Narni-Mancinelli E, Chiossone L, Vivier E. Tumor-Infiltrating Natural Killer Cells. Cancer Discov. 2021; 11:34–44. https://doi.org/10.1158/2159-8290.CD-20-0655 [PubMed]
- 18. Ngambenjawong C, Gustafson HH, Pun SH. Progress in tumor-associated macrophage (TAM)-targeted therapeutics. Adv Drug Deliv Rev. 2017; 114:206–21. https://doi.org/10.1016/j.addr.2017.04.010 [PubMed]
- 19. Zhang JQ, Zeng S, Vitiello GA, Seifert AM, Medina BD, Beckman MJ, Loo JK, Santamaria-Barria J, Maltbaek JH, Param NJ, Moral JA, Zhao JN, Balachandran V, et al. Macrophages and CD8+ T Cells Mediate the Antitumor Efficacy of Combined CD40 Ligation and Imatinib Therapy in Gastrointestinal Stromal Tumors. Cancer Immunol Res. 2018; 6:434–47. https://doi.org/10.1158/2326-6066.CIR-17-0345 [PubMed]
- 20. Couzin-Frankel J. Breakthrough of the year 2013. Cancer immunotherapy. Science. 2013; 342:1432–33. https://doi.org/10.1126/science.342.6165.1432 [PubMed]
- 21. Tan S, Li D, Zhu X. Cancer immunotherapy: Pros, cons and beyond. Biomed Pharmacother. 2020; 124:109821. https://doi.org/10.1016/j.biopha.2020.109821 [PubMed]
- 22. El Dika I, Khalil DN, Abou-Alfa GK. Immune checkpoint inhibitors for hepatocellular carcinoma. Cancer. 2019; 125:3312–19. https://doi.org/10.1002/cncr.32076 [PubMed]
- 23. Wu X, Gu Z, Chen Y, Chen B, Chen W, Weng L, Liu X. Application of PD-1 Blockade in Cancer Immunotherapy. Comput Struct Biotechnol J. 2019; 17:661–74. https://doi.org/10.1016/j.csbj.2019.03.006 [PubMed]
- 24. Zongyi Y, Xiaowu L. Immunotherapy for hepatocellular carcinoma. Cancer Lett. 2020; 470:8–17. https://doi.org/10.1016/j.canlet.2019.12.002 [PubMed]
- 25. Prieto J, Melero I, Sangro B. Immunological landscape and immunotherapy of hepatocellular carcinoma. Nat Rev Gastroenterol Hepatol. 2015; 12:681–700. https://doi.org/10.1038/nrgastro.2015.173 [PubMed]
- 26. Choi J, Appella E, Donehower LA. The structure and expression of the murine wildtype p53-induced phosphatase 1 (Wip1) gene. Genomics. 2000; 64:298–306. https://doi.org/10.1006/geno.2000.6134 [PubMed]
- 27. Schito ML, Demidov ON, Saito S, Ashwell JD, Appella E. Wip1 phosphatase-deficient mice exhibit defective T cell maturation due to sustained p53 activation. J Immunol. 2006; 176:4818–25. https://doi.org/10.4049/jimmunol.176.8.4818 [PubMed]
- 28. Kamada R, Kudoh F, Yoshimura F, Tanino K, Sakaguchi K. Inhibition of Ser/Thr phosphatase PPM1D induces neutrophil differentiation in HL-60 cells. J Biochem. 2017; 162:303–08. https://doi.org/10.1093/jb/mvx032 [PubMed]
- 29. Tang Y, Liu L, Sheng M, Xiong K, Huang L, Gao Q, Wei J, Wu T, Yang S, Liu H, Mu Y, Li K. Wip1 knockout inhibits the proliferation and enhances the migration of bone marrow mesenchymal stem cells. Exp Cell Res. 2015; 334:310–22. https://doi.org/10.1016/j.yexcr.2015.03.018 [PubMed]
- 30. Zhang Y, Pan C, Wang J, Cao J, Liu Y, Wang Y, Zhang L. Genetic and immune features of resectable malignant brainstem gliomas. Oncotarget. 2017; 8:82571–82. https://doi.org/10.18632/oncotarget.19653 [PubMed]
- 31. Zhu Y, Yang J, Xu D, Gao XM, Zhang Z, Hsu JL, Li CW, Lim SO, Sheng YY, Zhang Y, Li JH, Luo Q, Zheng Y, et al. Disruption of tumour-associated macrophage trafficking by the osteopontin-induced colony-stimulating factor-1 signalling sensitises hepatocellular carcinoma to anti-PD-L1 blockade. Gut. 2019; 68:1653–66. https://doi.org/10.1136/gutjnl-2019-318419 [PubMed]
- 32. Li GB, Zhang XL, Yuan L, Jiao QQ, Liu DJ, Liu J. Protein phosphatase magnesium-dependent 1δ (PPM1D) mRNA expression is a prognosis marker for hepatocellular carcinoma. PLoS One. 2013; 8:e60775. https://doi.org/10.1371/journal.pone.0060775 [PubMed]