


Introduction
About 50 million people worldwide suffer from dementia, and one case of dementia occurs every 3 seconds [1]. Alzheimer’s disease (AD), the most common form of dementia in the elderly, is a kind of neurodegenerative disease. More than 20 million people worldwide are suffering from AD [2, 3]. AD usually manifests symptoms such as cognitive impairment and memory loss [4, 5], and the main pathological manifestation of AD is insoluble neurotoxic aggregates accumulation, including extracellular amyloid plaques formed by amyloid-β and neurofibrillary tangles in nerve cells composed of tau protein [6]. Studies have shown that people with abnormal amyloid have more rapid progression of cognitive decline than that without biomarker evidence of amyloid-β deposition [7–9]. Though amyloid-β can be regarded as the first biomarker becoming abnormal in AD patients [10–13], both amyloid-β and tau protein deposits are required for neuropathologic diagnosis [14, 15]. The traditional diagnosis still has some limitations. So far, the specific pathogenesis of AD is still largely unknown, such as how these proteins are related to each other, and what cause them to accumulate to such destructive levels [1], and its more exactly biological diagnosis is still on the way. Additionally, gene and protein expression profiles changes support the dysfunction during many basic cellular processes in AD pathogenesis [16]. One of the potential mechanisms for altered expression of AD-related genes involves disruption of the epigenome through disease-specific changes in chromatin structure and/or transcriptional programming [17]. These include changes in DNA methylation [18, 19] and histone modification [20–22]. Besides, the diagnosis of AD still faces great difficulties, in which biomarkers are more important than clinical manifestations to provide a breakthrough basis [1].
Chemical modifications in RNA have become an important mechanism for controlling gene expression and protein translation [23]. N6-methyladenosine (m6A) is the most common and reversible post-transcriptional modification of eukaryotic mRNA [24], and it is also a multifunctional regulator of mRNA splicing, localization, translation and stability [25, 26]. Methyltransferases (regarded as m6A “writers”), demethylases (regarded as m6A “erasers”), and binding proteins (regarded as m6A “readers”) selectively recognize methylated RNA to perform regulatory functions [27]. The brain is rich in m6A which plays a broad role in adult brain development and function [28–30]. M6A is proven to be related to nervous system development and neurodegenerative diseases [31–33]. M6A RNA methylation is considered to be a new frontier in neuroscience, which can provide us with a new perspective in the understanding of neurodevelopment and neurological diseases. Moreover, increasing evidence has revealed that the m6A signaling pathway is closely associated with learning and memory, whose impairments are typical clinical manifestations of AD [32, 34–38]. On the other hand, as a neuron surface protein, m6A can promote axon growth, synapse formation and spine induction [39–41]. Insulin-like growth factor 2 mRNA binding protein 2 (IGF2BP2) acts as a reader to regulate m6A [42]. However, whether IGF2BP2 can be used as a marker and auxiliary diagnosis of AD remains to be determined.
Based on the Gene Expression Omnibus database (GEO), we identified m6A regulator IGF2BP2, whose increase is closely related to AD. Furthermore, we conducted modular exploration to explore the potential mechanism of IGF2BP2 in AD. Finally, we constructed and validated a diagnostic model for AD. Our findings suggested that IGF2BP2 may serve as a novel diagnostic biomarker and its increase might associated with AD through m6A mechanism. The gene-based diagnostic model provided us a new way on accurate diagnosis of AD.
Results
M6A reader gene IGF2PB2 was highly expressed in AD
Based on published literature [43, 44], we brought 19 m6A-related genes into our analysis, and the expression levels of these 19 genes were extracted from 624 samples of GSE33000. Differentially expressed analysis showed that among the 19 m6A regulators, the expression of IGF2PB2 in AD patients was significantly higher than that of normal brains (Figure 1A). Further comparison of IGF2PB2 expression between AD and normal samples in three data sets (GSE33000, GSE48350 and GSE5281) also showed that IGF2BP2 expressed more in AD patients than in normal people (GSE33000: log2FoldChange = 0.170, p<2.22e-16, Figure 1B; GSE48350 and GSE5281: log2FoldChange = 1.488, p=1e-11, Figure 1C). Moreover, considering the heterogeneity of brain tissue, we also explored the expression of IGF2BP2 in different brain regions in GSE48350. It showed that IGF2BP2 was highly expressed in entorhinal cortex, hippocampus, postcentral gyrus and superior frontal gyrus in AD patients compared with normal tissue (Figure 1D). These results preliminarily indicated that IGF2PB2 was abnormally highly expressed in AD patients, this phenomenon might be related to the pathogenesis and development of AD.
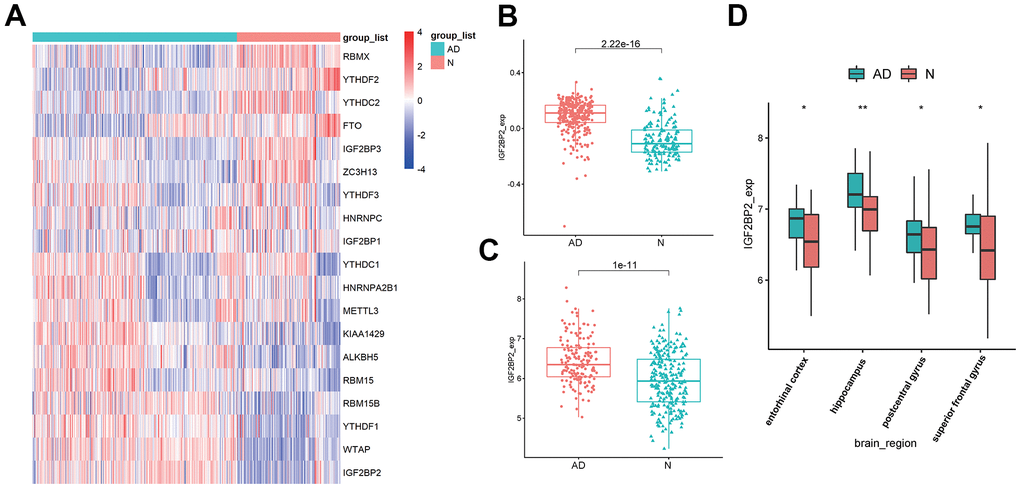
Figure 1. Identification of DEGS in AD. (A) The expression of 19 m6A modification-related genes in GSE33000. (B) IGF2BP2 expression in AD patients and in normal people in GSE33000. (C) IGF2BP2 expression in AD patients and in normal people in GSE48350 and GSE5281. (D) IGF2BP2 expression in different brain regions of AD patients in GSE33000.
To further find genes that related to IGF2BP2 in AD, first of all, we obtained 13968 differentially expressed genes (DEGs) between AD and normal tissues in GSE33000 (Figure 2A, 2B). Among them, there were 6918 increased genes and 7050 decreased genes in AD patients. Then, we divided AD patients into two groups according to the median expression level of IGF2PB2 and compared to get 9908 DEGs related to IGF2PB2 expression status (Figure 2C–2E). After intersecting the two DEG sets, we took the shared genes as the relevant gene sets of IGF2PB2 affecting AD occurrence for subsequent analysis.
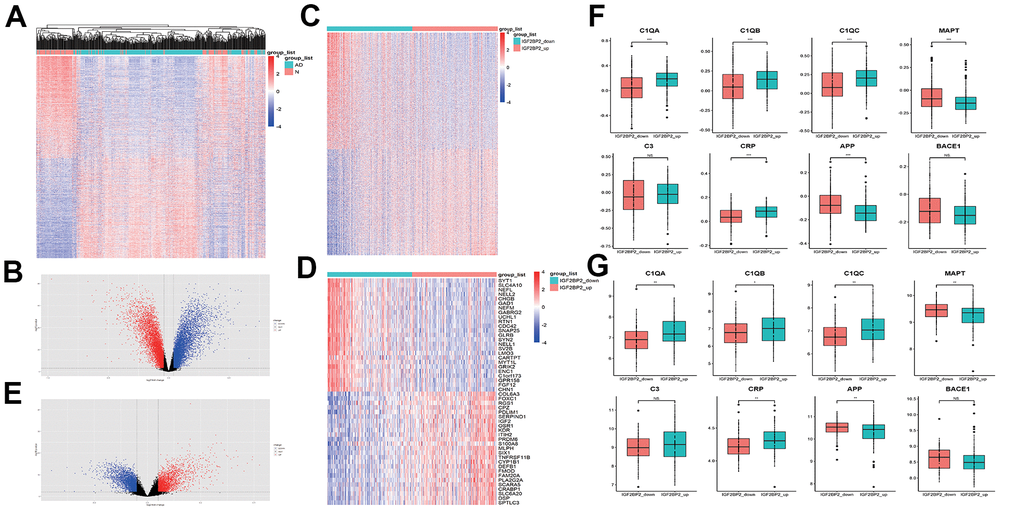
Figure 2. Identification of DEGS related with IGF2PB2 in AD. (A, B) DEGs between AD patients and normal people in GSE33000. (C, E) DEGs between IGF2PB2 high and low group in AD patients in GSE33000. (D) The top25 increased differentially expressed genes and the top25 decreased differentially expressed genes between IGF2PB2 high and low group in AD patients in GSE33000. (F, G) Expression status of systemic inflammation biomarkers and AD pathological markers in IGF2BP2_high and IGF2BP2_low subgroups of AD patients in GSE33000 (F) and GSE48350/5281 (G) datasets.
Given that IGF2BP2 had obvious abnormal expression in AD, we also explored the expression of canonical systemic inflammation biomarkers as well as AD pathological markers [45, 46] in IGF2BP2_high and IGF2BP2_low subgroups defined by the median expression value of IGF2BP2 in both GSE33000 and GSE48350/5281 datasets (Figure 2F, 2G). It turned that the expression of Complement component C1Q (C1QA, C1QB and C1QC) and C reactive protein (CRP) was significantly higher in IGF2BP2_high subgroup in AD patients, with no significant difference in C3, suggesting that IGF2BP2 could exacerbate the inflammatory response in the brain tissue of AD patients. Furthermore, the mRNA expression level of β amyloid (Aβ) and Tau protein, showed by their corresponding genes APP and MAPT, was abnormally lower in IGF2BP2_high subgroup, but the expression of BACE1, the key lyase in the formation of Aβ was not influenced. These results indicated that IGF2BP2 high expression might correlated with the increased expression of APP and MAPT gene variants rather than the normal genes, but further results based on next-generation sequencing were needed to verify our hypothesis.
Module associated with IGF2BP2 in AD
In order to find the key modules most relevant to IGF2BP2 expression status in AD, we performed weight gene correlation analysis (WGCNA) using the expression profiles of the abovementioned DEGs which related to the expression level of IGF2PB2, thereby identifying 17 modules (Figure 3A). Among them, the black module composed of 440 genes had the most significant positive correlation with the increase of IGF2BP2 expression (correlation coefficient=0.58, P=5E-29; Figure 3B), while the turquoise module had the most significant negative correlation (correlation coefficient=-0.46, P=2E-17; Figure 3B). Since IGF2BP2 recognized m6A-modified RNA to enhance its stability and increase translation, we paid more attention to the module that had a positive correlation with IGF2BP2 expression, which was the black module. Finally, according to GS>0.4 and MM>0.9, the 440 genes in the black module were further reduced to 65 genes, which were defined as the hub genes with the strongest positive correlation with IGF2BP2 expression.
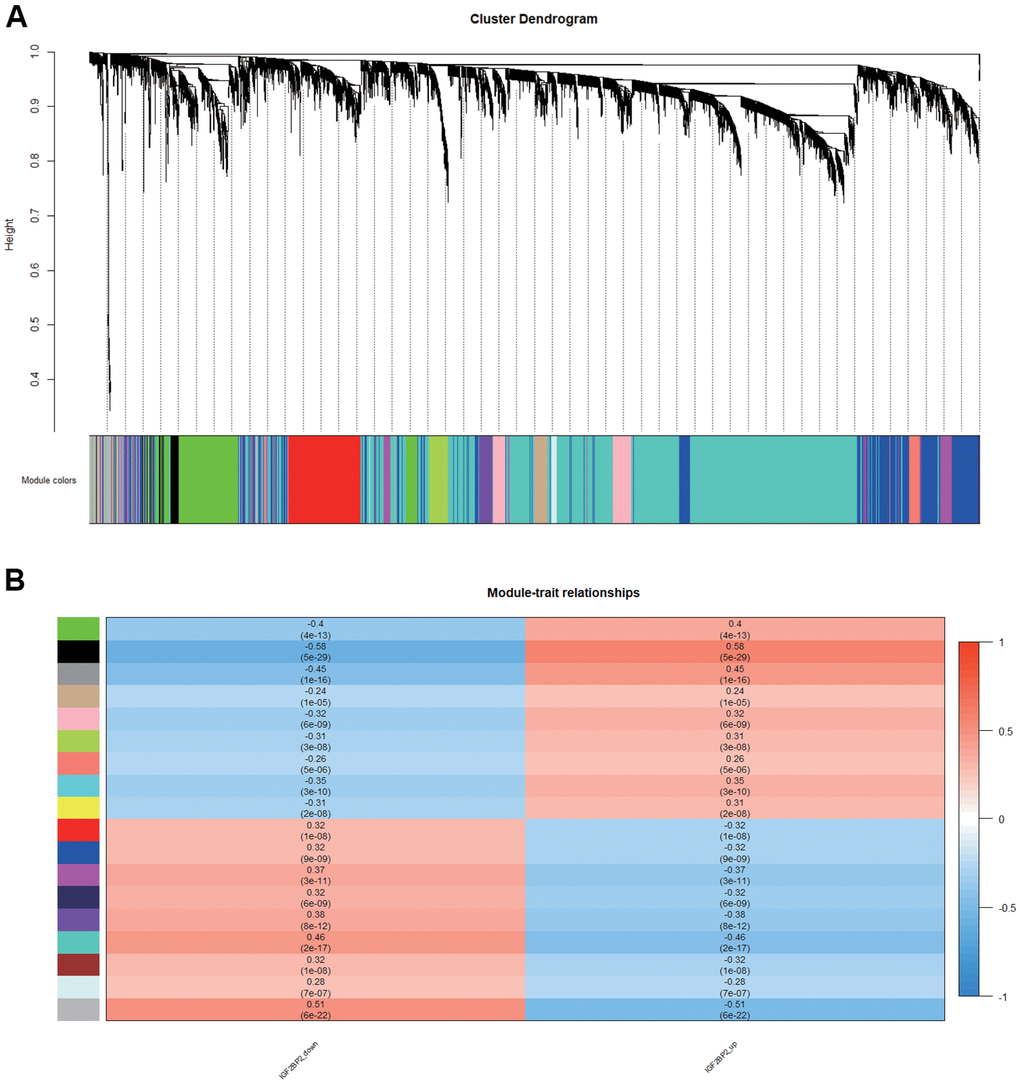
Figure 3. Module associated with IGF2BP2 in AD. (A, B) 17 modules related to the expression level of IGF2PB2 analyzed by WGCNA.
Pathway analysis for hub genes that positively related to IGF2BP2
GO and KEGG analysis for 440 genes in the black module were first conducted. Results showed that DEGs was significantly enriched in biological processes such as extracellular structure organization and extracellular matrix organization by GO term enrichment analysis (Figure 4A). In addition, KEGG analysis indicated that DEGs was most significantly enriched in complement and coagulation cascades related pathways (Figure 4B). To further explore the influence of IGF2BP2 expression status on the enrichment of signaling pathway, the AD patients in GSE33000 were divided into IGF2BP2 high and low groups, with the whole transcriptome subjected to GSEA. The results indicated that pathways including complement and coagulation cascades, ECM receptor interaction, focal adhesion, cytokine- cytokine receptor interaction, one carbon pool by folate, TGF-beta signaling pathway were significantly enriched in IGF2BP2_high subgroup (Figure 4C). On the other hand, as for GO biological process enrichment, GSEA results were enriched in collagen fibril organization, extracellular structure organization, regulation of vasculature development, and cellular response to vascular endothelial growth factor stimulus (Figure 4D). The common enrichment pathways in the above results, such as ECM receptor interaction, focal adhesion, cytokine-cytokine receptor interaction, and TGF-beta signaling pathway, may be closely related to the effect of IGF2BP2 on AD, thus providing us some insight into the biological effects associated with IGF2BP2.
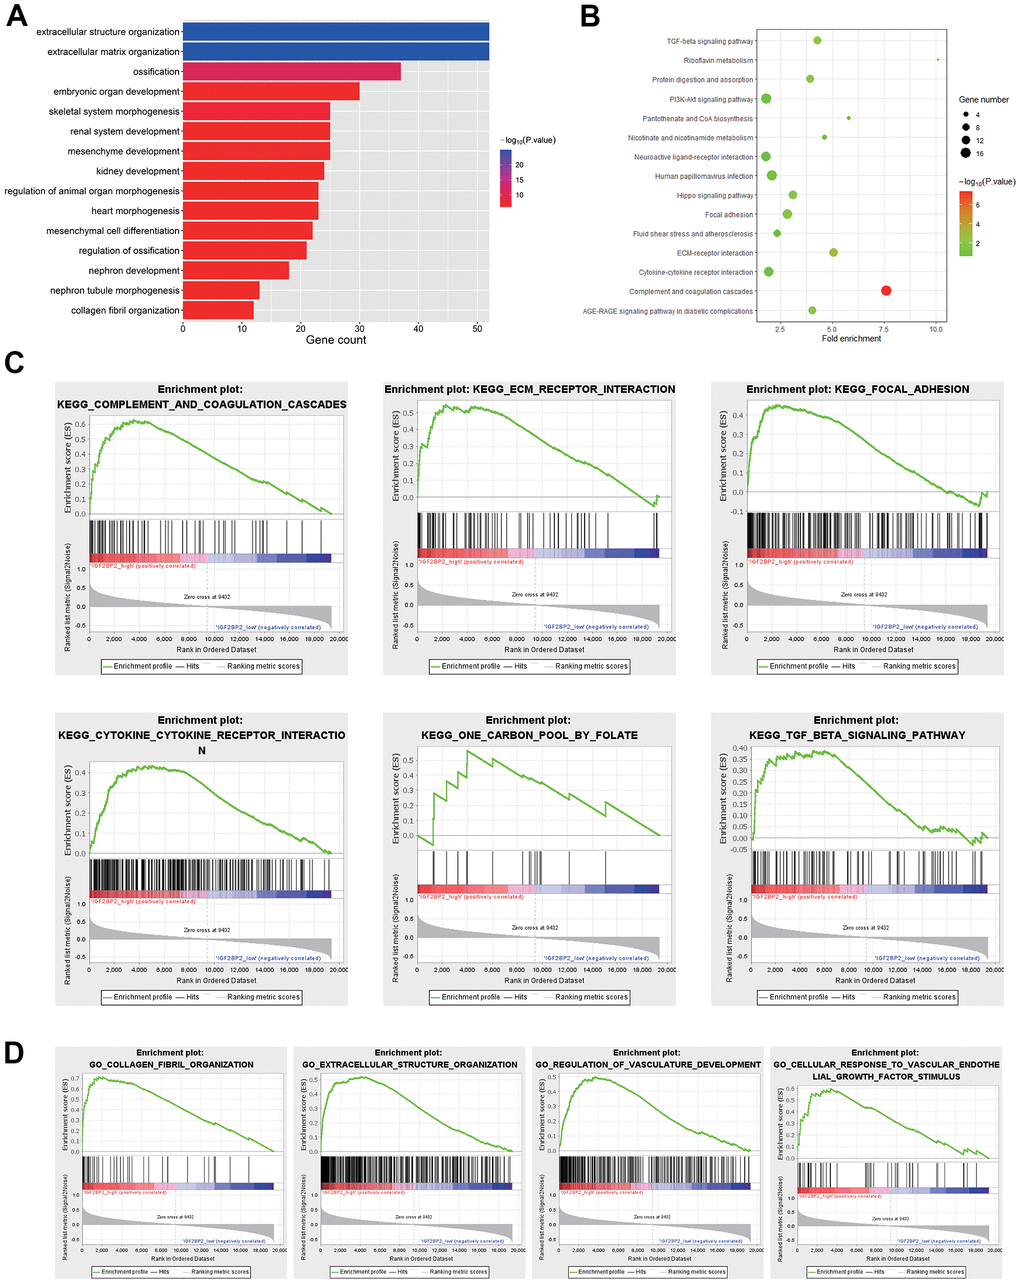
Figure 4. Pathway analysis in DEGS. (A) Biological processes of 440 DEGs in black module. (B) KEGG analysis of 440 DEGs in black module. (C) KEGG pathways enriched in IGF2BP2-high by GSEA. (D) GO biological processes enriched in IGF2BP2-high by GSEA.
Construction and validation of the IGF2BP2-related AD diagnosis model
We then performed lasso regression on IGF2BP2 and the 65 hub genes in black module to construct a diagnostic model for AD. Based on the λ value of LASSO regression, two diagnostic models have been constructed: the first one is the model constructed with 38 genes that maximized the predictive performance regardless of the number of genes, and the second one is the model obtained by including a minimum of 20 of the most critical genes at the appropriate sacrifice of diagnostic efficiency (Figure 5A). In addition, we randomly sample 70% of the samples in GSE33000 as the train Set, and the remaining 30% as the test Set to judge the internal diagnostic stability of this model. We found that in the train set the AUC of the first model was 0.972, while the second model was 0.959, which was still a relative high value (Figure 5B). On the other hand, in the Test set the AUC of the first model was 0.95, and the second model was 0.92 (Figure 5C). Moreover, we used the data in GSE48350 and GSE5281 as the external validation set, with the AUC of the first model 0.80, the second model 0.81 (Figure 5D). In summary, the 20-gene-model could be used to construct a suitable AD diagnosis model with the least hub genes while maintaining relatively high diagnostic efficiency. This model included the following genes: TNFRSF11B, GYPC, TP53I11, F10, PKP2, FCGRT, PRRX2, PRELP, BMP6, MRC2, AOX1, PRDM6, STRA6, PTGFR, CFH, SLC22A3, LOC388630, ANXA2P2, COL1A1 and IGF2BP2.
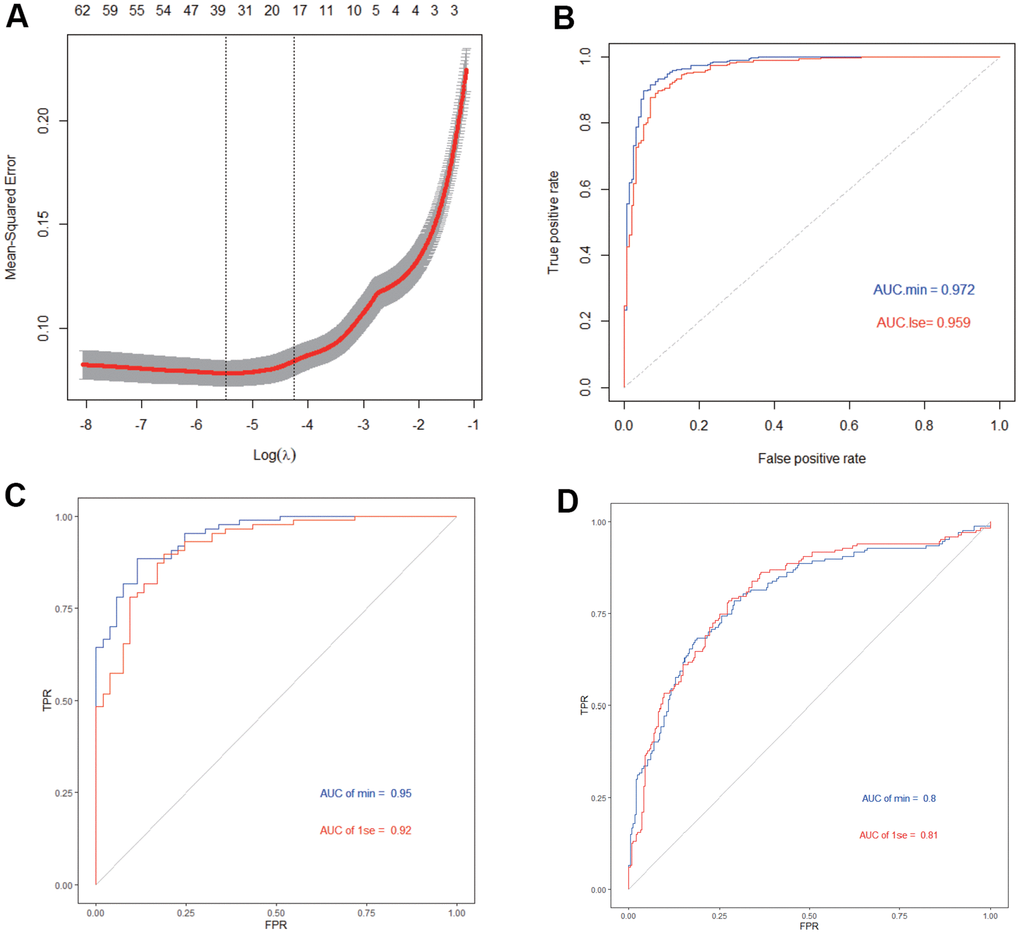
Figure 5. Construction and validation of AD diagnosis model. (A) LASSO model. (B) ROC curves analysis in train set. (C) ROC curves analysis in test set. (D) ROC curves analysis in validation.
M6A-dependent mechanism between IGF2BP2 and genes in AD diagnostic model
As a classical RNA binding protein, IGF2BP2 was identified as a m6A reader protein in 2018. The binding between IGF2BP2 and its targets could increase the stability of mRNAs, thereupon promote the expression of the downstream mRNAs and proteins. After WGCNA and LASSO analysis, we got an IGF2BP2-related diagnostic model containing 20 genes. Here we presumed that IGF2BP2 might specifically bind with some of these genes in a m6A-dependent manner. To explore this mechanism, we first searched the possible genes that contained m6A modification sites with high confidence in 20 hub genes using SRAMP. Then, in RMBase, we further predicted the specific binding of IGF2BP2 to m6A sites of target mRNAs. Ultimately, TP53I11, PKP2, BMP6, CFH and COL1A1 were preliminarily confirmed to possess “very high confidence” m6A binding sites with IGF2BP2 (Figure 6A–6E). These binding sites had the value of subsequent experimental verification, and might be able to explain the molecular mechanism of IGF2BP2 promoting the pathogenesis and development of AD.
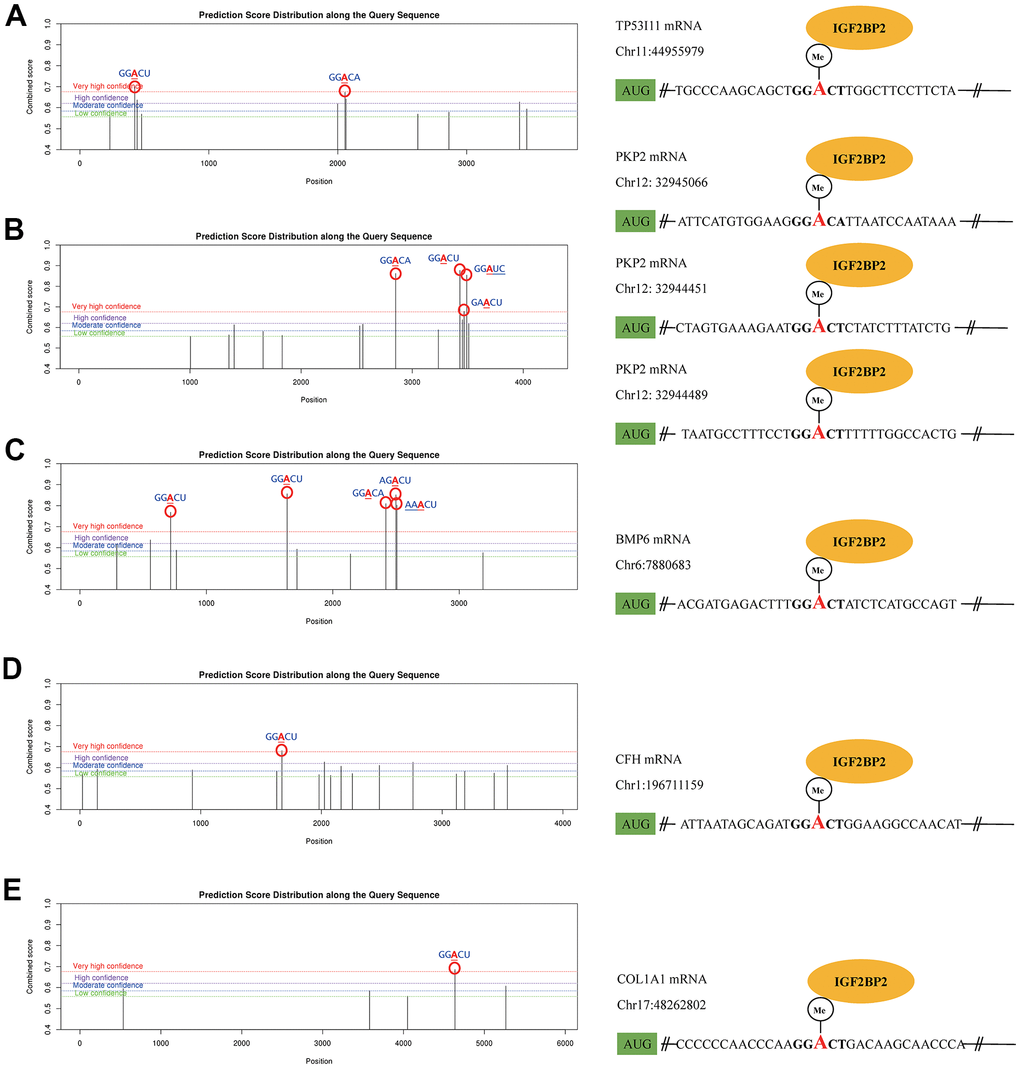
Figure 6. The m6A mechanism of IGF2PB2 and its downstream mRNA targets. The m6A mechanism of IGF2PB2 and TP53 (A), PKP2 (B), BMP6 (C), CFH (D), COL1A1 (E).
Discussion
Accumulation studies have shown that m6A, as a dynamic and reversible regulatory biomarker [24], is related to nervous system development and neurodegenerative diseases [31–33], but its regulatory mechanism is still unclear. Experiments have confirmed that m6A epitranscriptome plays an important part in synaptic plasticity, neuron development, stress response and cognition [28, 29, 47, 48]. M6A signaling influences learning and memory. Given that learning and memory disorders are clinical features of AD, decrease of m6A signaling might be related to the pathophysiology of AD [49]. M6A methylations may be potential biomarkers for cognitive dysfunction such as AD, mild cognitive impairment, and vascular dementia [50]. Mutations in genes which encoding the neuronal glycoprotein m6A have link with psychiatric disorders such as Alzheimer’s disease [51]. In previous studies, pathway analyses have predicted the potential effect of m6A methylation RNA in AD, and the high-throughput sequencing of m6A RNA methylation alterations in AD and C57BL/6 mice was also verified this association [52, 53]. Besides, m6A controls key gene expression in AD- related pathways, which indicates that m6A renders its essential roles in aging and neurodegenerative diseases [54]. In our study, we found that IGF2BP2, as a m6A reader, increased in AD patients than in normal people, which might indicate a potential relationship with the occurrence of AD.
As a reader of m6A, IGF2BP2 is associated with carcinogenesis, and has been tested to be associated with the occurrence and prognosis of various cancers including colorectal cancer [55], gastrointestinal cancer [56], endometrial cancer [57], pancreas cancer [58], breast cancer [59] and Head and Neck Squamous Cell Carcinoma [60]. During the progression of colorectal cancer, LINRIS prevents K139 ubiquitination of IGF2BP2, thereby maintaining its stability. This process prevents IGF2BP2 degradation through the autophagy-lysosomal pathway, which is further related to MYC-mediated glycolysis. Besides, studies confirmed that miR-34a silence resulted in IGF2BP3 activation, which was related with gastric tumorigenesis and differences in prognosis [61]. However, its association with AD is not clear. We further explored the genes associated with differential expression of IGF2BP2, and a total of 17 AD-related modules were identified based on WGCNA data. Furthermore, according to GS>0.4 and MM>0.9, a total of 65 hub genes were identified eventually.
We further explored the potential pathways related to AD. Pathway enrichment analysis indicated that gene modules related to IGF2BP2 are significantly enriched in ECM receptor interaction, focal adhesion, cytokine-cytokine receptor interaction and TGF-beta signaling pathway, which may participate in the occurrence of AD. Many pathways have been confirmed to be related to AD. For example, increasing studies have found that the expression of cytokine-cytokine receptor interaction pathway in AD is increased [62, 63]. Moreover, TGF-beta signaling pathway may serve as a neurotrophic pathway that satisfies the important protective and survival effects of neurons. It acts as a potential target of neurodegenerative diseases, and is critical in the pathogenesis of AD [64, 65].
In addition, we used IGF2BP2 and 65 hub genes to construct a 20-gene-based diagnostic model. Both training set and test set showed a high AUC value with this lasso model using ROC curve analysis, which is also verified in an independent verification dataset. This meant our diagnostic model might provide a novel idea for the diagnosis of AD.
Finally, we searched for the possible m6A mechanism of IGF2PB2 in 20 hub genes. Further studies have shown that TP53I11, PKP2, BMP6, CFH and COL1A1 had m6A and could specifically bind with IGF2PB2. It can be seen that IGF2PB2 probably acts as m6A “reader” that binds to TP53I11, PKP2, BMP6, CFH and COL1A1 m6A, and ultimately leads to AD. Nevertheless, we did not find that the remaining hub genes had m6A or specific binding to IGF2PB2, which might be explained by other function of IGF2PB2 [66, 67].
Our research used bioinformatics methods to reveal the possible molecular mechanisms and built a diagnostic model for AD. However, more key genes and specific signaling pathways underlying AD need to be further verified through cell and animal experiments. On the other hand, to what extent the increase of IGF2BP2 expression in AD patients promotes the occurrence and development of AD still remains to be tested.
In summary, our study proved that high expression of IGF2BP2 may associate with the increase of the PKP2 through m6A association mechanism, which may further lead to the occurrence of AD. Besides, a diagnostic model was constructed and validated based on that.
Materials and Methods
Datasets acquisition
Three data sets (GSE33000, GSE5281 and GSE48350) were selected from GEO database (https://www.ncbi.nlm.nih.gov/geo/) for this study. Among them, GSE33000 was based on GPL4372 platform including postmortem prefrontal cortex samples of 310 AD patients and 157 normal people. The “getGEO” function from “GEOquery” package in R was applied for data downloading of this dataset. Besides, GSE5281 included brain tissue samples of 87 AD patients and 74 normal people, GSE48350 included 80 AD patients and 173 normal people. Both datasets were based on GPL570 platform. Thus, the “getGEOSuppFiles” function from “GEOquery” package was applied for downloading the raw data of these datasets, and the “justRMA” function from “affy” package was applied for the normalization of them.
Differentially expressed genes (DEGs) identification
The “limma” package from R was applied for DEG analysis in this study. For the selected datasets, we select the median expression of IGF2BP2 as the cutoff point to divide AD samples into IGF2BP2_high and IGF2BP2_low subgroups. DEG analysis was then conducted between AD and normal brain tissues and between IGF2BP2_high and IGF2BP2_low subgroups by lmFit and eBayes methods. P < 0.05 adjusted by the false discovery rate (FDR) was considered as significant. The intersection of the DEGs obtained from the two analyses was defined as IGF2BP2-related AD genes.
Weight gene correlation network analysis (WGCNA) and hub genes identification
After getting IGF2BP2-related AD genes, WGCNA analysis was performed using “WGCNA” package in R for GSE33000 dataset. Briefly, “hclust” function was used to hierarchical clustering analysis; then, the soft thresholding power value was calculated by “pickSoftThreshold” function; next, the “blockwiseModules” function was used for constructing co-expression network in IGF2BP2_high and IGF2BP2_low subgroups of AD patients, the module that was mostly correlated with IGF2BP2_high or IGF2BP2_low subgroups was defined as the most valuable module and was selected for further screening. Gene Significance (GS) > 0.4 and Module Membership (MM) > 0.9 was considered as threshold to screen hub genes in the most valuable module.
Gene Ontology (GO), Kyoto Encyclopedia of Genes and Genomes Pathway (KEGG pathway) and Gene Set Enrichment Analysis (GSEA)
Using enrichGO and enrichKEGG function in “clusterProfiler” package, GO and KEGG pathway analysis were performed based on genes in the most valuable module in WGCNA analysis. Furthermore, Gene Set Enrichment Analysis (GSEA) provided by the JAVA program (Version 4.0.3) with MSigDB v6.1 was applied to explore the downstream biological processes affected by differential expression of IGF2BP2.
Construction and validation of the diagnostic model for AD
To build a diagnostic model that could maximally distinguish AD from normal brain samples, least absolute shrinkage and selection operator (LASSO) regression was applied using “glmnet” package to select most representative features in hub genes obtained from the most valuable module in WGCNA analysis. A model index for each sample was created using the regression coefficients from the LASSO analysis to weight the expression value of the selected genes with the following formula:
where Coefi means the coefficients for each gene, xi is the expression value of each gene.
Then, samples in GES33000 dataset were randomly assigned to the training set (70%) and test set (30%) for internal test. GSE5281 and GSE48350 datasets were applied for external validation of our diagnostic model. The “ROCR” package was used for drawing ROC curves for the training, testing and validation datasets respectively.
The m6A mechanism between IGF2PB2 and hub genes
To initially explore whether IGF2BP2 and hub genes from WGCNA and LASSO analysis could constitute a m6A-dependent mechanism, SRAMP online database (http://www.cuilab.cn/sramp) and RMBase V2.0 online tools were applied. SRAMP could predict the precise location of m6A modification on mRNAs and provide the confidence of every modification site, while RMBase V2.0 could further inquire whether these modification sites could be specifically recognized and bounded by IGF2BP2.
Abbreviations
AD: Alzheimer’s disease; DEG: differentially expressed gene; WGCNA: weight gene correlation analysis; m6A: N6-methyladenosine; IGF2BP2: Insulin-like growth factor 2 mRNA binding protein 2; GEO: Gene Expression Omnibus; FDR: false discovery rate; GO: Gene Ontology; KEGG: Kyoto Encyclopedia of Genes and Genomes; GSEA: Gene set enrichment analysis; LASSO: least absolute shrinkage and selection operator.
Author Contributions
Conceptualization, Wenzhe Gao and Yalin Lliu; methodology, Yanyao Deng; software, Yanyao Deng; validation, Yanyao Deng; formal analysis, Yanyao Deng; investigation, Wenzhe Gao; data curation, Wenzhe Gao; writing—original draft preparation, Yalin Lliu; writing—review and editing, Hongwei Zhu, Shuhan, Le Xiao and Chao Liu; project administration, Wenzhe Gao; funding acquisition, Hongwei Zhu. All authors have read and agreed to the published version of the manuscript”.
Acknowledgments
We appreciated GENE EXPRESSION OMNIBUS (GEO) of The National Center for Biotechnology Information (NCBI) which provided all the data included in this study. GSE33000: https://www.ncbi.nlm.nih.gov/geo/query/acc.cgi?acc=GSE33000; GSE5281: https://www.ncbi.nlm.nih.gov/geo/query/acc.cgi?acc=GSE5281; GSE48350: https://www.ncbi.nlm.nih.gov/geo/query/acc.cgi?acc=GSE48350.
Conflicts of Interest
The authors declare that they have no conflicts of interest.
Funding
This article was supported by the following fundings: (1) Hunan Provincial Science and Technology Plan Project (No. 2019JJ80066); (2) Scientific Research Project of Health and Family Planning Commission of Hunan Province of China (No. B20-17202); (3) National Natural Science Foundation for Young Scholars of China (No. 82000614).
Editorial Note
This corresponding author has a verified history of publications using a personal email address for correspondence
References
- 1. Lynch C. World Alzheimer Report 2019: Attitudes to dementia, a global survey. Alzheimers Dement. 2020; 16:e038255. https://doi.org/10.1002/alz.038255
- 2. Scheltens P, Blennow K, Breteler MM, de Strooper B, Frisoni GB, Salloway S, Van der Flier WM. Alzheimer’s disease. Lancet. 2016; 388:505–17. https://doi.org/10.1016/S0140-6736(15)01124-1 [PubMed]
- 3. Ballard C, Gauthier S, Corbett A, Brayne C, Aarsland D, Jones E. Alzheimer’s disease. Lancet. 2011; 377:1019–31. https://doi.org/10.1016/S0140-6736(10)61349-9 [PubMed]
- 4. Kim A, Kim S, Park KW, Park KH, Youn YC, Lee DW, Lee JY, Lee JH, Jeong JH, Choi SH, Han HJ, Kim S, Na S, et al. A Comparative Evaluation of the KDSQ-C, AD8, and SMCQ as a Cognitive Screening Test to Be Used in National Medical Check-ups in Korea. J Korean Med Sci. 2019; 34:e111. https://doi.org/10.3346/jkms.2019.34.e111 [PubMed]
- 5. Sperling RA, Aisen PS, Beckett LA, Bennett DA, Craft S, Fagan AM, Iwatsubo T, Jack CR
Jr , Kaye J, Montine TJ, Park DC, Reiman EM, Rowe CC, et al. Toward defining the preclinical stages of Alzheimer’s disease: recommendations from the National Institute on Aging-Alzheimer’s Association workgroups on diagnostic guidelines for Alzheimer’s disease. Alzheimers Dement. 2011; 7:280–92. https://doi.org/10.1016/j.jalz.2011.03.003 [PubMed] - 6. Mielke MM, Vemuri P, Rocca WA. Clinical epidemiology of Alzheimer’s disease: assessing sex and gender differences. Clin Epidemiol. 2014; 6:37–48. https://doi.org/10.2147/CLEP.S37929 [PubMed]
- 7. Donohue MC, Sperling RA, Petersen R, Sun CK, Weiner MW, Aisen PS, and Alzheimer’s Disease Neuroimaging Initiative. Association Between Elevated Brain Amyloid and Subsequent Cognitive Decline Among Cognitively Normal Persons. JAMA. 2017; 317:2305–16. https://doi.org/10.1001/jama.2017.6669 [PubMed]
- 8. Petersen RC, Wiste HJ, Weigand SD, Rocca WA, Roberts RO, Mielke MM, Lowe VJ, Knopman DS, Pankratz VS, Machulda MM, Geda YE, Jack CR
Jr . Association of Elevated Amyloid Levels With Cognition and Biomarkers in Cognitively Normal People From the Community. JAMA Neurol. 2016; 73:85–92. https://doi.org/10.1001/jamaneurol.2015.3098 [PubMed] - 9. Papp KV, Rentz DM, Mormino EC, Schultz AP, Amariglio RE, Quiroz Y, Johnson KA, Sperling RA. Cued memory decline in biomarker-defined preclinical Alzheimer disease. Neurology. 2017; 88:1431–8. https://doi.org/10.1212/WNL.0000000000003812 [PubMed]
- 10. Benzinger TL, Blazey T, Jack CR
Jr , Koeppe RA, Su Y, Xiong C, Raichle ME, Snyder AZ, Ances BM, Bateman RJ, Cairns NJ, Fagan AM, Goate A, et al. Regional variability of imaging biomarkers in autosomal dominant Alzheimer’s disease. Proc Natl Acad Sci USA. 2013; 110:E4502–9. https://doi.org/10.1073/pnas.1317918110 [PubMed] - 11. Bateman RJ, Xiong C, Benzinger TL, Fagan AM, Goate A, Fox NC, Marcus DS, Cairns NJ, Xie X, Blazey TM, Holtzman DM, Santacruz A, Buckles V, et al, and Dominantly Inherited Alzheimer Network. Clinical and biomarker changes in dominantly inherited Alzheimer’s disease. N Engl J Med. 2012; 367:795–804. https://doi.org/10.1056/NEJMoa1202753 [PubMed]
- 12. Fleisher AS, Chen K, Quiroz YT, Jakimovich LJ, Gutierrez Gomez M, Langois CM, Langbaum JB, Roontiva A, Thiyyagura P, Lee W, Ayutyanont N, Lopez L, Moreno S, et al. Associations between biomarkers and age in the presenilin 1 E280A autosomal dominant Alzheimer disease kindred: a cross-sectional study. JAMA Neurol. 2015; 72:316–24. https://doi.org/10.1001/jamaneurol.2014.3314 [PubMed]
- 13. Fagan AM, Xiong C, Jasielec MS, Bateman RJ, Goate AM, Benzinger TL, Ghetti B, Martins RN, Masters CL, Mayeux R, Ringman JM, Rossor MN, Salloway S, et al, and Dominantly Inherited Alzheimer Network. Longitudinal change in CSF biomarkers in autosomal-dominant Alzheimer’s disease. Sci Transl Med. 2014; 6:226ra30. https://doi.org/10.1126/scitranslmed.3007901 [PubMed]
- 14. Montine TJ, Phelps CH, Beach TG, Bigio EH, Cairns NJ, Dickson DW, Duyckaerts C, Frosch MP, Masliah E, Mirra SS, Nelson PT, Schneider JA, Thal DR, et al, and National Institute on Aging, and Alzheimer’s Association. National Institute on Aging-Alzheimer’s Association guidelines for the neuropathologic assessment of Alzheimer’s disease: a practical approach. Acta Neuropathol. 2012; 123:1–11. https://doi.org/10.1007/s00401-011-0910-3 [PubMed]
- 15. Hyman BT, Phelps CH, Beach TG, Bigio EH, Cairns NJ, Carrillo MC, Dickson DW, Duyckaerts C, Frosch MP, Masliah E, Mirra SS, Nelson PT, Schneider JA, et al. National Institute on Aging-Alzheimer’s Association guidelines for the neuropathologic assessment of Alzheimer’s disease. Alzheimers Dement. 2012; 8:1–13. https://doi.org/10.1016/j.jalz.2011.10.007 [PubMed]
- 16. Neueder A. RNA-Mediated Disease Mechanisms in Neurodegenerative Disorders. J Mol Biol. 2019; 431:1780–91. https://doi.org/10.1016/j.jmb.2018.12.012 [PubMed]
- 17. Sanchez-Mut JV, Gräff J. Epigenetic Alterations in Alzheimer’s Disease. Front Behav Neurosci. 2015; 9:347. https://doi.org/10.3389/fnbeh.2015.00347 [PubMed]
- 18. De Jager PL, Srivastava G, Lunnon K, Burgess J, Schalkwyk LC, Yu L, Eaton ML, Keenan BT, Ernst J, McCabe C, Tang A, Raj T, Replogle J, et al. Alzheimer’s disease: early alterations in brain DNA methylation at ANK1, BIN1, RHBDF2 and other loci. Nat Neurosci. 2014; 17:1156–63. https://doi.org/10.1038/nn.3786 [PubMed]
- 19. Lunnon K, Smith R, Hannon E, De Jager PL, Srivastava G, Volta M, Troakes C, Al-Sarraj S, Burrage J, Macdonald R, Condliffe D, Harries LW, Katsel P, et al. Methylomic profiling implicates cortical deregulation of ANK1 in Alzheimer’s disease. Nat Neurosci. 2014; 17:1164–70. https://doi.org/10.1038/nn.3782 [PubMed]
- 20. Marzi SJ, Leung SK, Ribarska T, Hannon E, Smith AR, Pishva E, Poschmann J, Moore K, Troakes C, Al-Sarraj S, Beck S, Newman S, Lunnon K, et al. A histone acetylome-wide association study of Alzheimer’s disease identifies disease-associated H3K27ac differences in the entorhinal cortex. Nat Neurosci. 2018; 21:1618–27. https://doi.org/10.1038/s41593-018-0253-7 [PubMed]
- 21. Nativio R, Donahue G, Berson A, Lan Y, Amlie-Wolf A, Tuzer F, Toledo JB, Gosai SJ, Gregory BD, Torres C, Trojanowski JQ, Wang LS, Johnson FB, et al. Dysregulation of the epigenetic landscape of normal aging in Alzheimer’s disease. Nat Neurosci. 2018; 21:497–505. https://doi.org/10.1038/s41593-018-0101-9 [PubMed]
- 22. Klein HU, McCabe C, Gjoneska E, Sullivan SE, Kaskow BJ, Tang A, Smith RV, Xu J, Pfenning AR, Bernstein BE, Meissner A, Schneider JA, Mostafavi S, et al. Epigenome-wide study uncovers large-scale changes in histone acetylation driven by tau pathology in aging and Alzheimer’s human brains. Nat Neurosci. 2019; 22:37–46. https://doi.org/10.1038/s41593-018-0291-1 [PubMed]
- 23. Saletore Y, Meyer K, Korlach J, Vilfan ID, Jaffrey S, Mason CE. The birth of the Epitranscriptome: deciphering the function of RNA modifications. Genome Biol. 2012; 13:175. https://doi.org/10.1186/gb-2012-13-10-175 [PubMed]
- 24. Niu Y, Zhao X, Wu YS, Li MM, Wang XJ, Yang YG. N6-methyl-adenosine (m6A) in RNA: an old modification with a novel epigenetic function. Genomics Proteomics Bioinformatics. 2013; 11:8–17. https://doi.org/10.1016/j.gpb.2012.12.002 [PubMed]
- 25. Zhao BS, Roundtree IA, He C. Publisher Correction: Post-transcriptional gene regulation by mRNA modifications. Nat Rev Mol Cell Biol. 2018; 19:808. https://doi.org/10.1038/s41580-018-0075-1 [PubMed]
- 26. Schwartz S. Cracking the epitranscriptome. RNA. 2016; 22:169–74. https://doi.org/10.1261/rna.054502.115 [PubMed]
- 27. Luo J, Liu H, Luan S, He C, Li Z. Aberrant Regulation of mRNA m6A Modification in Cancer Development. Int J Mol Sci. 2018; 19:2515. https://doi.org/10.3390/ijms19092515 [PubMed]
- 28. Widagdo J, Anggono V. The m6A-epitranscriptomic signature in neurobiology: from neurodevelopment to brain plasticity. J Neurochem. 2018; 147:137–52. https://doi.org/10.1111/jnc.14481 [PubMed]
- 29. Flamand MN, Meyer KD. The epitranscriptome and synaptic plasticity. Curr Opin Neurobiol. 2019; 59:41–8. https://doi.org/10.1016/j.conb.2019.04.007 [PubMed]
- 30. Livneh I, Moshitch-Moshkovitz S, Amariglio N, Rechavi G, Dominissini D. The m6A epitranscriptome: transcriptome plasticity in brain development and function. Nat Rev Neurosci. 2020; 21:36–51. https://doi.org/10.1038/s41583-019-0244-z [PubMed]
- 31. Meyer KD, Saletore Y, Zumbo P, Elemento O, Mason CE, Jaffrey SR. Comprehensive analysis of mRNA methylation reveals enrichment in 3' UTRs and near stop codons. Cell. 2012; 149:1635–46. https://doi.org/10.1016/j.cell.2012.05.003 [PubMed]
- 32. Widagdo J, Zhao QY, Kempen MJ, Tan MC, Ratnu VS, Wei W, Leighton L, Spadaro PA, Edson J, Anggono V, Bredy TW. Experience-Dependent Accumulation of N6-Methyladenosine in the Prefrontal Cortex Is Associated with Memory Processes in Mice. J Neurosci. 2016; 36:6771–7. https://doi.org/10.1523/JNEUROSCI.4053-15.2016 [PubMed]
- 33. Li H, Ren Y, Mao K, Hua F, Yang Y, Wei N, Yue C, Li D, Zhang H. FTO is involved in Alzheimer’s disease by targeting TSC1-mTOR-Tau signaling. Biochem Biophys Res Commun. 2018; 498:234–9. https://doi.org/10.1016/j.bbrc.2018.02.201 [PubMed]
- 34. Li L, Zang L, Zhang F, Chen J, Shen H, Shu L, Liang F, Feng C, Chen D, Tao H, Xu T, Li Z, Kang Y, et al. Fat mass and obesity-associated (FTO) protein regulates adult neurogenesis. Hum Mol Genet. 2017; 26:2398–411. https://doi.org/10.1093/hmg/ddx128 [PubMed]
- 35. Walters BJ, Mercaldo V, Gillon CJ, Yip M, Neve RL, Boyce FM, Frankland PW, Josselyn SA. The Role of The RNA Demethylase FTO (Fat Mass and Obesity-Associated) and mRNA Methylation in Hippocampal Memory Formation. Neuropsychopharmacology. 2017; 42:1502–10. https://doi.org/10.1038/npp.2017.31 [PubMed]
- 36. Koranda JL, Dore L, Shi H, Patel MJ, Vaasjo LO, Rao MN, Chen K, Lu Z, Yi Y, Chi W, He C, Zhuang X. Mettl14 Is Essential for Epitranscriptomic Regulation of Striatal Function and Learning. Neuron. 2018; 99:283–92.e5. https://doi.org/10.1016/j.neuron.2018.06.007 [PubMed]
- 37. Shi H, Zhang X, Weng YL, Lu Z, Liu Y, Lu Z, Li J, Hao P, Zhang Y, Zhang F, Wu Y, Delgado JY, Su Y, et al. m6A facilitates hippocampus-dependent learning and memory through YTHDF1. Nature. 2018; 563:249–53. https://doi.org/10.1038/s41586-018-0666-1 [PubMed]
- 38. Zhang Z, Wang M, Xie D, Huang Z, Zhang L, Yang Y, Ma D, Li W, Zhou Q, Yang YG, Wang XJ. METTL3-mediated N6-methyladenosine mRNA modification enhances long-term memory consolidation. Cell Res. 2018; 28:1050–61. https://doi.org/10.1038/s41422-018-0092-9 [PubMed]
- 39. Formoso K, Billi SC, Frasch AC, Scorticati C. Tyrosine 251 at the C-terminus of neuronal glycoprotein M6a is critical for neurite outgrowth. J Neurosci Res. 2015; 93:215–29. https://doi.org/10.1002/jnr.23482 [PubMed]
- 40. Formoso K, Garcia MD, Frasch AC, Scorticati C. Evidence for a role of glycoprotein M6a in dendritic spine formation and synaptogenesis. Mol Cell Neurosci. 2016; 77:95–104. https://doi.org/10.1016/j.mcn.2016.10.005 [PubMed]
- 41. Sato Y, Mita S, Fukushima N, Fujisawa H, Saga Y, Hirata T. Induction of axon growth arrest without growth cone collapse through the N-terminal region of four-transmembrane glycoprotein M6a. Dev Neurobiol. 2011; 71:733–46. https://doi.org/10.1002/dneu.20941 [PubMed]
- 42. Hu X, Peng WX, Zhou H, Jiang J, Zhou X, Huang D, Mo YY, Yang L. IGF2BP2 regulates DANCR by serving as an N6-methyladenosine reader. Cell Death Differ. 2020; 27:1782–94. https://doi.org/10.1038/s41418-019-0461-z [PubMed]
- 43. Wang T, Kong S, Tao M, Ju S. The potential role of RNA N6-methyladenosine in Cancer progression. Mol Cancer. 2020; 19:88. https://doi.org/10.1186/s12943-020-01204-7 [PubMed]
- 44. Zheng HX, Zhang XS, Sui N. Advances in the profiling of N6-methyladenosine (m6A) modifications. Biotechnol Adv. 2020; 45:107656. https://doi.org/10.1016/j.biotechadv.2020.107656 [PubMed]
- 45. Fischer B, Schmoll H, Riederer P, Bauer J, Platt D, Popa-Wagner A. Complement C1q and C3 mRNA expression in the frontal cortex of Alzheimer’s patients. J Mol Med (Berl). 1995; 73:465–71. https://doi.org/10.1007/BF00202265 [PubMed]
- 46. Slevin M, Matou S, Zeinolabediny Y, Corpas R, Weston R, Liu D, Boras E, Di Napoli M, Petcu E, Sarroca S, Popa-Wagner A, Love S, Font MA, et al. Monomeric C-reactive protein--a key molecule driving development of Alzheimer’s disease associated with brain ischaemia? Sci Rep. 2015; 5:13281. https://doi.org/10.1038/srep13281 [PubMed]
- 47. Engel M, Chen A. The emerging role of mRNA methylation in normal and pathological behavior. Genes Brain Behav. 2018; 17:e12428. https://doi.org/10.1111/gbb.12428 [PubMed]
- 48. Huang YS, Lu WH. Decoding hidden messages in neurons: insights from epitranscriptome-controlled and specialized ribosome-controlled translation. Curr Opin Neurobiol. 2018; 48:64–70. https://doi.org/10.1016/j.conb.2017.10.018 [PubMed]
- 49. Huang H, Camats-Perna J, Medeiros R, Anggono V, Widagdo J. Altered Expression of the m6A Methyltransferase METTL3 in Alzheimer’s Disease. eNeuro. 2020; 7:ENEURO.0125-20.2020. https://doi.org/10.1523/ENEURO.0125-20.2020 [PubMed]
- 50. Du B, Zhang Y, Liang M, Du Z, Li H, Fan C, Zhang H, Jiang Y, Bi X. N6-methyladenosine (m6A) modification and its clinical relevance in cognitive dysfunctions. Aging (Albany NY). 2021; 13:20716–37. https://doi.org/10.18632/aging.203457 [PubMed]
- 51. Garcia MD, Formoso K, Aparicio GI, Frasch AC, Scorticati C. The Membrane Glycoprotein M6a Endocytic/Recycling Pathway Involves Clathrin-Mediated Endocytosis and Affects Neuronal Synapses. Front Mol Neurosci. 2017; 10:296. https://doi.org/10.3389/fnmol.2017.00296 [PubMed]
- 52. Han M, Liu Z, Xu Y, Liu X, Wang D, Li F, Wang Y, Bi J. Abnormality of m6A mRNA Methylation Is Involved in Alzheimer’s Disease. Front Neurosci. 2020; 14:98. https://doi.org/10.3389/fnins.2020.00098 [PubMed]
- 53. Shafik AM, Zhang F, Guo Z, Dai Q, Pajdzik K, Li Y, Kang Y, Yao B, Wu H, He C, Allen EG, Duan R, Jin P. N6-methyladenosine dynamics in neurodevelopment and aging, and its potential role in Alzheimer’s disease. Genome Biol. 2021; 22:17. https://doi.org/10.1186/s13059-020-02249-z [PubMed]
- 54. Loh D, Reiter RJ. Melatonin: Regulation of Biomolecular Condensates in Neurodegenerative Disorders. Antioxidants (Basel). 2021; 10:1483. https://doi.org/10.3390/antiox10091483 [PubMed]
- 55. Wang Y, Lu JH, Wu QN, Jin Y, Wang DS, Chen YX, Liu J, Luo XJ, Meng Q, Pu HY, Wang YN, Hu PS, Liu ZX, et al. LncRNA LINRIS stabilizes IGF2BP2 and promotes the aerobic glycolysis in colorectal cancer. Mol Cancer. 2019; 18:174. https://doi.org/10.1186/s12943-019-1105-0 [PubMed]
- 56. Wang X, Guan D, Wang D, Liu H, Wu Y, Gong W, Du M, Chu H, Qian J, Zhang Z. Genetic variants in m6A regulators are associated with gastric cancer risk. Arch Toxicol. 2021; 95:1081–8. https://doi.org/10.1007/s00204-020-02958-1 [PubMed]
- 57. Hiramatsu K, Yoshino K, Serada S, Yoshihara K, Hori Y, Fujimoto M, Matsuzaki S, Egawa-Takata T, Kobayashi E, Ueda Y, Morii E, Enomoto T, Naka T, Kimura T. Similar protein expression profiles of ovarian and endometrial high-grade serous carcinomas. Br J Cancer. 2016; 114:554–61. https://doi.org/10.1038/bjc.2016.27 [PubMed]
- 58. Xu X, Yu Y, Zong K, Lv P, Gu Y. Up-regulation of IGF2BP2 by multiple mechanisms in pancreatic cancer promotes cancer proliferation by activating the PI3K/Akt signaling pathway. J Exp Clin Cancer Res. 2019; 38:497. https://doi.org/10.1186/s13046-019-1470-y [PubMed]
- 59. McMullen ER, Gonzalez ME, Skala SL, Tran M, Thomas D, Djomehri SI, Burman B, Kidwell KM, Kleer CG. CCN6 regulates IGF2BP2 and HMGA2 signaling in metaplastic carcinomas of the breast. Breast Cancer Res Treat. 2018; 172:577–86. https://doi.org/10.1007/s10549-018-4960-2 [PubMed]
- 60. Deng X, Jiang Q, Liu Z, Chen W. Clinical Significance of an m6A Reader Gene, IGF2BP2, in Head and Neck Squamous Cell Carcinoma. Front Mol Biosci. 2020; 7:68. https://doi.org/10.3389/fmolb.2020.00068 [PubMed]
- 61. Zhou Y, Huang T, Siu HL, Wong CC, Dong Y, Wu F, Zhang B, Wu WK, Cheng AS, Yu J, To KF, Kang W. IGF2BP3 functions as a potential oncogene and is a crucial target of miR-34a in gastric carcinogenesis. Mol Cancer. 2017; 16:77. https://doi.org/10.1186/s12943-017-0647-2 [PubMed]
- 62. Grigg I, Ivashko-Pachima Y, Hait TA, Korenková V, Touloumi O, Lagoudaki R, Van Dijck A, Marusic Z, Anicic M, Vukovic J, Kooy RF, Grigoriadis N, Gozes I. Tauopathy in the young autistic brain: novel biomarker and therapeutic target. Transl Psychiatry. 2020; 10:228. https://doi.org/10.1038/s41398-020-00904-4 [PubMed]
- 63. Wang H, Li Y, Ryder JW, Hole JT, Ebert PJ, Airey DC, Qian HR, Logsdon B, Fisher A, Ahmed Z, Murray TK, Cavallini A, Bose S, et al. Genome-wide RNAseq study of the molecular mechanisms underlying microglia activation in response to pathological tau perturbation in the rTg4510 tau transgenic animal model. Mol Neurodegener. 2018; 13:65. https://doi.org/10.1186/s13024-018-0296-y [PubMed]
- 64. Wang H, Liu J, Zong Y, Xu Y, Deng W, Zhu H, Liu Y, Ma C, Huang L, Zhang L, Qin C. miR-106b aberrantly expressed in a double transgenic mouse model for Alzheimer’s disease targets TGF-β type II receptor. Brain Res. 2010; 1357:166–74. https://doi.org/10.1016/j.brainres.2010.08.023 [PubMed]
- 65. Wyss-Coray T. Tgf-Beta pathway as a potential target in neurodegeneration and Alzheimer’s. Curr Alzheimer Res. 2006; 3:191–5. https://doi.org/10.2174/156720506777632916 [PubMed]
- 66. Zhang X, Xue C, Lin J, Ferguson JF, Weiner A, Liu W, Han Y, Hinkle C, Li W, Jiang H, Gosai S, Hachet M, Garcia BA, et al. Interrogation of nonconserved human adipose lincRNAs identifies a regulatory role of linc-ADAL in adipocyte metabolism. Sci Transl Med. 2018; 10:eaar5987. https://doi.org/10.1126/scitranslmed.aar5987 [PubMed]
- 67. Liu HB, Muhammad T, Guo Y, Li MJ, Sha QQ, Zhang CX, Liu H, Zhao SG, Zhao H, Zhang H, Du YZ, Sun K, Liu K, et al. RNA-Binding Protein IGF2BP2/IMP2 is a Critical Maternal Activator in Early Zygotic Genome Activation. Adv Sci (Weinh). 2019; 6:1900295. https://doi.org/10.1002/advs.201900295 [PubMed]