


Introduction
Previous studies have suggested that amyloid-beta (Aβ) peptide deposition in the brain is an early neural change in patients with Alzheimer’s disease (AD) [1, 2]. However, the etiopathogenesis of AD are not well explained. Recent evidence has focused on a potential role of gut microbiota (GM) in the development or exacerbation of AD [3–5].
There are thousands of microbes residing in the human gut, which involves crucial functions for individual physiology and development [6]. Moreover, accumulating evidence has revealed that the gut and central nervous system (CNS) interact with one another through the following neuro-chemical pathways. First, GM may produce and release neurotransmitters and neurotoxins such as short-chain fatty acids (SCFAs), 5HT, acetylcholine, tryptophan, and D-lactate and ammonia [7–9]. All these molecules are transmitted by the systemic circulation and then cross the blood-brain barrier (BBB) to modulate neural activities. Second, connections of enteric nervous system (ENS) and CNS is through the vagus nerve and the autonomic nervous system [10]. Upon activation of ENS, it receives signals from GM, and then affects the gut cells and regulates anti-inflammatory effects of the peripheral immune system [11, 12]. Finally, GM is involved in the modulation of immune system through the synthesis and release of pro-inflammatory cytokines such as interleukin-1, interleukin-6 and tumor necrosis factor-alpha [13, 14]. Interestingly, previous studies have found that GM affects the host’s maturation of the neuroendocrine, nervous, and immune system; hence, the gut-brain axis plays an important role in the bidirectional communications between the ENS and CNS [15–17]. Notably, compelling evidence has proposed that any disturbance in these routes would potentially be associated with the AD occurrence [18, 19].
More recently, the changes in diversity and equilibrium of GM have attracted much attention in many neurological and psychiatric disorders. When the intestinal ecosystem is abnormally altered, the composition of GM becomes imbalanced (i.e., dysbiosis). This dysbiotic pattern prompts the host to establish a disease-related microbial community, leading to leaky intestine and BBB, as well as bacterial translocation [20]. Animal studies have demonstrated that gut dysbiosis is involved in the pathogenesis of AD [21, 22]. Studies from clinical settings have also explored the composition of GM in the patients with AD spectrum, including mild cognitive impairment (MCI) and AD [23–28]. Several GM strains were reported to be associated with the cognitive functions and neuropsychiatric symptoms in patients with AD [29]. Furthermore, it has been suggested that probiotics supplementation may be an effective dietary intervention for individuals with AD [30, 31] and other conditions, such as polycystic ovarian syndrome [32] and major depressive disorder [33].
It is interesting to note that the composition of GM is distinct from country to country. For instance, a previous study from U.S. showed an alteration of GM in patients with AD, comprising increased Bacteroidetes and reduced Actinobacteria in the phylum level [26]. In contrast, Zhuang and colleagues demonstrated opposite results in Chinese patients with AD (i.e., reduced Bacteroidetes and increased Actinobacteria) [27]. In addition, the magnitudes of gut dysbiosis have been reported to be different between patients with MCI and AD. Most of the existing literature revealed that patients with AD, but not MCI, demonstrated significantly reduced GM diversity compared to healthy older adults [25, 26, 29]. However, there was a study reporting similar GM diversity and abundance in patients with MCI and AD [24]. Thus, it remains unclear whether different clinical stages lead to different magnitudes of gut dysbiosis.
To the best of our knowledge, no statistical review of GM structure in patients with AD spectrum has been performed. Therefore, the purpose of this study was two-fold. First, we aimed to determine the differences of GM diversity and abundance between the patients with AD spectrum and healthy controls (HC). Second, we further examined the potential effects of different countries and clinical stages on GM abundance.
Methods
Literature search
This meta-analysis followed the Preferred Reporting Items for Systematic reviews and Meta-Analyses (PRISMA) guidelines [34]. We conducted a comprehensive literature search in PubMed, MEDLINE, Scopus, and Cochrane Library electronic databases from January 2000 to August 2021, with combinations of the following terms: (“Alzheimer’s disease” OR “dementia” OR “mild cognitive impairment” OR “cognitive dysfunction”) AND (“microbiota” OR “gut microbiota” OR “microbiome”). Moreover, the reference lists of the selected articles or reviews were also included as additional studies.
Eligibility criteria
Two authors (CCH and CHC) independently screened and identified the full texts that met the following inclusion criteria: (1) they were peer-reviewed articles written in English; (2) GM diversity and abundance was compared between patients with AD spectrum and HC; (3) GM was derived from stool samples; (4) only pre-intervention data were collected from the intervention studies; (5) the GM strains were investigated by at least three studies; (6) adequate statistical data (e.g., mean, standard deviation, p values, median, maximum, minimum, etc.) to estimate effect sizes. Studies of case reports, systematic reviews and animal research were excluded.
Outcome measures
The primary outcomes consisted of GM diversity (including α diversity and β diversity) and differences of GM abundance between the patients with AD spectrum and HC. The secondary outcomes consisted of the effects of different countries and clinical stages on GM abundance.
Data extraction
The necessary data of each study regarding the number of participants, age, body mass index, diabetes mellitus, dietary assessments, diversity and abundance of GM, etc. were extracted by CCH and checked by CHC. Median, minimum, maximum, or 95% confidence interval (CI) from 5 studies were estimated from the bar graphs [25–28, 35]. Discrepancies with study criteria or data coding were resolved by debate and consensus.
Risk of bias assessment
Two authors (CCH and CHC) independently assessed the risk of bias in each included study using the Risk of Bias Assessment Tool for Nonrandomized Studies (RoBANS) [36], which evaluates six possible sources of bias: selection of participants, confounding variables, measurement of exposure, blinding of outcome assessments, incomplete outcome data, and selective outcome reporting. Disagreements were resolved by consensus or by consultation with a third author.
Effect size calculations
The Comprehensive Meta-Analysis Version 3 software (Biostat Inc., Englewood, NJ, USA) was applied to calculate the effect sizes with a random-effect, inverse-variance weighted model. Postulating that departures from Gaussian distributions were not serious, we used previously reported conversion equations [37] to estimate means and standard deviation from median, maximum and minimum. Hedges’ g effect sizes were derived from the mean differences between groups of AD spectrum and HC, divided by the pooled standard deviation of these groups. Heterogeneity across each study was evaluated using Q-statistic and I2. Additionally, the inclusion of outliers may result in bias and significantly influence the pooled effect sizes [38, 39]. We defined the outliers with the following criteria: 1) for which the upper boundary of the 95% CI is lower than the lower boundary of the overall effect CI (i.e., extremely small effect sizes); (2) for which the lower boundary of the 95% CI is higher than the upper boundary of the overall effect CI (i.e., extremely large effect sizes).
Potential publication bias of each GM abundance was quantitatively assessed by Begg and Mazumdar rank correlation [40] and Egger’s regression intercept tests [41]. Moreover, the Duval and Tweedie’s trim and fill method was used to correct for non-normal distribution of effect sizes potentially due to the file drawer problem. The significant levels were set at p < 0.05.
Availability of data
Data available on request from the corresponding authors.
Results
Study selection and characteristics
By the comprehensive literature search, 164 relevant articles were yielded when duplications were excluded. After the review of the titles and abstracts, 14 studies were potentially eligible for our meta-analysis. After carefully examining the full texts, three additional studies were removed: two did not provide sufficient data [42, 43] and one did not report common GM strains as other studies [44]. Therefore, the remaining 11 articles were included in the final meta-analysis (Figure 1). Table 1 summarizes the clinical and demographic characteristics of the 11 studies. These studies were performed in China [23–25, 27, 29, 35, 45, 46] and U.S. [26, 28, 47], with a total of 378 HC and 427 patients with AD spectrum (AD = 251, MCI = 124, aMCI = 52).
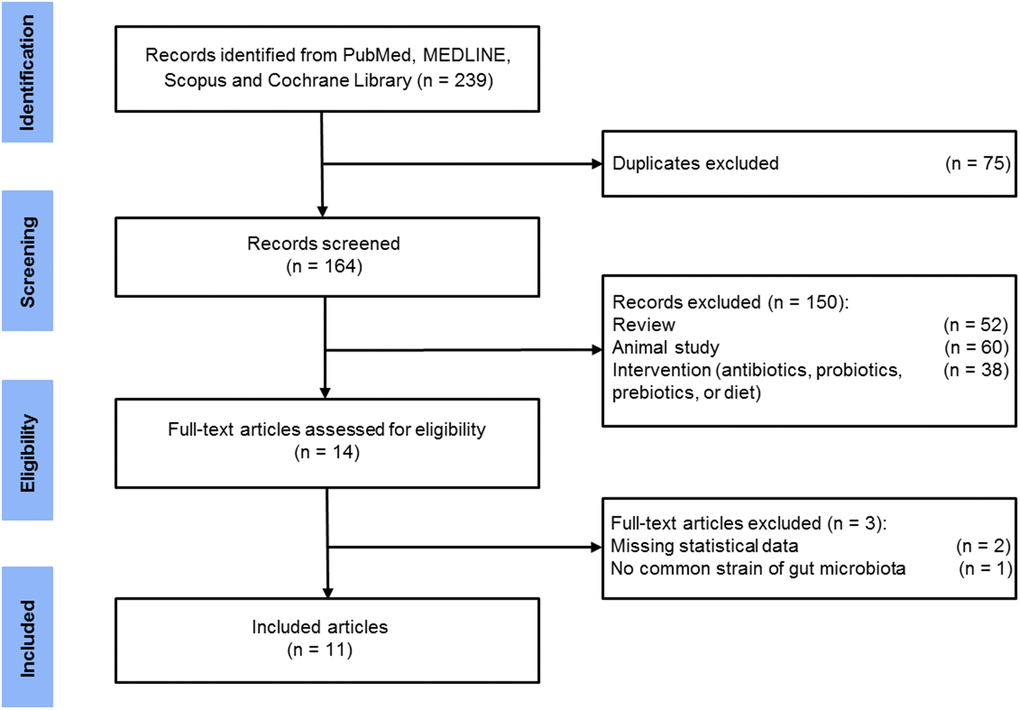
Figure 1. Flow diagram of selected studies.
Table 1. Characteristics of each study included in the meta-analysis.
| Study Country | HC | Stage | AD spectrum | Dietary check | Genetic analysis | ||||||||||||||||||||||||||||||||||||||||||||||||||||||||||||||||||||||||||||||||||||||||||||||
| N | Sex (M/F) | Age | BMI | DMa | N | Sex (M/F) | Age | BMI | DMa | ||||||||||||||||||||||||||||||||||||||||||||||||||||||||||||||||||||||||||||||||||||||||||
| Vogt et al. (2017) | U.S. | 25 | 7/18 | 69.3 ± 7.5 | 26.1 [24.3, 33.2]b | 2 (8) | AD | 25 | 8/17 | 71.3 ± 7.3 | 26.0 [22.9, 29.1]b | 2(8) | NR | 16S rRNA gene sequencing using Illumina DNA extraction method: NR MiSeq platform (2 × 250-bp) Region: V4 Pipeline analysis: Mothur Database: Greengenes | |||||||||||||||||||||||||||||||||||||||||||||||||||||||||||||||||||||||||||||||||||||
| Zhuang et al. (2018) | China | 43 | 23/20 | 69.7 ± 9.2 | NR | 5 (11.6) | AD | 43 | 23/20 | 70.1 ± 8.8 | NR | 7 (16.3) | NR | 16S rRNA gene sequencing using Illumina DNA extraction method: Power Soil Kit MiSeq platform (2 x 300-bp) Region: V3-V4 Pipeline analysis: QIIME Database: RDP | |||||||||||||||||||||||||||||||||||||||||||||||||||||||||||||||||||||||||||||||||||||
| Haran et al. (2019) | U.S. | 51 | 8/43 | 80.3 ± 10.2 | NR | 11 (21.6) | AD | 24 | 4/20 | 84.7 ± 8.1 | NR | 5 (20.8) | Yes | DNA extraction method: PowerMag soil DNA isolation kit NextSeq 500 sequencing system (2 x 150-bp) Region: NR Pipeline analysis: KneadData Database: NCBI bacterial genomes k-mer | |||||||||||||||||||||||||||||||||||||||||||||||||||||||||||||||||||||||||||||||||||||
| Li et al. (2019) | China | 30 | 13/17 | 63.9 ± 5.1 | 24.0 ± 2.9 | 2 (6.7) | MCI AD | 30 30 | 12/18 15/15 | 65.4 ± 7.6 66.3 ± 5.1 | 23.2 ± 2.9 23.0 ± 3.5 | 3 (10) 2 (6.7) | NR | 16S rRNA gene sequencing using Illumina DNA extraction method: QIAamp DNA Stool Mini Kit MiSeq platform (2 x 300-bp) Region: V3-V4 Pipeline analysis: NR Database: NR | |||||||||||||||||||||||||||||||||||||||||||||||||||||||||||||||||||||||||||||||||||||
| Liu et al. (2019) | China | 32 | 16/16 | 76.9 ± 9.4 | 22.2 ± 2.3 | 1 (3.1) | MCIc AD | 32 33 | 14/18 19/14 | 70.5 ± 11.0 74.9 ± 11.4 | 22.4 ± 2.6 22.0 ± 1.3 | 3 (9.4) 7 (21.2) | NR | 16S rRNA gene sequencing using Illumina DNA extraction method: DNA extraction kit MiSeq platform Region: V3-V4 Pipeline analysis: QIIME Database: Greengenes | |||||||||||||||||||||||||||||||||||||||||||||||||||||||||||||||||||||||||||||||||||||
| Nagpal et al. (2019) | U.S. | 6 | 2/4 | 65.2 ± 3.7 | NR | NR | MCI | 11 | 3/8 | 64.3 ± 7.7 | NR | NR | NR | 16S rRNA gene sequencing using Illumina DNA extraction method: QiaAmp PowerFecal DNA kit MiSeq platform (2 x 300-bp) Region: V4 Pipeline analysis: QIIME Database: Greengenes | |||||||||||||||||||||||||||||||||||||||||||||||||||||||||||||||||||||||||||||||||||||
| Hou et al. (2021) | China | 47 | 22/25 | 71.7 ± 6.7 | 23.6 ± 3.3 | 3 (6.8) | AD | 30 | 17/13 | 71.9 ± 6.9 | 23.7 ± 4.8 | 7 (23.3) | Yes | 16S rRNA gene sequencing using Illumina DNA extraction method: E.Z.N.A Stool Extraction Kit MiSeq platform (2 x 300-bp) Region: V3-V4 Pipeline analysis: UPARSE Database: Greengenes | |||||||||||||||||||||||||||||||||||||||||||||||||||||||||||||||||||||||||||||||||||||
| Liu et al. (2021) | China | 22 | 9/13 | 72.7 ± 8.05 | 22.1 ± 2.3 | 1 (4.5) | MCIc | 20 | 12/8 | 68.8 ± 11.2 | 22.8 ± 2.3 | 2 (10) | NR | 16S rRNA gene sequencing using Illumina DNA extraction method: DNA extraction kit MiSeq platform Region: V3-V4 Pipeline analysis: QIIME Database: Greengenes | |||||||||||||||||||||||||||||||||||||||||||||||||||||||||||||||||||||||||||||||||||||
| Sheng et al. (2021) | China | 38 | 15/23 | 66.8 ± 5.1 | 24.0 ± 3.3 | 3 (7.9) | CId | 14 | 4/10 | 73.2 ± 7.9 | 23.4 ± 3.0 | 3 (21.4) | NR | 16S rRNA gene sequencing using Illumina DNA extraction method: QIAamp DNA Stool Mini Kit MiSeq platform (2 x 300-bp) Region: V3-V4 Pipeline analysis: NR Database: RDP | |||||||||||||||||||||||||||||||||||||||||||||||||||||||||||||||||||||||||||||||||||||
| Zhang et al. (2021) | China | 52 | 24/28 | 62.5 ± 4.0 | 24.2 ± 3.1 | NR | MCI | 75 | 36/39 | 62.0 ± 4.1 | 24.7 ± 2.9 | NR | Yes | 16S rRNA gene sequencing using Illumina DNA extraction method: Power Fecal DNA Isolation Kit HiSeq platform Region: V4 Pipeline analysis: QIIME Database: NR | |||||||||||||||||||||||||||||||||||||||||||||||||||||||||||||||||||||||||||||||||||||
| Zhou et al. (2021) | China | 32 | 14/18 | 71.1 ± 5.9 | 21.7 ± 1.5 | 4 (12.5) | AD | 60 | 24/36 | 72.8 ± 7.3 | 22.1 ± 1.7 | 10 (16.7) | NR | 16S rRNA gene sequencing using Illumina DNA extraction method: QIAamp DNA Stool Mini Kit MiSeq platform (2 x 250-bp) Region: V3-V4 Pipeline analysis: Mothur Database: RDP | |||||||||||||||||||||||||||||||||||||||||||||||||||||||||||||||||||||||||||||||||||||
| Abbreviations: HC: healthy control; MCI: mild cognitive impairment; AD: Alzheimer’s disease; BMI: Body Mass Index; DM: diabetes mellitus; M: male; F: female; NR: not reported; QIIME: Quantitative Insights Into Microbial Ecology; RDP: Ribosomal Database Project. aDM was presented as n (%); bBMI was presented as median [interquartile range]; camnestic MCI; dthe patients consisted of MCI (n = 8) and AD (n = 6). | |||||||||||||||||||||||||||||||||||||||||||||||||||||||||||||||||||||||||||||||||||||||||||||||||||
Primary outcomes: α diversity and β diversity
Among the indices of α diversity, Shannon index and Simpson index were most frequently measured in our included articles. There were no significant differences of α diversity between HC and AD spectrum (Figure 2). However, when patients with AD spectrum were divided into those with MCI and AD, the results showed that AD but not MCI demonstrated significantly reduced α diversity as indexed by Shannon index (Hedges’ g = 0.237; 95% CI = 0.023 to 0.451; p = 0.030; n = 5) and Simpson index (Hedges’ g = 0.395; 95% CI = 0.116 to 0.674; p = 0.005; n = 3).
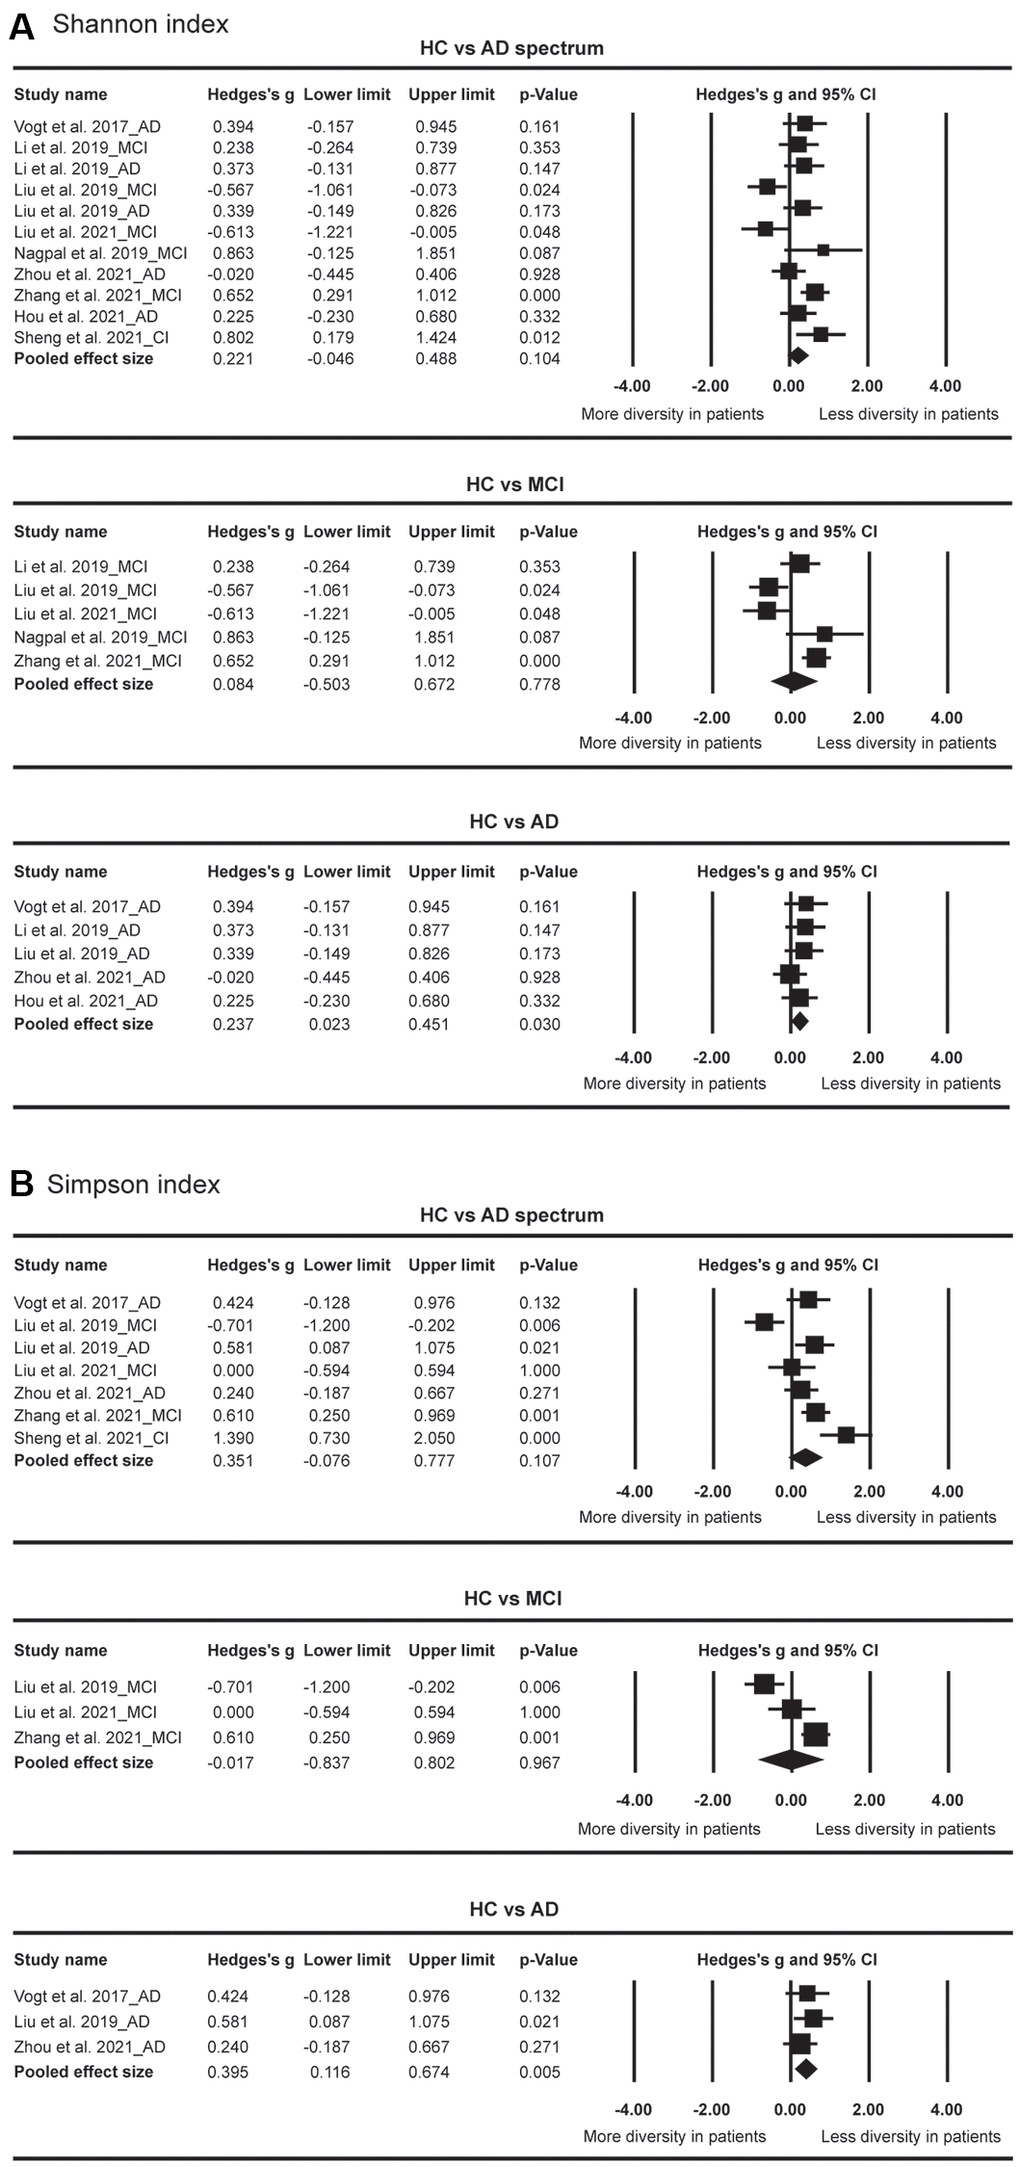
Figure 2. Forest plots of Shannon index (A) and Simpson index (B) in the comparisons between healthy controls (HC) and Alzheimer’s disease (AD) spectrum. Patients with AD spectrum consisted of mild cognitive impairments (MCI) and AD.
Among all the included articles except for three studies [27, 35, 47], seven indicators of β diversity were assessed (Table 2). The principal coordinate analyses based on both Weighted UniFrac distance and Unweighted UniFrac distances were most frequently measured. In terms of Weighted UniFrac distance, three studies revealed significant differences [24, 29, 46], while four studies revealed no significant differences between HC and AD spectrum [23, 25, 28, 45]. In terms of Unweighted UniFrac distances, two studies revealed significances [24, 29] while four studies revealed no significant differences between HC and AD spectrum [23, 25, 28, 45]. In brief, the findings were inconsistent in our included studies.
Table 2. Summary of beta diversity assessments in the included studies.
| Study | β diversity | Findings | Statistic value | ||||||||||||||||||||||||||||||||||||||||||||||||||||||||||||||||||||||||||||||||||||||||||||||||
| Vogt et al. (2017) | NMDS of Weighted UniFrac distances NMDS of Unweighted UniFrac distances NMDS based on Bray-Curtis dissimilarity | A significant difference in gut microbial composition between AD and HC A significant difference in gut microbial composition between AD and HC A significant difference in gut microbial composition between AD and HC | p < 0.001 p < 0.005 p < 0.001 | ||||||||||||||||||||||||||||||||||||||||||||||||||||||||||||||||||||||||||||||||||||||||||||||||
| Li et al. (2019) | PCoA of Weighted UniFrac distances PCoA of Unweighted UniFrac distances | A significant difference in gut microbial composition among AD, MCI and HC No significant difference in gut microbial composition between AD and MCI A significant difference in gut microbial composition among AD, MCI and HC No significant difference in gut microbial composition between AD and MCI | p = 0.001 NR p = 0.001 NR | ||||||||||||||||||||||||||||||||||||||||||||||||||||||||||||||||||||||||||||||||||||||||||||||||
| Liu et al. (2019) | PCoA of Weighted UniFrac distances PCoA of Unweighted UniFrac distances PCoA based on Bray-Curtis dissimilarity | No significant difference in gut microbial composition among AD, MCIa and HC No significant difference in gut microbial composition among AD, MCIa and HC A significant difference in gut microbial composition between AD and HC A significant difference in gut microbial composition between AD and MCIa A significant difference in gut microbial composition between MCIa and HC | NR NR p = 0.017 p = 0.005 p = 0.012 | ||||||||||||||||||||||||||||||||||||||||||||||||||||||||||||||||||||||||||||||||||||||||||||||||
| Nagpal et al. (2019) | PCoA of Weighted UniFrac distances PCoA of Unweighted UniFrac distances | No significant difference between MCI and HC No significant difference between MCI and HC | NR NR | ||||||||||||||||||||||||||||||||||||||||||||||||||||||||||||||||||||||||||||||||||||||||||||||||
| Hou et al. (2021) | PCoA of Weighted UniFrac distances PCoA of Unweighted UniFrac distances PCoA based on Bray-Curtis dissimilarity | No significant difference in gut microbial composition between AD and HC No significant difference in gut microbial composition between AD and HC A slight difference in gut microbial composition between AD and HC | p = 0.233 p = 0.065 p = 0.039 | ||||||||||||||||||||||||||||||||||||||||||||||||||||||||||||||||||||||||||||||||||||||||||||||||
| Sheng et al. (2021) | PCoA of Weighted UniFrac distances PCoA of Unweighted UniFrac distances PCoA based on Bray-Curtis dissimilarity | A marginal difference in gut microbial composition between CIb and HC No significant difference in gut microbial composition among CIb, SCD and HC A significant difference in gut microbial composition between CIb and HC | p = 0.053 NR p = 0.047 | ||||||||||||||||||||||||||||||||||||||||||||||||||||||||||||||||||||||||||||||||||||||||||||||||
| Zhang et al. (2021) | PCoA of Weighted UniFrac distances | A significant difference in gut microbial composition between MCI and HC | p = 0.008 | ||||||||||||||||||||||||||||||||||||||||||||||||||||||||||||||||||||||||||||||||||||||||||||||||
| Zhou et al. (2021) | PCoA of Weighted UniFrac distances PCoA of Unweighted UniFrac distances PLS-DA | A significant difference in gut microbial composition between AD and HC A significant difference in gut microbial composition between AD and HC A clear difference in gut microbial composition between AD and HC | p = 0.026 p < 0.001 NR | ||||||||||||||||||||||||||||||||||||||||||||||||||||||||||||||||||||||||||||||||||||||||||||||||
| Abbreviations: HC: healthy control; MCI: mild cognitive impairment; AD: Alzheimer’s disease; SCD: subjective cognitive decline; ACE: Abundance-based Coverage Estimator; NMDS: Non-metric multidimensional scaling; PCoA: Principal Coordinate Analysis; PLS-DA: Partial Least Squares Discriminant Analysis. aamnestic MCI; bthe patients consisted of MCI (n = 8) and AD (n = 6). | |||||||||||||||||||||||||||||||||||||||||||||||||||||||||||||||||||||||||||||||||||||||||||||||||||
Primary outcome: overall effect sizes by disease
In terms of the phylum level (Figure 3), the results showed more abundance of Proteobacteria (Hedges’ g = −0.349; 95% CI = −0.604 to −0.095; p = 0.007; n = 6) in AD spectrum versus HC. No significant difference was observed for Firmicutes between AD spectrum and HC (p = 0.833; n = 8). After the exclusion of two outliers [24], a significantly less abundance of Firmicutes (Hedges’ g = 0.538; 95% CI = 0.224 to 0.853; p = 0.001; n = 6) was observed in AD spectrum versus HC. The abundance of Bacteroidetes and Actinobacteria did not show obvious difference between AD spectrum and HC.
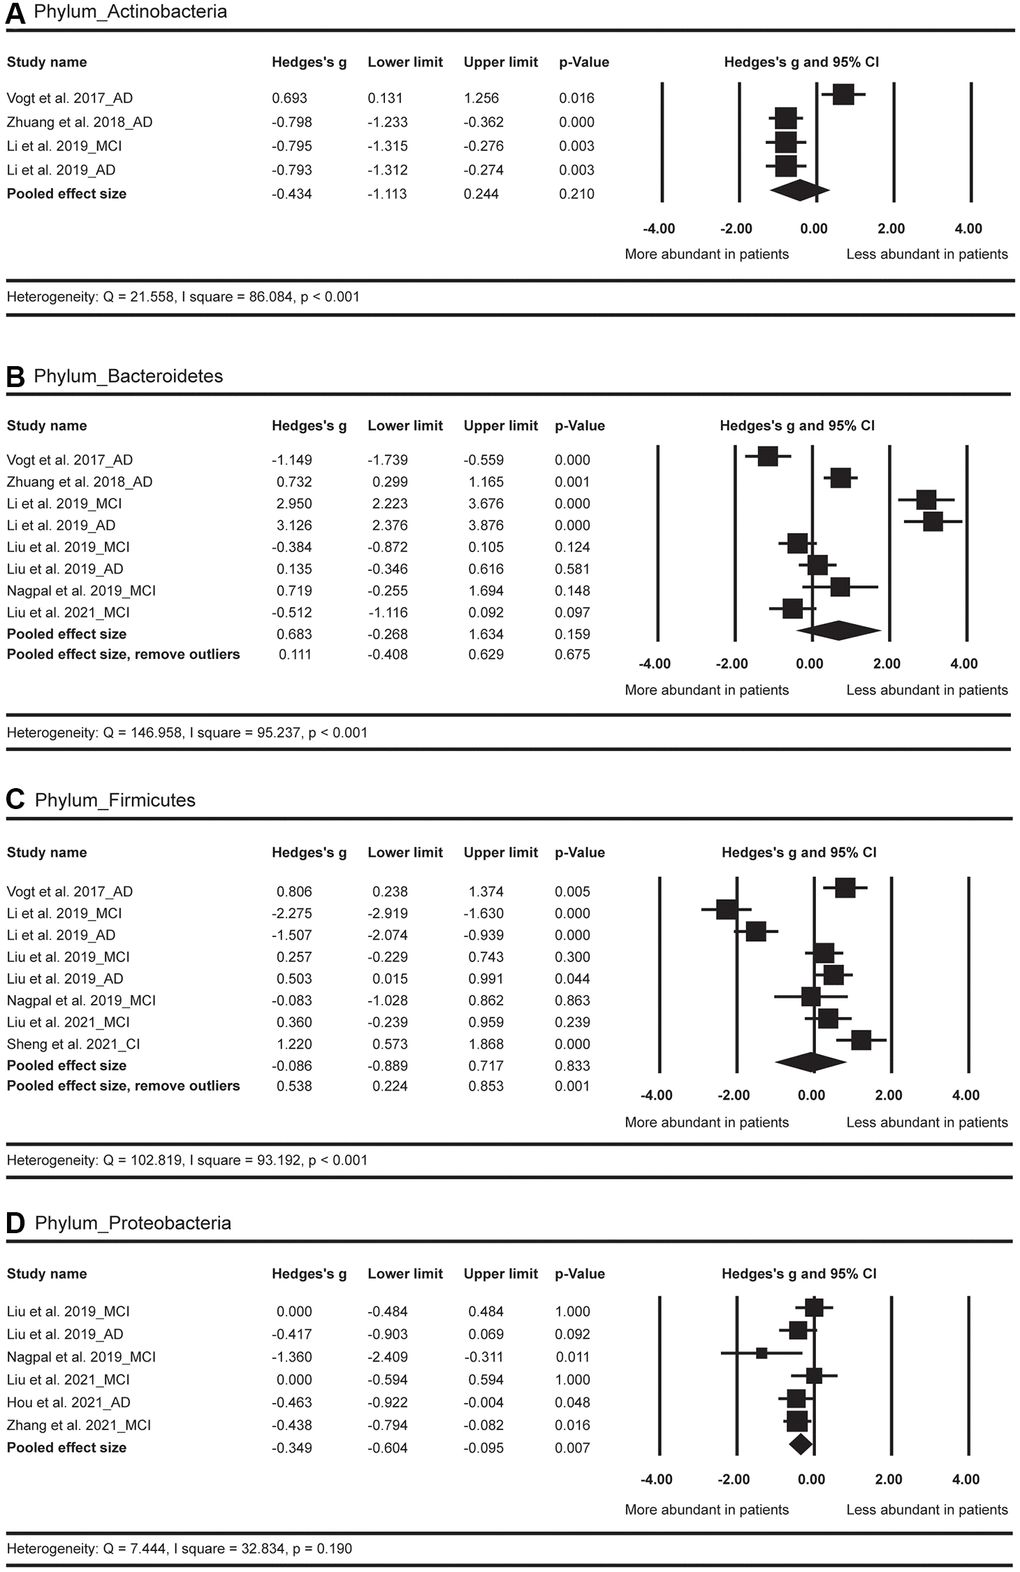
Figure 3. Forest plots of alterations of gut microbiota in the phylum level, including Actinobacteria (A), Bacteroidetes (B), Firmicutes (C), and Proteobacteria (D). Abbreviations: AD: Alzheimer’s disease; MCI: mild cognitive impairments; CI: cognitive impairments.
In terms of the class level (Figure 4), the abundance of Bacteroidia, Clostridia, and Gammaproteobacteria did not show significant differences between AD spectrum and HC.
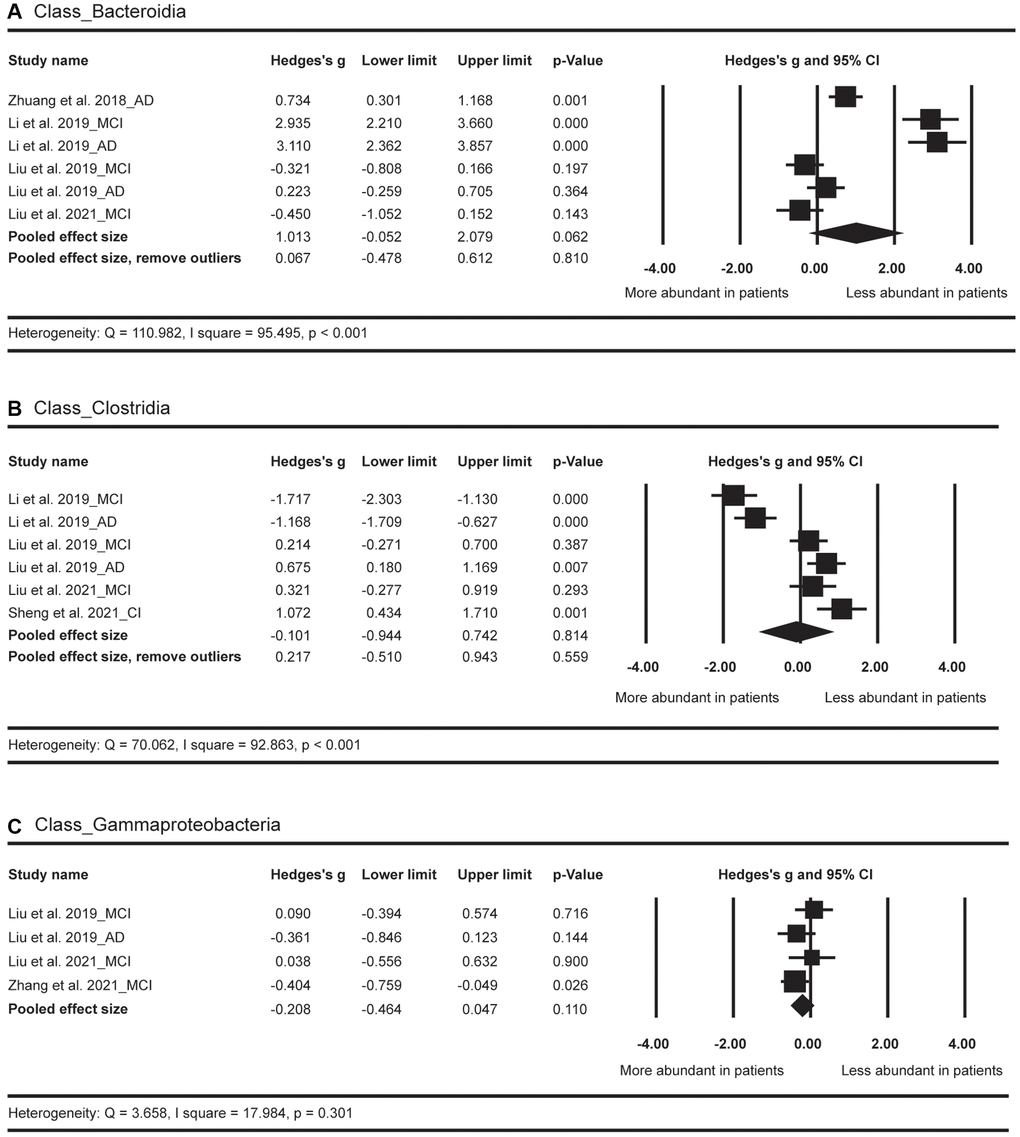
Figure 4. Forest plots of alterations of gut microbiota in the class level, including Bacteroidia (A), Clostridia (B), and Gammaproteobacteria (C). Abbreviations: AD: Alzheimer’s disease; MCI: mild cognitive impairments; CI: cognitive impairments.
In terms of the order level (Figure 5), the differences of abundance in Bacteroidales, Clostridiales, and Enterobacteriale were not significant in patients with AD spectrum as compared with HC.
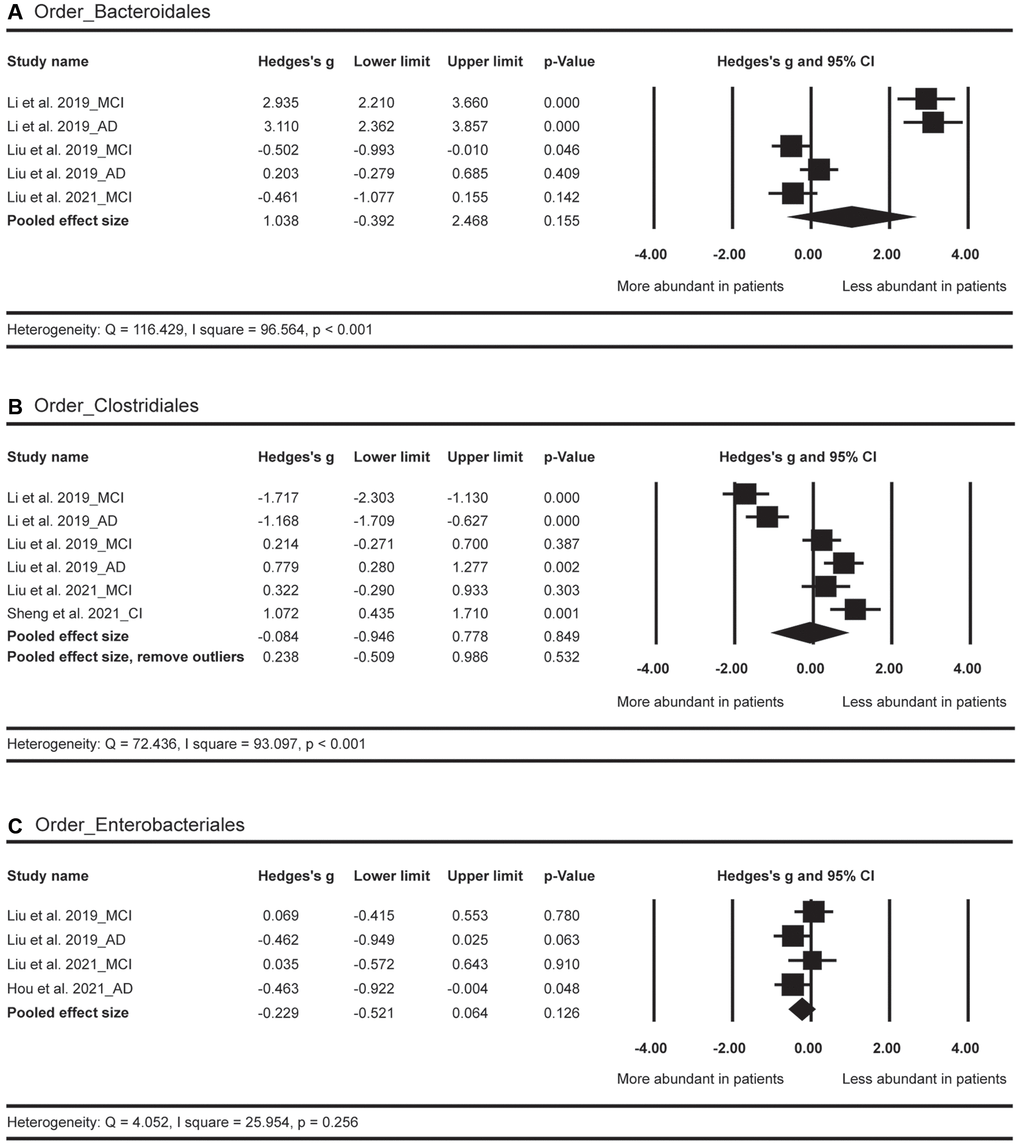
Figure 5. Forest plots of alterations of gut microbiota in the order level, including Bacteroidales (A), Clostridiales (B), and Enterobacteriale (C). Abbreviations: AD: Alzheimer’s disease; MCI: mild cognitive impairments; CI: cognitive impairments.
In terms of the family level (Figure 6), the Hedges’ g effect size was 1.061 with 95% CI = 0.555 to 1.568 (p < 0.001, n = 4) for the Clostridiaceae, suggesting a less abundant level of this GM strain in AD spectrum versus HC. The difference of the abundance in Lachnospiraceae was not significant between AD spectrum and HC (p = 0.763, n = 7). After the exclusion of two outliers [24], we discovered a less abundant level of Lachnospiraceae (Hedges’ g = 0.632; 95% CI = 0.402 to 0.862; p < 0.001; n = 5) in AD spectrum versus HC. The abundance of Rikenellaceae did not show obvious differences between these two groups (p = 0.459; n = 4). After the exclusion of one outlier [26], the pooled effect size was 0.797 (95% CI = 0.305 to 1.289; p = 0.002; n = 3), suggesting less abundant of this GM strain in AD spectrum versus HC. No obvious differences were found for Bacteroidaceae, Enterobacteriaceae, and Ruminococcaceae between these two groups.
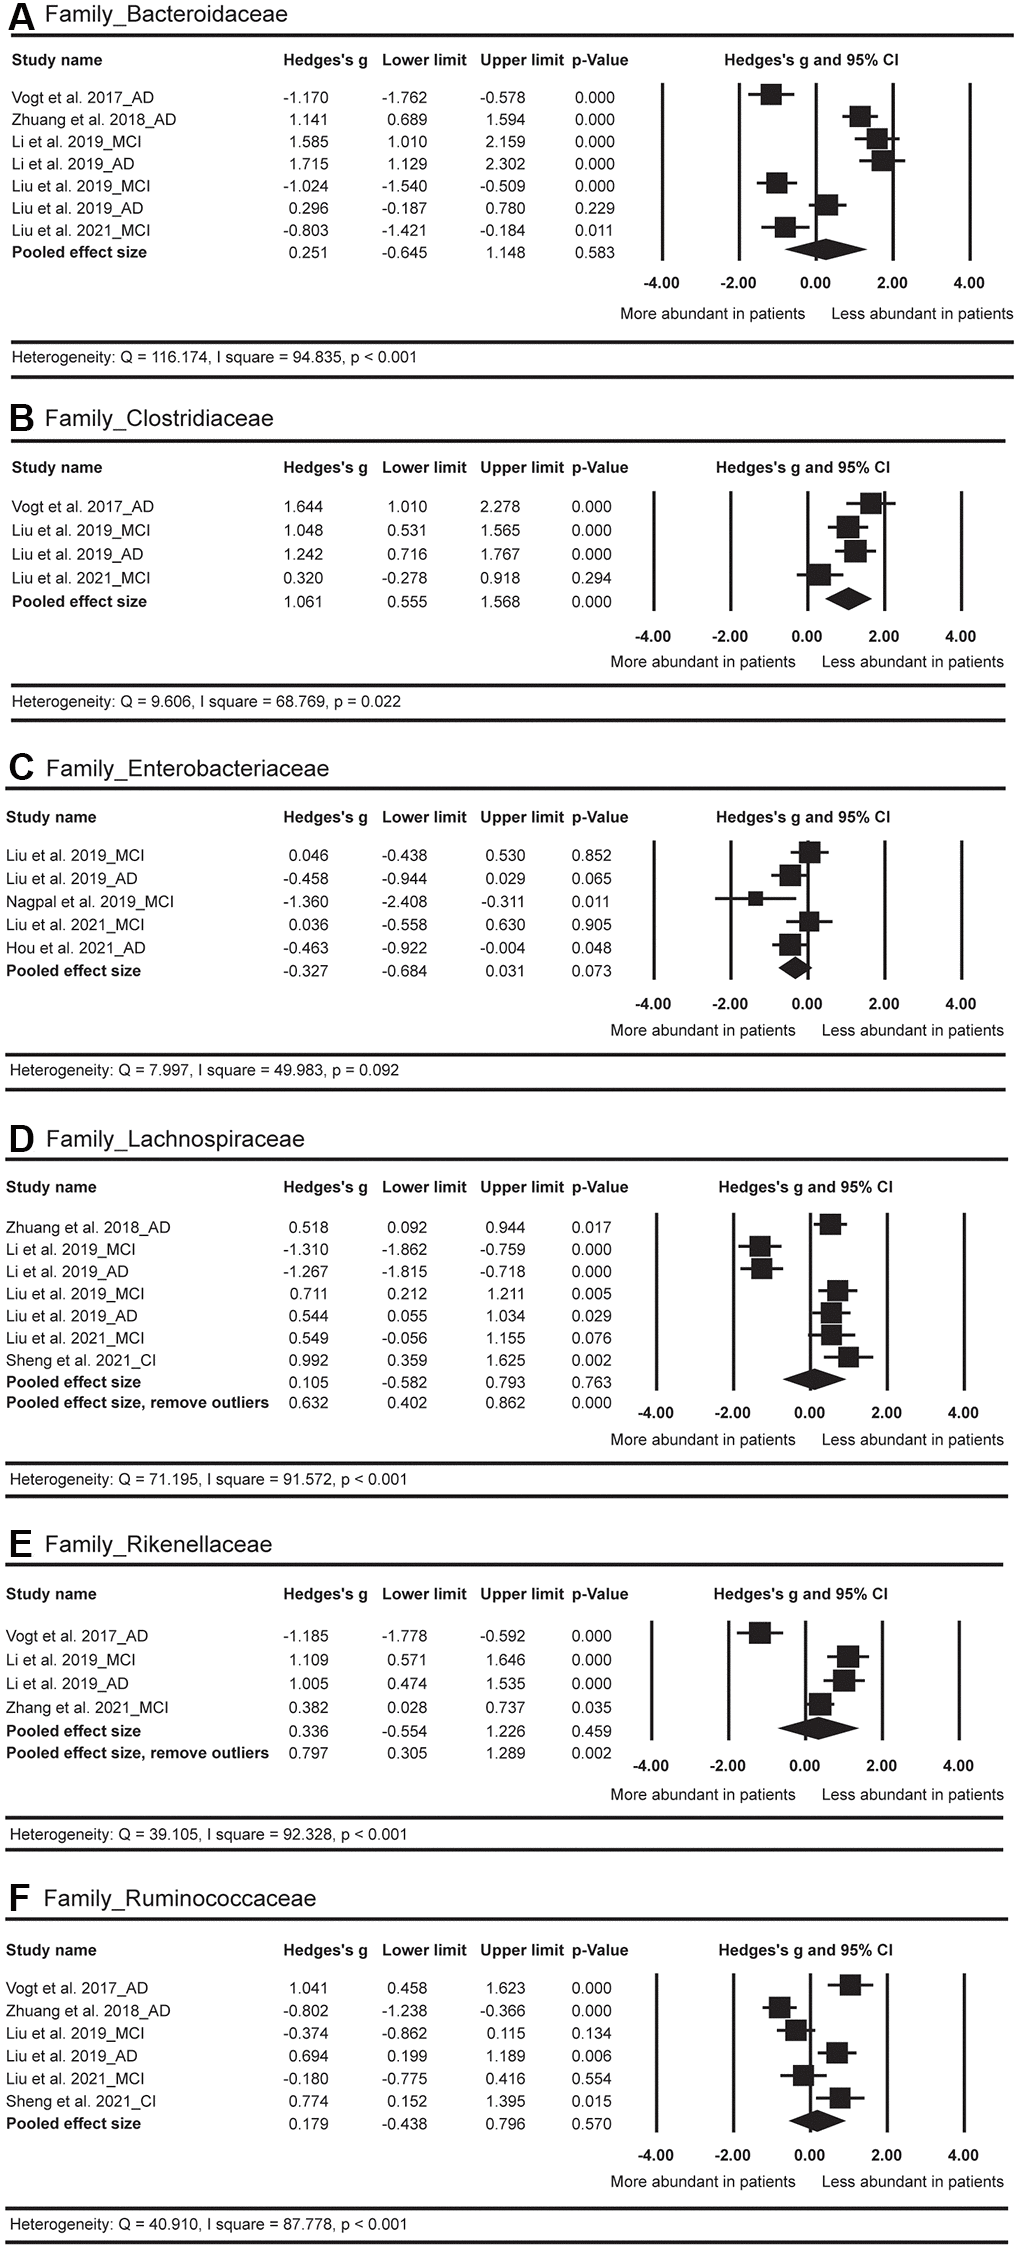
Figure 6. Forest plots of alterations of gut microbiota in the family level, including Bacteroidaceae (A), Clostridiaceae (B), Enterobacteriaceae (C), Lachnospiraceae (D), Rikenellaceae (E), and Ruminococcaceae (F). Abbreviations: AD: Alzheimer’s disease; MCI: mild cognitive impairments; CI: cognitive impairments.
In terms of the genus level (Figure 7), a more abundant level of Phascolarctobacterium (Hedges’ g = −0.852; 95% CI = −1.348 to −0.357; p = 0.001; n = 5) was found in AD spectrum versus HC. The abundance of Bifidobacterium did not show obvious differences between AD spectrum and HC (p = 0.728; n = 4). After the exclusion of one outlier [26], a significantly more abundant level of Bifidobacterium (Hedges’ g = −0.608; 95% CI = −0.886 to −0.330; p < 0.001; n = 3) was detected in AD spectrum versus HC. The abundance of Alistipes, Bacteroides, and Blautia did not show significant differences between these two groups.
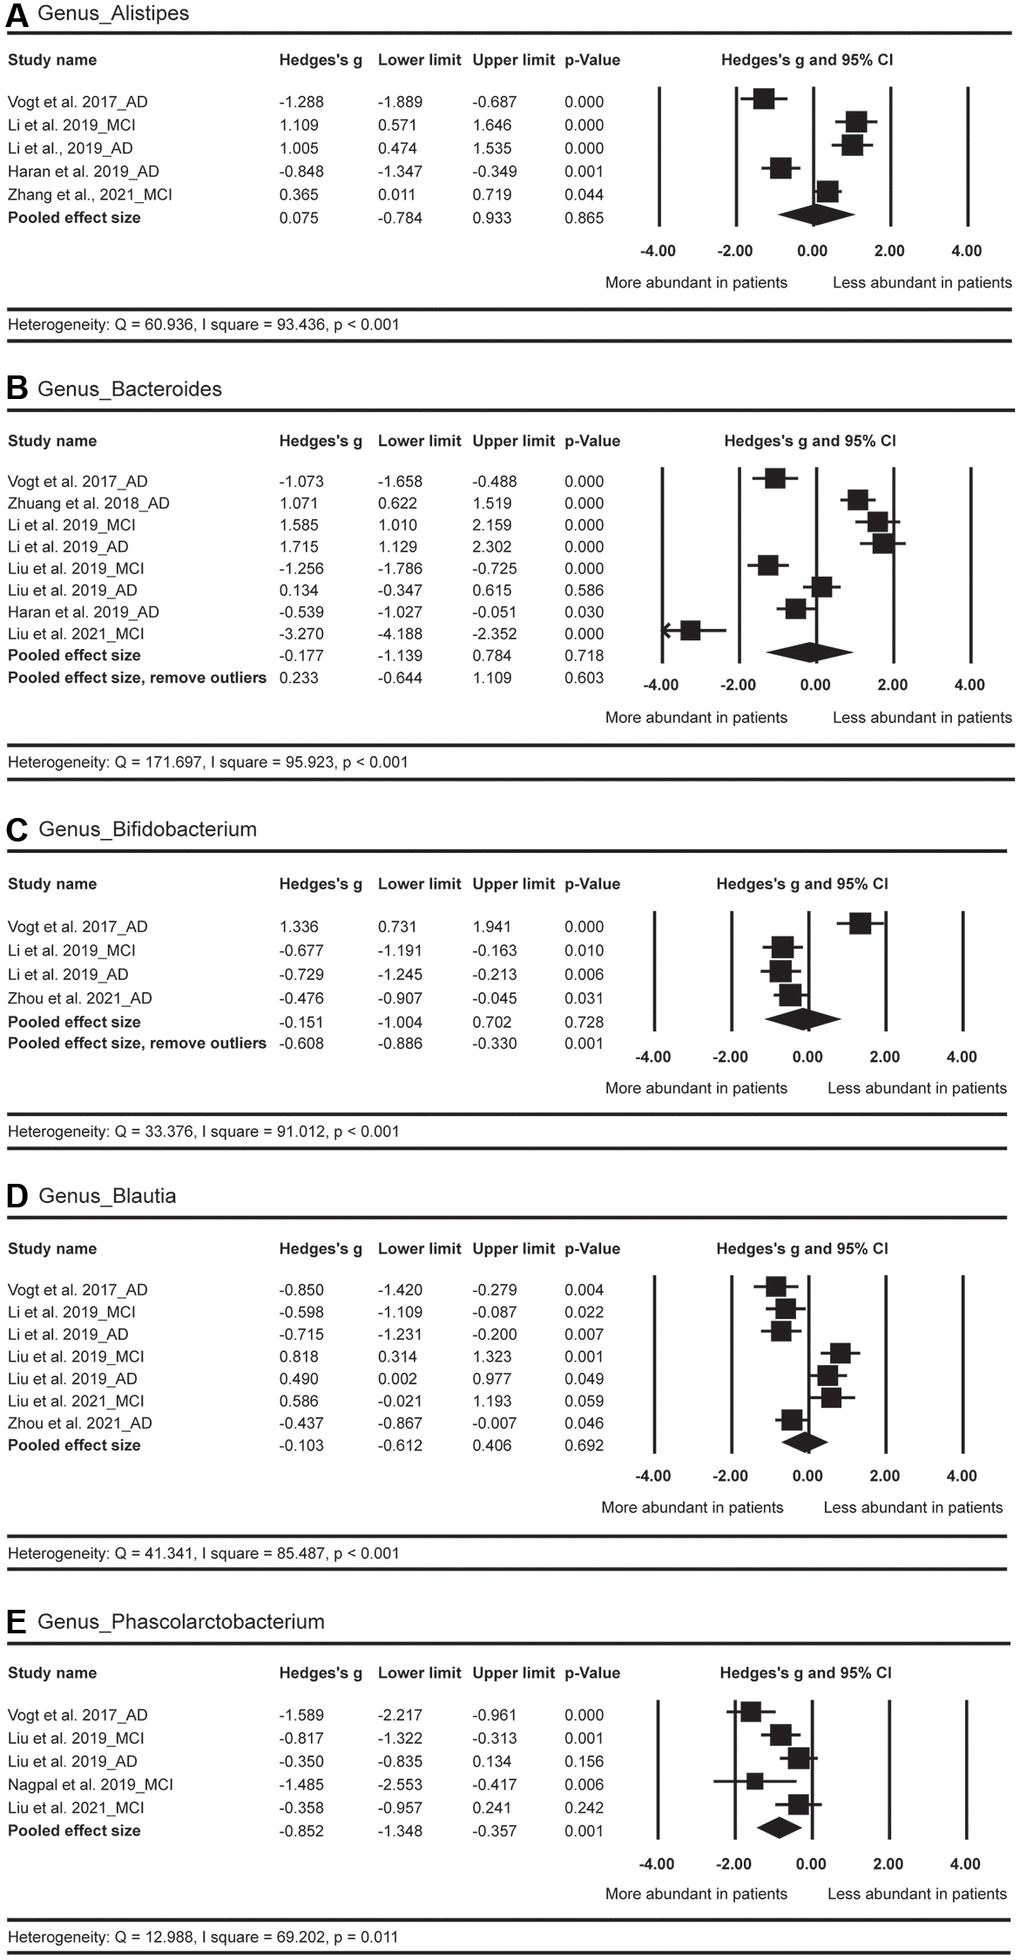
Figure 7. Forest plots of alterations of gut microbiota in the genus level, including Alistipes (A), Bacteroides (B), Bifidobacterium (C), Blautia (D), and Phascolarctobacterium (E). Abbreviations: AD: Alzheimer's disease; MCI: mild cognitive impairments.
Secondary outcome: effect sizes by country
The pooled effect size for Bacteroides was not significant in the comparison between HC and AD spectrum (Figure 7). However, when country was considered as a moderator, the pooled effect sizes for U.S. (n = 2) and for China (n = 6) were −0.781 (with 95% CI from −1.301 to −0.26, p = 0.003) and 0.027 (with 95% CI from −1.194 to 1.249, p = 0.965), respectively. In brief, compared with HC, the American patients with AD spectrum showed more abundance of Bacteroides, but such as pattern was not found for the Chinese patients (Table 3).
Table 3. Summary of effect sizes with 95% CI when country is considered as a moderator.
| U.S. | China | ||||||||||||||||||||||||||||||||||||||||||||||||||||||||||||||||||||||||||||||||||||||||||||||||||
| Hedges’ g | 95% CI | p | Hedges’ g | 95% CI | p | ||||||||||||||||||||||||||||||||||||||||||||||||||||||||||||||||||||||||||||||||||||||||||||||
| P_Bacteroidetes | −0.257 | [−2.086, 1.572] | 0.783 | 0.983 | [−0.108, 2.075] | 0.077 | |||||||||||||||||||||||||||||||||||||||||||||||||||||||||||||||||||||||||||||||||||||||||||||
| P_Firmicutes | 0.455 | [−0.411, 1.301] | 0.308 | −0.237 | [−1.231, 0.758] | 0.641 | |||||||||||||||||||||||||||||||||||||||||||||||||||||||||||||||||||||||||||||||||||||||||||||
| G_Alistipes | −1.035 | [−1.461, −0.609] | < 0.001 | 0.792 | [0.287, 1.296] | 0.002 | |||||||||||||||||||||||||||||||||||||||||||||||||||||||||||||||||||||||||||||||||||||||||||||
| G_Bacteroides | −0.781 | [−1.301, −0.260] | 0.003 | 0.027 | [−1.194, 1.249] | 0.965 | |||||||||||||||||||||||||||||||||||||||||||||||||||||||||||||||||||||||||||||||||||||||||||||
| G_Phascolarctobacterium | −1.562 | [−2.104, −1.021] | < 0.001 | −0.519 | [−0.828, −0.211] | 0.001 | |||||||||||||||||||||||||||||||||||||||||||||||||||||||||||||||||||||||||||||||||||||||||||||
| Abbreviations: CI: confidence interval; P: phylum; G: Genus. The effect sizes were reported only when the number of investigations ≧ 2 in both countries. | |||||||||||||||||||||||||||||||||||||||||||||||||||||||||||||||||||||||||||||||||||||||||||||||||||
It was also interesting to note that in terms of Alistipes, the effect size for U.S. was −1.035 (with 95% CI from −1.461 to −0.609, p < 0.001; n = 2), suggesting more abundant of this GM strain for American patients with AD spectrum. However, the overall effect size for China was 0.792 (with 95% CI from 0.287 to 1.296, p = 0.002; n = 3), suggesting less abundant of this GM strain for Chinese patients with AD spectrum (Table 3).
Different countries did not significantly modulate the abundance of Bacteroidetes, Firmicutes, and Phascolarctobacterium in the comparisons between HC and AD spectrum.
Secondary outcome: Effect sizes by clinical stage
The abundance of Proteobacteria was increased in the patients with AD spectrum. However, the significance was only found in the comparison between HC and AD (Hedges’ g = −0.441, 95% CI = −0.775 to −0.108, p = 0.01; n = 2), but not in the comparison between HC and MCI (Hedges’ g = −0.317, 95% CI = −0.739 to 0.106, p = 0.142; n = 4). Similar trend of abundance was found in the Phascolarctobacterium, revealing that the abundance of this GM was significantly increased in patients with MCI versus HC (Hedges’ g = −0.763, 95% CI = −1.277 to −0.248, p = 0.004; n = 3) (Table 4).
Table 4. Summary of effect sizes with 95% CI when clinical stage is considered as a moderator.
| HC vs. MCI | HC vs. AD | ||||||||||||||||||||||||||||||||||||||||||||||||||||||||||||||||||||||||||||||||||||||||||||||||||
| Hedges’ g | 95% CI | p | Hedges’ g | 95% CI | p | ||||||||||||||||||||||||||||||||||||||||||||||||||||||||||||||||||||||||||||||||||||||||||||||
| P_Bacteroidetes | 0.680 | [−0.879, 2.239] | 0.393 | 0.693 | [−0.712, 2.099] | 0.334 | |||||||||||||||||||||||||||||||||||||||||||||||||||||||||||||||||||||||||||||||||||||||||||||
| P_Firmicutes | −0.434 | [−1.683, 0.814] | 0.495 | −0.063 | [−1.438, 1.312] | 0.928 | |||||||||||||||||||||||||||||||||||||||||||||||||||||||||||||||||||||||||||||||||||||||||||||
| P_Proteobacteria | −0.317 | [−0.739, 0.106] | 0.142 | −0.441 | [−0.775, −0.108] | 0.010 | |||||||||||||||||||||||||||||||||||||||||||||||||||||||||||||||||||||||||||||||||||||||||||||
| C_Bacteroidia | 0.707 | [−1.228, 2.642] | 0.474 | 1.323 | [−0.087, 2.733] | 0.066 | |||||||||||||||||||||||||||||||||||||||||||||||||||||||||||||||||||||||||||||||||||||||||||||
| C_Clostridia | −0.390 | [−1.648, 0.868] | 0.544 | −0.243 | [−2.049, 1.562] | 0.792 | |||||||||||||||||||||||||||||||||||||||||||||||||||||||||||||||||||||||||||||||||||||||||||||
| O_Bacteroidales | 0.644 | [−1.372, 2.660] | 0.531 | 1.642 | [−1.207, 4.490] | 0.259 | |||||||||||||||||||||||||||||||||||||||||||||||||||||||||||||||||||||||||||||||||||||||||||||
| O_Clostridiales | −0.391 | [−1.655, 0.874] | 0.545 | −0.192 | [−2.099, 1.716] | 0.844 | |||||||||||||||||||||||||||||||||||||||||||||||||||||||||||||||||||||||||||||||||||||||||||||
| O_Enterobacteriales | 0.056 | [−0.323, 0.434] | 0.773 | −0.462 | [−0.796, −0.128] | 0.007 | |||||||||||||||||||||||||||||||||||||||||||||||||||||||||||||||||||||||||||||||||||||||||||||
| F_Bacteroidaceae | −0.082 | [−1.727, 1.564] | 0.922 | 0.500 | [−0.622, 1.621] | 0.383 | |||||||||||||||||||||||||||||||||||||||||||||||||||||||||||||||||||||||||||||||||||||||||||||
| F_Clostridiaceae | 0.700 | [−0.013, 1.413] | 0.054 | 1.406 | [1.001, 1.810] | < 0.001 | |||||||||||||||||||||||||||||||||||||||||||||||||||||||||||||||||||||||||||||||||||||||||||||
| F_Enterobacteriaceae | 0.278 | [−0.951, 0.394] | 0.417 | −0.460 | [−0.794, −0.126] | 0.007 | |||||||||||||||||||||||||||||||||||||||||||||||||||||||||||||||||||||||||||||||||||||||||||||
| F_Lachnospiraceae | −0.016 | [−1.300, 1.268] | 0.980 | −0.058 | [−1.156, 1.040] | 0.917 | |||||||||||||||||||||||||||||||||||||||||||||||||||||||||||||||||||||||||||||||||||||||||||||
| F_Rikenellaceae | 0.716 | [0.007, 1.426] | 0.048 | −0.086 | [−2.231, 2.060] | 0.937 | |||||||||||||||||||||||||||||||||||||||||||||||||||||||||||||||||||||||||||||||||||||||||||||
| F_Ruminococcaceae | −0.296 | [−0.673, 0.082] | 0.125 | 0.300 | [−0.856, 1.456] | 0.611 | |||||||||||||||||||||||||||||||||||||||||||||||||||||||||||||||||||||||||||||||||||||||||||||
| G_Alistipes | 0.708 | [−0.018, 1.435] | 0.056 | −0.374 | [−1.741, 0.993] | 0.592 | |||||||||||||||||||||||||||||||||||||||||||||||||||||||||||||||||||||||||||||||||||||||||||||
| G_Bacteroides | −0.961 | [−3.516, 1.594] | 0.461 | 0.262 | [−0.673, 1.197] | 0.583 | |||||||||||||||||||||||||||||||||||||||||||||||||||||||||||||||||||||||||||||||||||||||||||||
| G_Blautia | 0.265 | [−0.633, 1.162] | 0.563 | −0.370 | [−0.952, 0.212] | 0.213 | |||||||||||||||||||||||||||||||||||||||||||||||||||||||||||||||||||||||||||||||||||||||||||||
| G_Phascolarctobacterium | −0.763 | [−1.277, −0.248] | 0.004 | −0.953 | [−2.166, 0.260] | 0.124 | |||||||||||||||||||||||||||||||||||||||||||||||||||||||||||||||||||||||||||||||||||||||||||||
| Abbreviations: CI: confidence interval; P: Phylum; C: Class; O: Order; F: Family; G: Genus. The effect sizes were reported only when the number of investigations ≧ 2 in both diagnoses. | |||||||||||||||||||||||||||||||||||||||||||||||||||||||||||||||||||||||||||||||||||||||||||||||||||
In contrast, we found a trend toward decreased abundance of Clostridiaceae in the patients with MCI (Hedges’ g = 0.700, 95% CI = −0.013 to 1.413, p = 0.054; n = 2), which was more pronounced in the patients with AD (Hedges’ g = 1.406, 95% CI = 1.001 to 1.810, p < 0.001; n = 2) (Table 4).
Risk of bias
The quality of the included studies is summarized in Supplementary Table 1. Each study was classified as low risk in five criteria. In the criteria of confounding variables, all studies, except for one [23], suffered from a high-risk bias due to the potential confounding factors (e.g., body mass index, diabetes and diet) on GM structure.
Publication bias
The Begg and Mazumdar rank correlations as well as Egger’s regression intercept tests confirmed that most of these meta-analysis results were not significantly biased by publication errors. The adjusted Hedges’ g was operated in 4 GM strains, including Firmicutes, Gammaproteobacteria, Bacteroidales, and Enterobacteriale (Supplementary Table 2).
Discussion
This study conducted meta-analysis to compare GM abundance between the patients with AD spectrum and HC, and yielded four major insights into the nature of GM alterations in AD spectrum. First, patients with AD, but not MCI, exhibited decreased GM diversity as compared to HC. Second, Proteobacteria, Bifidobacterium and Phascolarctobacterium were more abundant in AD spectrum, whereas Firmicutes, Clostridiaceae, Lachnospiraceae and Rikenellaceae were less abundant in AD spectrum compared to HC. Third, the abundance of Alistipes was significantly increased in American patients but significantly decreased in Chinese patients as compared to HC. Altered abundance of Bacteroides was only found in the American patients but not in the Chinese patients. Finally, the abundance of Proteobacteria and Phascolarctobacterium was progressively increased from HC to AD stage, while the abundance of Clostridiaceae was gradually reduced from HC to AD stage.
To our knowledge, the present meta-analysis is the first to assess α diversity and β diversity in patients with AD spectrum. Generally, several studies have reported that alpha diversity is significantly decreased in patients with AD [25, 26] but not in patients with MCI [28, 35]. These findings were consistent with our results of meta-analysis, and there was also a trend toward a progressive decline from MCI to AD. Similarly, the decrease of α diversity was also found in other conditions, such as Parkinson’s disease [48] and irritable bowel syndrome (IBS) [49]. In terms of β diversity, further exploration is obviously needed to examine between HC and AD spectrum due to the extremely inconsistent findings.
The Proteobacteria is a major phylum of gram-negative bacteria [50]. Of note, the Proteobacteria member Escherichia coli-derived neurotoxins are correlated with AD neuropathology and increase the release of pro-inflammatory cytokines [44]. It has also been shown that an increased level of Proteobacteria was associated with pro-inflammatory dietary pattern (e.g., high-fat diet), and the abundance of Proteobacteria increased along with worse memory dysfunction [51, 52]. Taken together, our current finding that patients with AD spectrum showed abnormally more abundance of Proteobacteria was supported by previous literature.
The phylum Firmicutes serves a connection with inflammatory effects, the modulation of metabolic function and the production of SCFAs [53, 54]. Several lines of evidences have demonstrated that decreased Firmicutes was associated with the development of obesity and type 2 diabetes [55, 56]. It was also important to note that insulin resistance might lead to cerebral glucose hypometabolism and enhanced Aβ accumulation in asymptomatic middle-aged people with increased risk of AD [57, 58]. Furthermore, the abundance of Firmicutes was positively associated with the performance of executive function, suggesting that it is a kind of beneficial GM strain for the humans [45, 59].
The family Clostridiaceae performs a vital function on producing SCFAs, which can offer fuel sources for the host and protective effects on permeability of gut and BBB [60]. Moreover, it has been shown that Clostridiaceae was the producers of indole-3-propionic acid, which could prevent oxidative injuries of primary neurons from Aβ [61]. Decrease of Clostridiaceae may impair cognitive function and intrinsic brain activities as evident by the results of resting-state functional magnetic resonance imaging [35]. Correspondingly, the family Lachnospiraceae is the producer of butyrate, which participates in anti-inflammatory reactions, and in turn maintains the gut barrier [62, 63]. A number of studies have discovered that less abundance of Lachnospiraceae would result in insulin resistance, disruptions of homeostasis within the CNS and exacerbation of AD neuropathology [55, 64]. Hence, the Lachnospiraceae was considered as an advantageous GM strain.
The genus Bifidobacterium is involved in the production of acetate and γ-aminobutyric acid, which has neuroprotective effects on the hosts [65, 66]. It is worth mentioning that Bifidobacterium members have been associated with anti-inflammatory effects and reduced permeability of gut [67]. In addition, animal studies have shown that Bifidobacterium obviously alleviated the development of AD pathologies [3]. It has also been reported that probiotics with Bifidobacterium ameliorated cognitive impairments in patients with AD [68]. However, our meta-analysis exhibited an unexpected result that an increase of Bifidobacterium was found in subjects with AD spectrum. This finding might imply the potential gut-brain self-preventative mechanism to rebuild intestinal homeostasis [69]. Nevertheless, it merits future research with a larger sample size to have an in-depth investigation.
The composition and abundance of GM may be influenced by many factors such as age, geographical areas, dietary pattern, and chronic stress. In general, the random-effect sizes for Bacteroides and Alistipes in AD spectrum did not show obvious differences as compared with HC. These non-significant results were potentially owing to large heterogeneities among the included studies. When considering the country (i.e., China and U.S.) as a moderator, our meta-analysis demonstrated an overgrowth of Bacteroides and Alistipes in American patients; however, this pattern was not observed in Chinese patients. A previous meta-analysis study has found that Chinese patients with IBS did not show obvious changes of abundance in Bacteroides compared to HC; inversely, enriched abundance of Bacteroides was observed in patients with IBS from other areas such as U.S. and Finland [49]. It has also been reported that enhanced Bacteroidetes (genus Bacteroides) members might be a possible signature for AD spectrum since certain members of this phylum are opportunistic pathogens, especially Bacteroides fragilis (B. fragilis) [70]. Interestingly, B. fragilis can be divided into two strains: non-toxigenic B. fragilis (NTBF) and enterotoxigenic B. fragilis (ETBF). NTBF participates in suppression of colitis and strengthening gut barrier; in contrast, ETBF secretes B. fragilis toxins and is highly associated with inflammatory bowel disease [71, 72]. Up to the present, there has been no reasonable interpretation to account for an increased level of Alistipes abundance in patients with AD spectrum. It will be a valuable issue for future studies to validate our meta-analysis finding.
We considered the clinical stage as another moderator in the present study. Compared to HC, Proteobacteria, and Phascolarctobacterium were gradually enhanced from MCI to AD stage. The pro-inflammatory Proteobacteria has been suggested as a predictor for AD pathogenesis [23, 35]. In contrast, Clostridiaceae was found to be progressively reduced from MCI to AD patients. The abundance of beneficial Clostridiaceae has been reported to be significantly decreased in patients with AD, suggesting that it is a distinctive biomarker in predicting the development of AD. In addition, the results of some GM strains in the comparisons of HC versus MCI and HC versus AD did not show gradient changes. The abundance of Enterobacteriales was significantly increased in patients with AD, but a little decreased in patients with MCI. This non-gradient pattern from HC to AD was in line with a previous study [25, 35]. The abundance of Rikenellaceae was significantly reduced in patients with MCI, but a little enhanced in AD patients, suggesting that the association between Rikenellaceae and AD pathogenesis needs further exploration.
In spite of these interesting findings, our study was not without limitations. First, the generalization of these results to other populations is questionable because the vast majority of included studies originated from just two countries. Second, many of the studies suffer from significant sources of bias. There were obvious statistical heterogeneities among the included studies, which could be attributed to differences in dietary pattern, geographical background, center settings, and inclusion criteria of AD spectrum including various regimens, medication doses, illness duration, etc. For example, only three studies [23, 46, 47] in our meta-analysis conducted the dietary assessments. Nevertheless, we applied the random-model to estimate the effect sizes to reduce the influences of the heterogeneities on our results. Third, we manually extracted the necessary data from the bar graphs in several studies, which might lead to another type of bias. However, this procedure was performed by two reviewers with sufficient discussion and consensus. Hence, we reasoned that the direction of the statistical significance in the between-group comparisons would not be substantially affected since we performed this method uniformly across the studies. Fourth, the effects in many occasions were assessed by very few studies and thus the current results should be interpreted with cautions. It merits future research to include more studies to provide stronger evidence on this issue. Fifth, different methods of nucleic acid extraction and gene sequencing (Table 1) are also the potential biases on the results. For example, the differences of GM diversity between HC and AD spectrum might be greater based on the V3-V4 region than those on the V4 region. However, the limited number of studies (three with V4 region and seven with V3-V4 region) impeded us to perform additional analysis.
In conclusion, we demonstrated that Proteobacteria, Bifidobacterium and Phascolarctobacterium were significantly higher abundant in patients with AD spectrum, whereas Firmicutes, Clostridiaceae, Lachnospiraceae and Rikenellaceae were significantly lower in patients with AD spectrum compared to HC. Moreover, the dysbiosis of these GM can be viewed as an environmental factor of the AD initiation and progression. In the future, a larger cohort study is needed to further examine the differences of GM in AD spectrum.
Supplementary Materials
Author Contributions
Conceived and designed the work: CCH, RN, CHC; Acquired the data: CCH, CHC; Analyzed the data: CCH, RN, CHC; Participated in the discussion and provided the comments: CCH, CCC, CWH, RN, CHC; Wrote the paper: CCH, CHC; All of the authors have read and approved the manuscript.
Conflicts of Interest
The authors declare no conflicts of interest related to this study.
Funding
This work was supported by Chang Gung Memorial Hospital (CMRPD1K0061, CMRPD1K0581), Chang Gung University (BMRPE25), Healthy Aging Research Center, Chang Gung University from the Featured Areas Research Center Program within the Framework of the Higher Education Sprout Project by the Ministry of Education (MOE) in Taiwan (EMRPD1K0431), Ministry of Science and Technology (MOST-105-2628-B-182-004-MY3, MOST-108-2628-B-182-002, MOST-109-2628-B-182-012, MOST-110-2628-B-182-010), Taiwan.
References
- 1. Dubois B, Hampel H, Feldman HH, Scheltens P, Aisen P, Andrieu S, Bakardjian H, Benali H, Bertram L, Blennow K, Broich K, Cavedo E, Crutch S, et al, and Proceedings of the Meeting of the International Working Group (IWG) and the American Alzheimer's Association on “The Preclinical State of AD”; July 23, 2015; Washington DC, USA. Preclinical Alzheimer's disease: Definition, natural history, and diagnostic criteria. Alzheimers Dement. 2016; 12:292–323. https://doi.org/10.1016/j.jalz.2016.02.002 [PubMed]
- 2. Zhang ZH, Wu QY, Zheng R, Chen C, Chen Y, Liu Q, Hoffmann PR, Ni JZ, Song GL. Selenomethionine Mitigates Cognitive Decline by Targeting Both Tau Hyperphosphorylation and Autophagic Clearance in an Alzheimer's Disease Mouse Model. J Neurosci. 2017; 37:2449–62. https://doi.org/10.1523/JNEUROSCI.3229-16.2017 [PubMed]
- 3. Bonfili L, Cecarini V, Cuccioloni M, Angeletti M, Berardi S, Scarpona S, Rossi G, Eleuteri AM. SLAB51 Probiotic Formulation Activates SIRT1 Pathway Promoting Antioxidant and Neuroprotective Effects in an AD Mouse Model. Mol Neurobiol. 2018; 55:7987–8000. https://doi.org/10.1007/s12035-018-0973-4 [PubMed]
- 4. Kim MS, Kim Y, Choi H, Kim W, Park S, Lee D, Kim DK, Kim HJ, Choi H, Hyun DW, Lee JY, Choi EY, Lee DS, et al. Transfer of a healthy microbiota reduces amyloid and tau pathology in an Alzheimer's disease animal model. Gut. 2020; 69:283–94. https://doi.org/10.1136/gutjnl-2018-317431 [PubMed]
- 5. Zhang L, Wang Y, Xiayu X, Shi C, Chen W, Song N, Fu X, Zhou R, Xu YF, Huang L, Zhu H, Han Y, Qin C. Altered Gut Microbiota in a Mouse Model of Alzheimer's Disease. J Alzheimers Dis. 2017; 60:1241–57. https://doi.org/10.3233/JAD-170020 [PubMed]
- 6. Chow J, Lee SM, Shen Y, Khosravi A, Mazmanian SK. Host-bacterial symbiosis in health and disease. Adv Immunol. 2010; 107:243–74. https://doi.org/10.1016/B978-0-12-381300-8.00008-3 [PubMed]
- 7. Cani PD, Knauf C. How gut microbes talk to organs: The role of endocrine and nervous routes. Mol Metab. 2016; 5:743–52. https://doi.org/10.1016/j.molmet.2016.05.011 [PubMed]
- 8. Dinan TG, Cryan JF. The Microbiome-Gut-Brain Axis in Health and Disease. Gastroenterol Clin North Am. 2017; 46:77–89. https://doi.org/10.1016/j.gtc.2016.09.007 [PubMed]
- 9. Galland L. The gut microbiome and the brain. J Med Food. 2014; 17:1261–72. https://doi.org/10.1089/jmf.2014.7000 [PubMed]
- 10. Bonaz B, Bazin T, Pellissier S. The Vagus Nerve at the Interface of the Microbiota-Gut-Brain Axis. Front Neurosci. 2018; 12:49. https://doi.org/10.3389/fnins.2018.00049 [PubMed]
- 11. Fröhlich EE, Farzi A, Mayerhofer R, Reichmann F, Jačan A, Wagner B, Zinser E, Bordag N, Magnes C, Fröhlich E, Kashofer K, Gorkiewicz G, Holzer P. Cognitive impairment by antibiotic-induced gut dysbiosis: Analysis of gut microbiota-brain communication. Brain Behav Immun. 2016; 56:140–55. https://doi.org/10.1016/j.bbi.2016.02.020 [PubMed]
- 12. Leclercq S, Mian FM, Stanisz AM, Bindels LB, Cambier E, Ben-Amram H, Koren O, Forsythe P, Bienenstock J. Low-dose penicillin in early life induces long-term changes in murine gut microbiota, brain cytokines and behavior. Nat Commun. 2017; 8:15062. https://doi.org/10.1038/ncomms15062 [PubMed]
- 13. Rieder R, Wisniewski PJ, Alderman BL, Campbell SC. Microbes and mental health: A review. Brain Behav Immun. 2017; 66:9–17. https://doi.org/10.1016/j.bbi.2017.01.016 [PubMed]
- 14. Sampson TR, Mazmanian SK. Control of brain development, function, and behavior by the microbiome. Cell Host Microbe. 2015; 17:565–76. https://doi.org/10.1016/j.chom.2015.04.011 [PubMed]
- 15. Bohórquez DV, Shahid RA, Erdmann A, Kreger AM, Wang Y, Calakos N, Wang F, Liddle RA. Neuroepithelial circuit formed by innervation of sensory enteroendocrine cells. J Clin Invest. 2015; 125:782–6. https://doi.org/10.1172/JCI78361 [PubMed]
- 16. Mayer EA, Tillisch K, Gupta A. Gut/brain axis and the microbiota. J Clin Invest. 2015; 125:926–38. https://doi.org/10.1172/JCI76304 [PubMed]
- 17. Yano JM, Yu K, Donaldson GP, Shastri GG, Ann P, Ma L, Nagler CR, Ismagilov RF, Mazmanian SK, Hsiao EY. Indigenous bacteria from the gut microbiota regulate host serotonin biosynthesis. Cell. 2015; 161:264–76. https://doi.org/10.1016/j.cell.2015.02.047 [PubMed]
- 18. Harach T, Marungruang N, Duthilleul N, Cheatham V, Mc Coy KD, Frisoni G, Neher JJ, Fåk F, Jucker M, Lasser T, Bolmont T. Reduction of Abeta amyloid pathology in APPPS1 transgenic mice in the absence of gut microbiota. Sci Rep. 2017; 7:41802. https://doi.org/10.1038/srep41802 [PubMed]
- 19. Wang T, Hu X, Liang S, Li W, Wu X, Wang L, Jin F. Lactobacillus fermentum NS9 restores the antibiotic induced physiological and psychological abnormalities in rats. Benef Microbes. 2015; 6:707–17. https://doi.org/10.3920/BM2014.0177 [PubMed]
- 20. Ulluwishewa D, Anderson RC, McNabb WC, Moughan PJ, Wells JM, Roy NC. Regulation of tight junction permeability by intestinal bacteria and dietary components. J Nutr. 2011; 141:769–76. https://doi.org/10.3945/jn.110.135657 [PubMed]
- 21. Bäuerl C, Collado MC, Diaz Cuevas A, Viña J, Pérez Martínez G. Shifts in gut microbiota composition in an APP/PSS1 transgenic mouse model of Alzheimer's disease during lifespan. Lett Appl Microbiol. 2018; 66:464–71. https://doi.org/10.1111/lam.12882 [PubMed]
- 22. Wu SC, Cao ZS, Chang KM, Juang JL. Intestinal microbial dysbiosis aggravates the progression of Alzheimer's disease in Drosophila. Nat Commun. 2017; 8:24. https://doi.org/10.1038/s41467-017-00040-6 [PubMed]
- 23. Hou M, Xu G, Ran M, Luo W, Wang H. APOE-ε4 Carrier Status and Gut Microbiota Dysbiosis in Patients With Alzheimer Disease. Front Neurosci. 2021; 15:619051. https://doi.org/10.3389/fnins.2021.619051 [PubMed]
- 24. Li B, He Y, Ma J, Huang P, Du J, Cao L, Wang Y, Xiao Q, Tang H, Chen S. Mild cognitive impairment has similar alterations as Alzheimer's disease in gut microbiota. Alzheimers Dement. 2019; 15:1357–66. https://doi.org/10.1016/j.jalz.2019.07.002 [PubMed]
- 25. Liu P, Wu L, Peng G, Han Y, Tang R, Ge J, Zhang L, Jia L, Yue S, Zhou K, Li L, Luo B, Wang B. Altered microbiomes distinguish Alzheimer's disease from amnestic mild cognitive impairment and health in a Chinese cohort. Brain Behav Immun. 2019; 80:633–43. https://doi.org/10.1016/j.bbi.2019.05.008 [PubMed]
- 26. Vogt NM, Kerby RL, Dill-McFarland KA, Harding SJ, Merluzzi AP, Johnson SC, Carlsson CM, Asthana S, Zetterberg H, Blennow K, Bendlin BB, Rey FE. Gut microbiome alterations in Alzheimer's disease. Sci Rep. 2017; 7:13537. https://doi.org/10.1038/s41598-017-13601-y [PubMed]
- 27. Zhuang ZQ, Shen LL, Li WW, Fu X, Zeng F, Gui L, Lü Y, Cai M, Zhu C, Tan YL, Zheng P, Li HY, Zhu J, et al. Gut Microbiota is Altered in Patients with Alzheimer's Disease. J Alzheimers Dis. 2018; 63:1337–46. https://doi.org/10.3233/JAD-180176 [PubMed]
- 28. Nagpal R, Neth BJ, Wang S, Craft S, Yadav H. Modified Mediterranean-ketogenic diet modulates gut microbiome and short-chain fatty acids in association with Alzheimer's disease markers in subjects with mild cognitive impairment. EBioMedicine. 2019; 47:529–42. https://doi.org/10.1016/j.ebiom.2019.08.032 [PubMed]
- 29. Zhou Y, Wang Y, Quan M, Zhao H, Jia J. Gut Microbiota Changes and Their Correlation with Cognitive and Neuropsychiatric Symptoms in Alzheimer's Disease. J Alzheimers Dis. 2021; 81:583–95. https://doi.org/10.3233/JAD-201497 [PubMed]
- 30. Den H, Dong X, Chen M, Zou Z. Efficacy of probiotics on cognition, and biomarkers of inflammation and oxidative stress in adults with Alzheimer's disease or mild cognitive impairment - a meta-analysis of randomized controlled trials. Aging (Albany NY). 2020; 12:4010–39. https://doi.org/10.18632/aging.102810 [PubMed]
- 31. Krüger JF, Hillesheim E, Pereira ACS, Camargo CQ, Rabito EI. Probiotics for dementia: a systematic review and meta-analysis of randomized controlled trials. Nutr Rev. 2021; 79:160–70. https://doi.org/10.1093/nutrit/nuaa037 [PubMed]
- 32. Heshmati J, Farsi F, Yosaee S, Razavi M, Rezaeinejad M, Karimie E, Sepidarkish M. The Effects of Probiotics or Synbiotics Supplementation in Women with Polycystic Ovarian Syndrome: a Systematic Review and Meta-Analysis of Randomized Clinical Trials. Probiotics Antimicrob Proteins. 2019; 11:1236–47. https://doi.org/10.1007/s12602-018-9493-9 [PubMed]
- 33. Huang R, Wang K, Hu J. Effect of Probiotics on Depression: A Systematic Review and Meta-Analysis of Randomized Controlled Trials. Nutrients. 2016; 8:483. https://doi.org/10.3390/nu8080483 [PubMed]
- 34. Page MJ, McKenzie JE, Bossuyt PM, Boutron I, Hoffmann TC, Mulrow CD, Shamseer L, Tetzlaff JM, Akl EA, Brennan SE, Chou R, Glanville J, Grimshaw JM, et al. The PRISMA 2020 statement: An updated guideline for reporting systematic reviews. Int J Surg. 2021; 88:105906. https://doi.org/10.1016/j.ijsu.2021.105906 [PubMed]
- 35. Liu P, Jia XZ, Chen Y, Yu Y, Zhang K, Lin YJ, Wang BH, Peng GP. Gut microbiota interacts with intrinsic brain activity of patients with amnestic mild cognitive impairment. CNS Neurosci Ther. 2021; 27:163–73. https://doi.org/10.1111/cns.13451 [PubMed]
- 36. Kim SY, Park JE, Lee YJ, Seo HJ, Sheen SS, Hahn S, Jang BH, Son HJ. Testing a tool for assessing the risk of bias for nonrandomized studies showed moderate reliability and promising validity. J Clin Epidemiol. 2013; 66:408–14. https://doi.org/10.1016/j.jclinepi.2012.09.016 [PubMed]
- 37. Hozo SP, Djulbegovic B, Hozo I. Estimating the mean and variance from the median, range, and the size of a sample. BMC Med Res Methodol. 2005; 5:13. https://doi.org/10.1186/1471-2288-5-13 [PubMed]
- 38. Noma H, Gosho M, Ishii R, Oba K, Furukawa TA. Outlier detection and influence diagnostics in network meta-analysis. Res Synth Methods. 2020; 11:891–902. https://doi.org/10.1002/jrsm.1455 [PubMed]
- 39. Viechtbauer W, Cheung MW. Outlier and influence diagnostics for meta-analysis. Res Synth Methods. 2010; 1:112–25. https://doi.org/10.1002/jrsm.11 [PubMed]
- 40. Begg CB, Mazumdar M. Operating characteristics of a rank correlation test for publication bias. Biometrics. 1994; 50:1088–101. https://doi.org/10.2307/2533446 [PubMed]
- 41. Egger M, Davey Smith G, Schneider M, Minder C. Bias in meta-analysis detected by a simple, graphical test. BMJ. 1997; 315:629–34. https://doi.org/10.1136/bmj.315.7109.629 [PubMed]
- 42. Ling Z, Zhu M, Yan X, Cheng Y, Shao L, Liu X, Jiang R, Wu S. Structural and Functional Dysbiosis of Fecal Microbiota in Chinese Patients With Alzheimer's Disease. Front Cell Dev Biol. 2021; 8:634069. https://doi.org/10.3389/fcell.2020.634069 [PubMed]
- 43. Xi J, Ding D, Zhu H, Wang R, Su F, Wu W, Xiao Z, Liang X, Zhao Q, Hong Z, Fu H, Xiao Q. Disturbed microbial ecology in Alzheimer's disease: evidence from the gut microbiota and fecal metabolome. BMC Microbiol. 2021; 21:226. https://doi.org/10.1186/s12866-021-02286-z [PubMed]
- 44. Cattaneo A, Cattane N, Galluzzi S, Provasi S, Lopizzo N, Festari C, Ferrari C, Guerra UP, Paghera B, Muscio C, Bianchetti A, Volta GD, Turla M, et al, and INDIA-FBP Group. Association of brain amyloidosis with pro-inflammatory gut bacterial taxa and peripheral inflammation markers in cognitively impaired elderly. Neurobiol Aging. 2017; 49:60–8. https://doi.org/10.1016/j.neurobiolaging.2016.08.019 [PubMed]
- 45. Sheng C, Lin L, Lin H, Wang X, Han Y, Liu SL. Altered Gut Microbiota in Adults with Subjective Cognitive Decline: The SILCODE Study. J Alzheimers Dis. 2021; 82:513–26. https://doi.org/10.3233/JAD-210259 [PubMed]
- 46. Zhang X, Wang Y, Liu W, Wang T, Wang L, Hao L, Ju M, Xiao R. Diet quality, gut microbiota, and microRNAs associated with mild cognitive impairment in middle-aged and elderly Chinese population. Am J Clin Nutr. 2021; 114:429–40. https://doi.org/10.1093/ajcn/nqab078 [PubMed]
- 47. Haran JP, Bhattarai SK, Foley SE, Dutta P, Ward DV, Bucci V, McCormick BA. Alzheimer's Disease Microbiome Is Associated with Dysregulation of the Anti-Inflammatory P-Glycoprotein Pathway. mBio. 2019; 10:e00632–19. https://doi.org/10.1128/mBio.00632-19 [PubMed]
- 48. Petrov VA, Saltykova IV, Zhukova IA, Alifirova VM, Zhukova NG, Dorofeeva YB, Tyakht AV, Kovarsky BA, Alekseev DG, Kostryukova ES, Mironova YS, Izhboldina OP, Nikitina MA, et al. Analysis of Gut Microbiota in Patients with Parkinson's Disease. Bull Exp Biol Med. 2017; 162:734–7. https://doi.org/10.1007/s10517-017-3700-7 [PubMed]
- 49. Zhuang X, Xiong L, Li L, Li M, Chen M. Alterations of gut microbiota in patients with irritable bowel syndrome: A systematic review and meta-analysis. J Gastroenterol Hepatol. 2017; 32:28–38. https://doi.org/10.1111/jgh.13471 [PubMed]
- 50. Zhao Y, Lukiw WJ. Bacteroidetes Neurotoxins and Inflammatory Neurodegeneration. Mol Neurobiol. 2018; 55:9100–7. https://doi.org/10.1007/s12035-018-1015-y [PubMed]
- 51. Hossain S, Beydoun MA, Kuczmarski MF, Tajuddin S, Evans MK, Zonderman AB. The Interplay of Diet Quality and Alzheimer's Disease Genetic Risk Score in Relation to Cognitive Performance Among Urban African Americans. Nutrients. 2019; 11:2181. https://doi.org/10.3390/nu11092181 [PubMed]
- 52. Jeong MY, Jang HM, Kim DH. High-fat diet causes psychiatric disorders in mice by increasing Proteobacteria population. Neurosci Lett. 2019; 698:51–7. https://doi.org/10.1016/j.neulet.2019.01.006 [PubMed]
- 53. Kumar H, Lund R, Laiho A, Lundelin K, Ley RE, Isolauri E, Salminen S. Gut microbiota as an epigenetic regulator: pilot study based on whole-genome methylation analysis. mBio. 2014; 5:e02113–4. https://doi.org/10.1128/mBio.02113-14 [PubMed]
- 54. Welcome MO. Gut Microbiota Disorder, Gut Epithelial and Blood-Brain Barrier Dysfunctions in Etiopathogenesis of Dementia: Molecular Mechanisms and Signaling Pathways. Neuromolecular Med. 2019; 21:205–26. https://doi.org/10.1007/s12017-019-08547-5 [PubMed]
- 55. Allin KH, Tremaroli V, Caesar R, Jensen BAH, Damgaard MTF, Bahl MI, Licht TR, Hansen TH, Nielsen T, Dantoft TM, Linneberg A, Jørgensen T, Vestergaard H, et al, and IMI-DIRECT consortium. Aberrant intestinal microbiota in individuals with prediabetes. Diabetologia. 2018; 61:810–20. https://doi.org/10.1007/s00125-018-4550-1 [PubMed]
- 56. Schwiertz A, Taras D, Schäfer K, Beijer S, Bos NA, Donus C, Hardt PD. Microbiota and SCFA in lean and overweight healthy subjects. Obesity (Silver Spring). 2010; 18:190–5. https://doi.org/10.1038/oby.2009.167 [PubMed]
- 57. Willette AA, Bendlin BB, Starks EJ, Birdsill AC, Johnson SC, Christian BT, Okonkwo OC, La Rue A, Hermann BP, Koscik RL, Jonaitis EM, Sager MA, Asthana S. Association of Insulin Resistance With Cerebral Glucose Uptake in Late Middle-Aged Adults at Risk for Alzheimer Disease. JAMA Neurol. 2015; 72:1013–20. https://doi.org/10.1001/jamaneurol.2015.0613 [PubMed]
- 58. Willette AA, Johnson SC, Birdsill AC, Sager MA, Christian B, Baker LD, Craft S, Oh J, Statz E, Hermann BP, Jonaitis EM, Koscik RL, La Rue A, et al. Insulin resistance predicts brain amyloid deposition in late middle-aged adults. Alzheimers Dement. 2015; 11:504–10.e1. https://doi.org/10.1016/j.jalz.2014.03.011 [PubMed]
- 59. Bhat MI, Kapila R. Dietary metabolites derived from gut microbiota: critical modulators of epigenetic changes in mammals. Nutr Rev. 2017; 75:374–89. https://doi.org/10.1093/nutrit/nux001 [PubMed]
- 60. Fung TC, Olson CA, Hsiao EY. Interactions between the microbiota, immune and nervous systems in health and disease. Nat Neurosci. 2017; 20:145–55. https://doi.org/10.1038/nn.4476 [PubMed]
- 61. Chyan YJ, Poeggeler B, Omar RA, Chain DG, Frangione B, Ghiso J, Pappolla MA. Potent neuroprotective properties against the Alzheimer beta-amyloid by an endogenous melatonin-related indole structure, indole-3-propionic acid. J Biol Chem. 1999; 274:21937–42. https://doi.org/10.1074/jbc.274.31.21937 [PubMed]
- 62. Chang PV, Hao L, Offermanns S, Medzhitov R. The microbial metabolite butyrate regulates intestinal macrophage function via histone deacetylase inhibition. Proc Natl Acad Sci U S A. 2014; 111:2247–52. https://doi.org/10.1073/pnas.1322269111 [PubMed]
- 63. Wong JM, de Souza R, Kendall CW, Emam A, Jenkins DJ. Colonic health: fermentation and short chain fatty acids. J Clin Gastroenterol. 2006; 40:235–43. https://doi.org/10.1097/00004836-200603000-00015 [PubMed]
- 64. Silva YP, Bernardi A, Frozza RL. The Role of Short-Chain Fatty Acids From Gut Microbiota in Gut-Brain Communication. Front Endocrinol (Lausanne). 2020; 11:25. https://doi.org/10.3389/fendo.2020.00025 [PubMed]
- 65. Barrett E, Ross RP, O'Toole PW, Fitzgerald GF, Stanton C. γ-Aminobutyric acid production by culturable bacteria from the human intestine. J Appl Microbiol. 2012; 113:411–7. https://doi.org/10.1111/j.1365-2672.2012.05344.x [PubMed]
- 66. Koh A, De Vadder F, Kovatcheva-Datchary P, Bäckhed F. From Dietary Fiber to Host Physiology: Short-Chain Fatty Acids as Key Bacterial Metabolites. Cell. 2016; 165:1332–45. https://doi.org/10.1016/j.cell.2016.05.041 [PubMed]
- 67. Underwood MA, German JB, Lebrilla CB, Mills DA. Bifidobacterium longum subspecies infantis: champion colonizer of the infant gut. Pediatr Res. 2015; 77:229–35. https://doi.org/10.1038/pr.2014.156 [PubMed]
- 68. Mancuso C, Santangelo R. Alzheimer's disease and gut microbiota modifications: The long way between preclinical studies and clinical evidence. Pharmacol Res. 2018; 129:329–36. https://doi.org/10.1016/j.phrs.2017.12.009 [PubMed]
- 69. Bonfili L, Cecarini V, Berardi S, Scarpona S, Suchodolski JS, Nasuti C, Fiorini D, Boarelli MC, Rossi G, Eleuteri AM. Microbiota modulation counteracts Alzheimer's disease progression influencing neuronal proteolysis and gut hormones plasma levels. Sci Rep. 2017; 7:2426. https://doi.org/10.1038/s41598-017-02587-2 [PubMed]
- 70. Hsiao EY, McBride SW, Hsien S, Sharon G, Hyde ER, McCue T, Codelli JA, Chow J, Reisman SE, Petrosino JF, Patterson PH, Mazmanian SK. Microbiota modulate behavioral and physiological abnormalities associated with neurodevelopmental disorders. Cell. 2013; 155:1451–63. https://doi.org/10.1016/j.cell.2013.11.024 [PubMed]
- 71. Rhee KJ, Wu S, Wu X, Huso DL, Karim B, Franco AA, Rabizadeh S, Golub JE, Mathews LE, Shin J, Sartor RB, Golenbock D, Hamad AR, et al. Induction of persistent colitis by a human commensal, enterotoxigenic Bacteroides fragilis, in wild-type C57BL/6 mice. Infect Immun. 2009; 77:1708–18. https://doi.org/10.1128/IAI.00814-08 [PubMed]
- 72. Wu S, Rhee KJ, Albesiano E, Rabizadeh S, Wu X, Yen HR, Huso DL, Brancati FL, Wick E, McAllister F, Housseau F, Pardoll DM, Sears CL. A human colonic commensal promotes colon tumorigenesis via activation of T helper type 17 T cell responses. Nat Med. 2009; 15:1016–22. https://doi.org/10.1038/nm.2015 [PubMed]