Restoration of WT-TP53 activity results in decreased resistance to various drugs, inhibitors, and natural products
MIA-PaCa-2 cells have GOF mutant TP53 alleles (R248W). A cDNA encoding WT-TP53 cDNA was inserted into the pLXSN vector [42]. MIA-PaCa-2 cells were transduced with the WT-TP53 vector and named MIA-PaCa-2 + WT-TP53 cells. As a negative control, the effects of the empty parental pLXSN plasmid [43] on MIA-PaCa-2 cells and named MIA-PaCa-2 + pLXSN.
Table 1 is a list of the various agents examined in this study as well as their targets and intersections with the TP53 pathway and a brief description of their mechanisms of action.
Table 1. Chemotherapeutic drugs, signal transduction inhibitors, natural products used in this study and their targets, mode of action, and intersections with the TP53 pathway.1,2
| Chemotherapeutic drugs1 |
| Drug↓ | Target1 | Mode of action | Intersection with TP53 pathway |
| Docetaxel | Microtubule Binder | Blocks mitosis by inhibiting mitotic spindle assembly. | Docetaxel intersects with TP53 pathway. WT-TP53 increases sensitivity, increases phosphorylation of S15-TP53. |
| 5-Fluorouracil (5FU) | Nucleoside Analogue | Blocks the activity of thymidylate synthase, thus, inhibits DNA synthesis/replication. | 5FU intersects with TP53 pathway. WT-TP53 increases sensitivity to FU. 5FU induces TP53 stabilization by blocking MDM2. |
| Gemcitabine (Gem) | Nucleoside Analogue | Gemcitabine exerts it antitumor effects by promoting apoptosis of cells undergoing DNA synthesis. | Gem intersects with TP53 pathway. WT-TP53 increases sensitivity. Gem can induce TP53 targets such as PUMA and Bax which leads to apoptosis. |
| Aclacinomycin (Aclarubicin) | DNA intercalator, Topoisomerase II | Topoisomerase inhibitor (inh.) thus, inhibits DNA replication. | As an anthracycline it probably insects with TP53 pathway. However, like most chemotherapeutic drugs, it can function in TP53 mutant cells. |
| Daunorubicin | DNA intercalators, Topoisomerase II | Topoisomerase inh. thus, inhibits DNA replication. | Daunorubicin intersects with TP53 pathway. It induces TP53 and downstream p21Cip1. |
| Doxorubicin (Dox) | DNA intercalator, Topoisomerase II | Topoisomerase inh. thus, inhibits DNA replication and induces many TP53-regulated genes, many induce apoptosis. | Dox intersects with TP53 pathway. It increases TP53 expression and phosphorylation at S15 and can induce p21Cip-1. |
| Etoposide | Binds to Topoisomerase II | Topoisomerase inh. thus, inhibits DNA replication and induces apoptosis. Complex form between etoposide and DNA and can prevent DNA repair. | Etoposide intersects with TP53 pathway. It increases TP53 and pro-apoptotic PUMA expression as well as Bax processing. |
| Cisplatin (Cis) | DNA | Crosslinks DNA to form DNA adducts. Preventing repair of DNA leading to DNA damage and subsequently apoptosis. | Cis intersects with TP53 pathway. Cis can enhance TP53, p21Cip-1, MDM2 and Fas expression. |
| Signal transduction inhibitors1 |
| Drug↓ | Target | Mode of action | Intersection with TP53 pathway |
| ARS-1620 | Mutant KRas | KRas-mediated catalysis of the chemical reaction with Cys12 in KRASG12C. | KRas interacts with the TP53 pathway. TP53 and KRas interact to modulate CREB1 expression to promote metastasis and tumor growth. |
| PD0325901 | MEK1 | A highly selective allosteric inh. that does not compete with either ATP or ERK1/2. | MEK1 interacts with the TP53 pathway. Downstream ERK can phosphorylate and activate TP53, resulting in many cellular responses. |
| LY294002 | PI3K and others | Competition with ATP for binding the PI3K active site. | PI3K and downstream molecules can interact with the TP53 pathway. Downstream of PI3K are PTEN and Akt and they can regulate the TP53 pathway at various steps and processes. |
| Pifithrin-μ | TP53 | Inhibits some of TP53 activities by binding to BCLXL and BCL2 at the mitochondria without affecting TP53 transcriptional activities. | Pifithrin-μ inhibits some proteins regulated by the TP53 pathway (BCL-XL and BCL2). |
| 6-bromoindirubin-30-oxime (BIO) | GSK-3 | BIO is a selective, reversible potent GSK-3 inh. It is an ATP-competitive inhibitor of GSK-3α/β. It interacts with ATP binding site of GSK-3. | GSK-3 interacts with TP53 pathway. GSK-3 phosphorylates sites on the proteasomal inhibitor MDM2. This phosphorylation is required for TP53 degradation. Inhibition of GSK-3 leads to an increase in TP53 levels. |
| SB415286 | GSK-3 | Targets ATP-binding site. It inhibits both GSK-3α and GSK-β. | GSK-3 interacts with TP53 pathway. GSK-3 phosphorylates sites on the proteasomal inhibitor MDM2. This phosphorylation is required for TP53 degradation. Inhibition of GSK-3 leads to an increase in TP53 levels. |
| CHIR99021 | GSK-3 | Targets ATP-binding site. It inhibits both GSK-3α and GSK-β. | GSK-3 interacts with TP53 pathway. GSK-3 phosphorylates sites on the proteasomal inhibitor MDM2. This phosphorylation is required for TP53 degradation. Inhibition of GSK-3 leads to an increase in TP53 levels. |
| Rapamycin | mTORC1 | Binds and blocks mTORC1 complex. | mTORC1 interacts with the TP53 pathway. Activation of TP53 downregulates mTOR signaling. This occurs through AMPK. |
| AG1498 | EGFR | AG1478 competitively binds to the ATP binding pocket in EGFR. | EGFR interacts with the TP53 pathway.TP53 mutations are associated with primary or acquired resistance to EGFR-tyrosine kinase inhibitors. |
| Gilteritinib | AXL/ALK/FLT3 | Gilteritinib binds to the ATP binding site in the active pocket of the AXL/ALK/FLT3 kinases. | AXL/ALK/FLT3 interacts with the TP53 pathway. AXL suppresses TP53 expression by binding to DNA sequences upstream from the TP53 gene. AXL is also regulated by miR-34a which is regulated by TP53. ALK inhibitors are not as effective in lung cancer patients that have rearranged ALK genes and are also mutated at TP53 as in patients with germline genes. Also, FLT-3 and TP53 also interact. |
| Sorafenib | Multiple kinases (e.g., Raf, PDGFR, VEGFR, FLT-3 and others) | Sorafenib binds to the ATP binding site. | Many of these kinases and their downstream substrates interact with TP53 pathway by phosphorylating TP53 and other molecules regulated by TP53. Mutant TP53 can also regulate the expression of some of these kinases such as PDGFR. |
| OTX008 | Galectin-1 | OTX008 binds galectin-1 which leads to galectin-1 oxidation and proteasomal degradation. | Galectin-1 can interact with the TP53 pathway. TP53 can induce the expression of miRs which regulate galectin-1 expression. |
| Tiplaxtinin | Serpine-1 | Tiplaxtinin binds to the active conformation of serpine-1 and induced reversible inactivation serpine-1. | TP53 regulates the expression of miR-34a which can down regulate serpine-1. Serpine1- is involvement of metastasis in various cancers. |
| Verapamil (Ver) | Calcium channel | Also, some transporters associated with chemotherapeutic drug resistance. Binds to sites on MDR1 glycoprotein preventing drug efflux. Also, downregulates MDR1 expression. | TP53 pathway and Ver interact. Ver interacts with the TP53 activator (MDM2 inhibitor) nutlin-3a which results in suppression of cell growth. |
| Vismodegib (Vis) | Hh pathway | Smoothened homologue (SMO) binds to Smoothened (SMO) and inhibits its activity. | Multiple interactions with TP53 pathway. |
| Natural products2 |
| Cyclopamine | Sonic hedgehog (SHH) pathway | Cyclopamine binds to SMO and inhibits its activity. | Multiple interactions with TP53 pathway. |
| Parthenolide2 | NF-κB (other targets) | Inhibition of activation of IκB, and direct binding to NF-κB, preventing its interaction with DNA. | NF-κB interacts with the TP53 pathway TP53 and NF-κB inhibit each other’s ability to stimulate gene expression. |
| Isoliquiritin2 | Induces apoptotic cell death through upregulating TP53 and p21Cip-1. Suppresses NF-κB, ERK and activation of other targets | Suppresses invasiveness and angiogenesis of cancer. | Isoliquiritin interacts with TP53 pathway. It induces TP53 and inhibits NF-κB and ERK. Both interact with TP53 pathway. |
| Genistein (isoflavone)2 | Multiple targets | Genistein triggers the ER stress to induce apoptosis and other mechanisms of cell death. | Genistein interacts with TP53 pathway. Genistein increases the phosphorylation and activation of ATM/ATR-TP53-p21Cip-1 pathway. |
| Daidzein (isoflavone)2 | Multiple targets | Daidzein and genistein induce cell cycle arrest in the G2/M phase. This is accompanied by activation of ATM/TP53, and p21Cip-1 and other cell cycle regulatory genes. | Daidzein interacts with TP53 pathway. Daidzein increases the phosphorylation and activation of ATM/ATR-TP53-p21Cip-1 pathway. |
| 1Many chemotherapeutic drugs and signal transduction inhibitors have other effects and targets. We describe the targets that are most closely related to TP53. |
| 2Most natural products have multiple targets. We describe some of the targets that are more closely related to TP53. |
Docetaxel is a common chemotherapeutic drug used to treat various cancer types including PDAC. The IC50 for docetaxel in MIA-PaCa-2 + WT-TP53 cells was 3.8-fold lower than in MIA-PaCa-2 + pLXSN cells (Figure 2A). The effects of WT-TP53 on the sensitivity to three topoisomerase inhibitors used in cancer therapy were also examined (Figure 2B–2D). The IC50s for all the inhibitors were lower (~ 2-fold for etoposide and daunorubicin, and 5-fold for aclacinomycin) in MIA-PaCa-2 + WT-TP53 cells than in MIA-PaCa-2 + pLXSN cells.
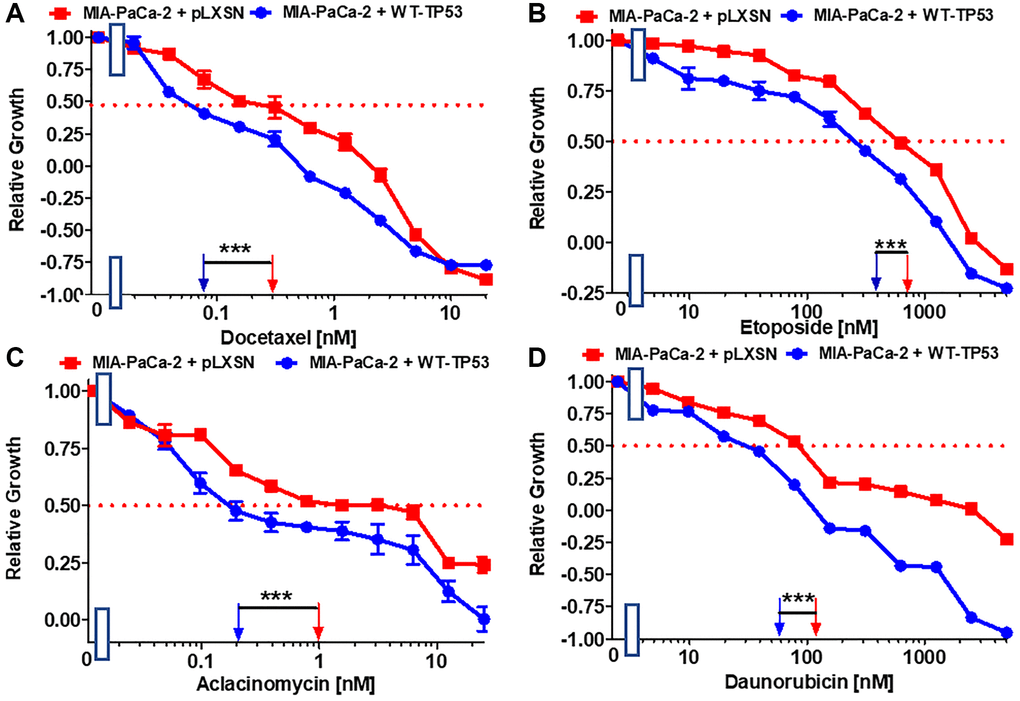
Figure 2. Effects of signal transduction inhibitors on the growth of MIA-PaCa-2 + WT-TP53 and MIA-PaCa-2 + pLXSN cells. The effects of docetaxel (A), etoposide (B) aclacinomycin (C) and daunorubicin (D) on MIA-PaCa-2 + pLXSN cells (solid red squares) and MIA-PaCa-2 + WT-TP53 cells (solid blue circles) were examined by MTT analysis. These experiments were repeated and similar results were obtained. Statistical analyses were performed by the Student T test on the means and standard deviations of various treatment groups. ***P < 0.0001.
Restoration of WT-TP53 activity in MIA-PaCa-2 cells resulted in increased sensitivity to chemotherapeutic drugs used to treat cancer patients. Table 2 summarizes the effects of addition of WT-TP53 into Mia-PaCa-2 cells. Restoration of WT-TP53 activity increased sensitivity to the KRAS inhibitor ARS-1620 [44] 125-fold (Figure 3A).
Table 2. Effects of WT-TP53 and pLXSN on sensitivity of MIA-PaCa-2 pancreatic cancer cells on chemotherapeutic drugs, signal transduction inhibitors and natural products as determined by IC50 analysis.1
| Drug/Agent↓ | + pLXSN | + WT-TP53 | Fold change WT vs. LXSN |
| Docetaxel (microtubule binder) | 0.3 nM | 0.08 nM | 3.8 X↓ |
| Etoposide (topoisomerase inh.) | 750 nM | 400 nM | 1.9 X↓ |
| Aclacinomycin (topoisomerase inh.) | 1 nM | 0.2 nM | 5 X↓ |
| Daunorubicin (topoisomerase inh.) | 120 nM | 60 nM | 2 X ↓ |
| ARS-1620 (mutant KRas inh.) | 10 nM | 0.8 nM | 12.5 X↓ |
| PD0325901 (MEK1 inh.) | 150 nM | 45 nM | 3.3 X↓ |
| LY294002 (PI3K inh.) | 5,000 nM | 150 nM | 33.3 X↓ |
| Pifithrin-μ (TP53 inh.) | 600 nM | 2.5 nM | 240 X↓ |
| BIO (GSK-3 inh.) | 210 nM | 100 nM | 2.1 X↓ |
| SB415286 (GSK-3 inh.) | 40 nM | 3 nM | 13.3 X↓ |
| CHIR99021 (GSK-3 inh.) | 500 nM | 300 nM | 1.7 X↓ |
| Rapamycin (mTORC1 blocker) | 2 nM | 0.3 nM | 6.7 X↓ |
| AG1498 (EGFR inh.) | 1,000 nM | 200 nM | 5 X↓ |
| Gilteritinib (AXL/ALK/FLT3 inh.) | 600 nM | 220 nM | 2.7 X↓ |
| Sorafenib (multi-kinase inh.) | 1,000 nM | 700 nM | 1.4 X↓ |
| OTX008 (Galectin-1 inh.) | 1,000 nM | 10 nM | 100 X↓ |
| Tiplaxtinin (Serpine-1 inh.) | 40 nM | 10 nM | 4 X↓ |
| Cyclopamine (SHH inh.) | 1,000 nM | 500 nM | 2 X↓ |
| Parthenolide (NF-κB inh, other targets) | 40 nM | 3.5 nM | 11.4 X↓ |
| Isoliquiritin (multiple targets) | 1,900 nM | 600 nM | 3.2 X↓ |
| Genistein (isoflavone, many targets) | 300 nM | 70 nM | 4.3 X↓ |
| Daidzein (isoflavone, many targets) | 1,000 nM | 600 nM | 1.7 X↓ |
| 1Determined by MTT analysis as previously described [40, 41]. |
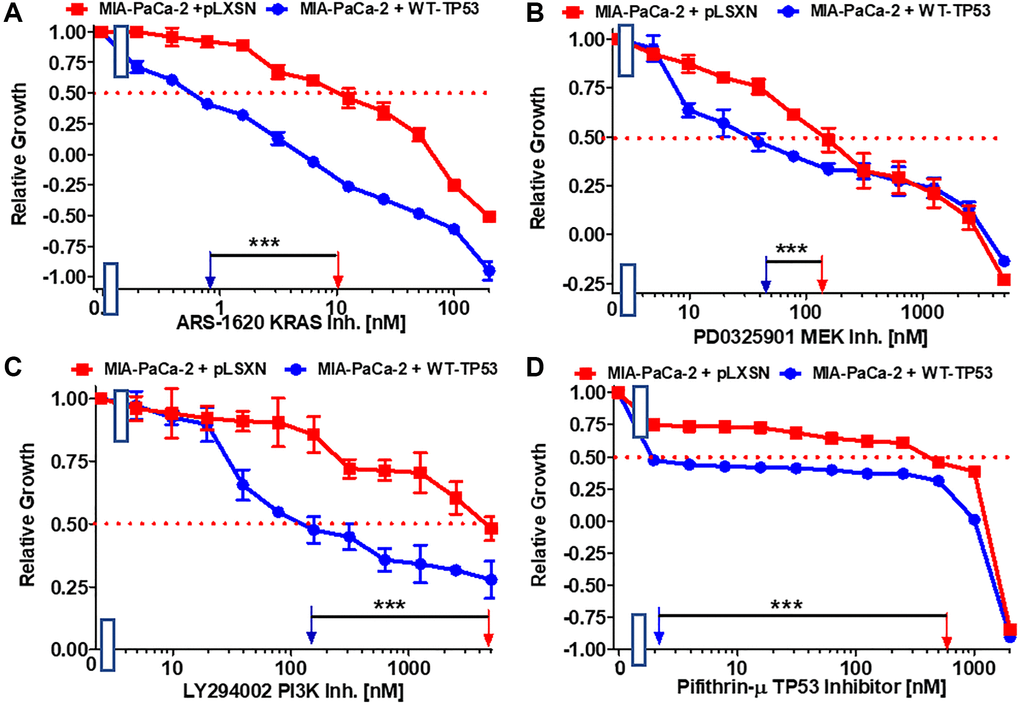
Figure 3. Effects of the Ras/MEK, PI3K/mTOR and TP53 inhibitors on the growth of MIA-PaCa-2 + WT-TP53 and MIA-PaCa-2 + pLXSN cells. The effects of the ARS-1620 mutant KRas inhibitor (A), the PD0325901 MEK1 inhibitor (B), the LY294002 PI3K inhibitor (C) and the TP53 inhibitor pifithrin-μ (D) on MIA-PaCa-2 + pLXSN cells (solid red squared) and MIA-PaCa-2 + WT-TP53 cells (solid blue circles) were examined by MTT analysis. The MIA-PaCa-2 + WT-TP53, and MIA-PaCa-2 + pLXSN cells in each panel were all examined at the same time period. These experiments were repeated and similar results were obtained. Statistical analyses were performed by the Student T test on the means and standard deviations of various treatment groups. ***P < 0.0001.
Various signaling cascades are located downstream of KRas. Two important kinase cascades are the Raf/MEK/ERK and PI3K/PTEN/Akt/mTORC1 pathways. They are often involved in regulation of cell growth and their aberrant regulation is often implicated in cancer [45–47]. Restoration of WT-TP53 activity in MIA-PaCa-2 cells increased the sensitivity to the MEK1 inhibitor PD0325901 3.3-fold. (Figure 3B).
Restoration of WT-TP53 activity in MIA-PaCa-2 cells led to a 33.3-fold lower IC50 for the PI3K inhibitor LY294002 inhibitor than that observed in MIA-PaCa-2 cells lacking WT-TP53 (Figure 3C). Thus, addition of WT-TP53 activity in MIA-PaCa-2 cells increased their sensitivity to small molecule inhibitors which target the Ras/Raf/MEK/ERK and PI3K/PTEN/Akt/mTORC1 pathways.
Pifithrin-μ is a small molecule that inhibits the interactions of TP53 with either BCL2 or BCLXL at the mitochondrial membrane. This results in the induction of apoptosis. However, Pifithrin-μ does not inhibit the effects that TP53 has on transcription [48]. Restoration of WT-TP53 in MIA-PaCa-2 cells resulted in a pifithrin-μ IC50 240-fold lower than that detected in MIA-PaCa-2 cells which lack WT-TP53 activity (Figure 3D).
GSK-3 is a multifunctional kinase that is involved in the regulation of many processes both in normal physiological and malignant growth [49]. GSK-3 has been shown to be important for the interactions between KRas and NF-κB [50, 51]. GSK-3 is an important target in many cancers. GSK-3 inhibitors have been suggested for the treatment of PDAC [52]. The effects of GSK-3 inhibitors BIO, CHIR99021 and SB415286 on MIA-PaCa-2 cells containing and lacking WT activity were examined. Restoration of WT-TP53 activity in MIA-PaCa-2 cells resulted in over 13-fold lower IC50 for SB415286 and only about 2-fold lower IC50 for BIO and CHIR99021 than in cells lacking WT-TP53 activity (Figure 4A–4C).
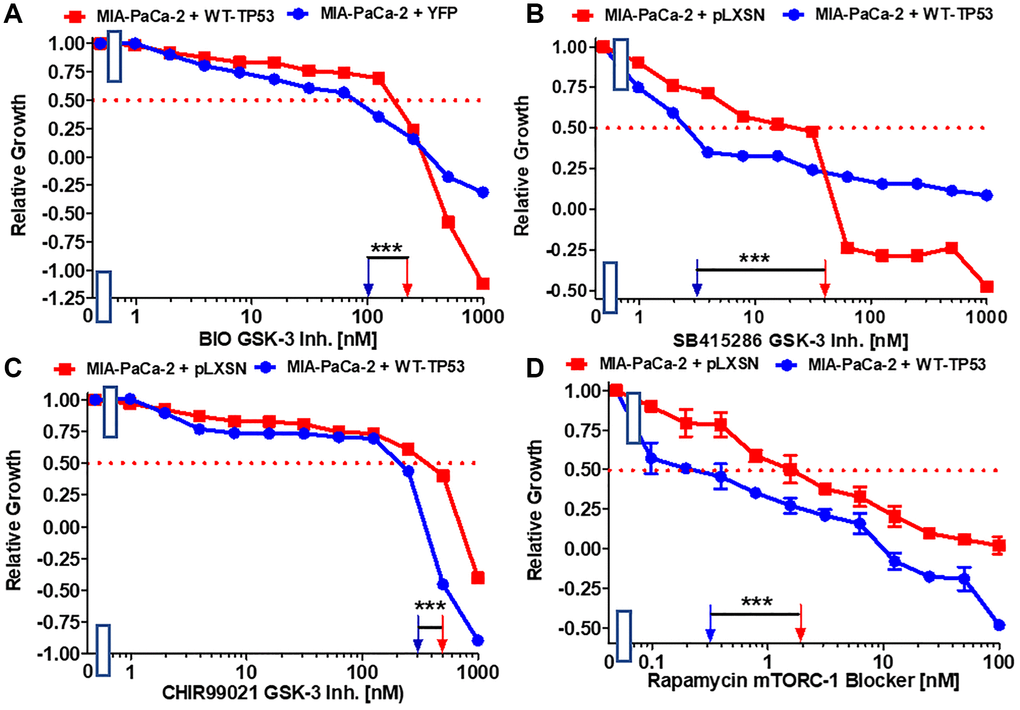
Figure 4. Effects of GSK-3 inhibitors and the mTORC1 blocker rapamycin on the growth of MIA-PaCa-2 + WT-TP53 and MIA-PaCa-2 + pLXSN cells. The effects of the BIO GSK-3 inhibitor (A), the SB415286 GSK-3 inhibitor (B), the CHIR99021 GSK-3 inhibitor (C) and the mTORC1 blocker rapamycin (D) on MIA-PaCa-2 + pLXSN cells (solid red squared) and MIA-PaCa-2 + WT-TP53 cells (solid blue circles) were examined by MTT analysis. The MIA-PaCa-2 + WT-TP53, and MIA-PaCa-2 + pLXSN cells in each panel were all examined at the same time period. These experiments were repeated and similar results were obtained. Statistical analyses were performed by the T test on the means and standard deviations of various treatment groups. ***P < 0.0001.
The mTORC1 complex plays critical roles in many processes, including: cell growth, metabolism, cancer and aging [53, 54]. Restoration of WT-TP53 activity in MIA-PaCa-2 cells resulted in a rapamycin IC50 6.7-fold lower than that observed in cells lacking WT-TP53 activity (Figure 4D).
EGFR, HER2, ALK, AXL, FLT3, PDGFR and other receptors and signal transducers (e.g., Raf) are involved in the metastasis of various cancers [55–61]. The effects of: the AG1478 EGFR inhibitor, the multi-kinase ALK, AXL, FLT3 inhibitor gilteritinib and multi-kinase Raf, PDGFR, FLT3, VEGFR inhibitor sorafenib on the growth of MIA-PaCa-2 cells expressing WT-TP53 or not were ascertained. Introduction of WT-TP53 into MIA-PaCa-2 cells resulted in reduction of the IC50s for all the inhibitors in comparison to the IC50s in MIA-PaCa-2 cells lacking WT-TP53 expression (Figure 5A–5C) but the reduction was most pronounced for the AG1478 EGFR inhibitor.
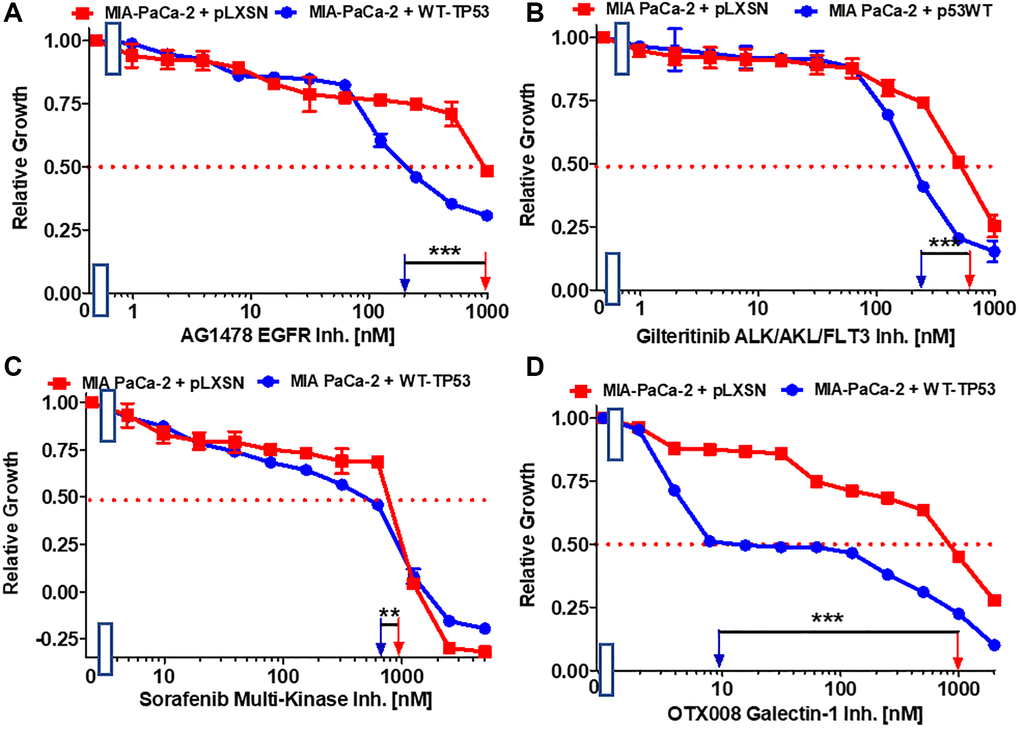
Figure 5. Effects of inhibitors which may suppress metastasis on the growth of MIA-PaCa-2 + WT-TP53 and MIA-PaCa-2 + pLXSN cells. The effects of the AG1478 EGFR inhibitor (A), the gilteritinib ALK/AXL/FLT3 inhibitor (B), the sorafenib multi-kinase inhibitor (C) and the galectin-1 inhibitor OTX008 (D) on MIA-PaCa-2 + pLXSN cells (solid red squares) and MIA-PaCa-2 + WT-TP53 cells (solid blue circles) were examined by MTT analysis. The MIA-PaCa-2 + WT-TP53, and MIA-PaCa-2 + pLXSN cells in each panel were all examined at the same time period. These experiments were repeated and similar results were obtained. Statistical analyses were performed by the T test on the means and standard deviations of various treatment groups. ***P < 0.0001, and **P < 0.005.
Galectin-1 is involved in hedgehog (Hh) signaling, stromal remodeling and metastasis of PDAC [62]. Galectin-1 is negatively regulated by WT TP53 [63]. OTX008 inhibits the activity of galectin-1. Restoration of WT-TP53 activity in MIA-PaCa-2 cells sensitized the cells 100-fold in comparison to MIA-PaCa-2 cells which lacked WT-TP53 activity (Figure 5D).
The plasminogen activator inhibitor (PAI-1), serpine1 is negatively regulated by miR-34a in MIA-PaCa-2 upon restoration of WT-TP53 activity [64]. The small molecule tiplaxtinin inhibits serpine1 activity [65]. Upon restoration of WT-TP53 activity in MIA-PaCa-2 cells resulted in 4-fold enhanced sensitivity to tiplaxtinin in comparison to MIA-PaCa-2 cells lacking WT-TP53 activity (Figure 6A).
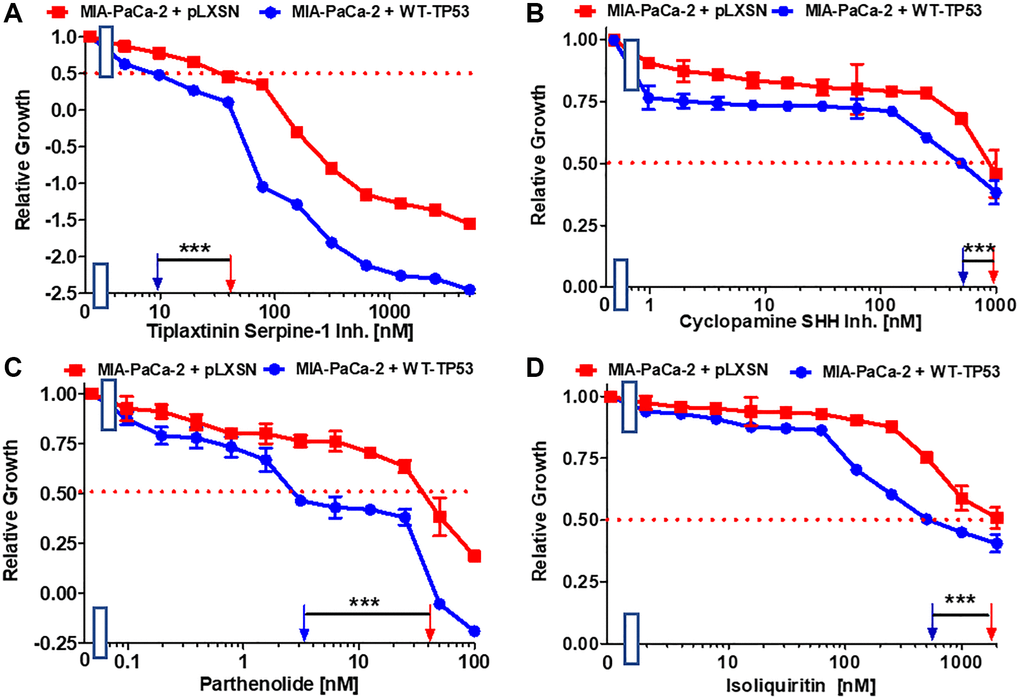
Figure 6. Effects of inhibitors/natural products which may suppress metastasis on the growth of MIA-PaCa-2 + WT-TP53 and MIA-PaCa-2 + pLXSN cells. The effects of the tiplaxtinin Serpine-1 inhibitor (A), the natural product cyclopamine, a SHH inhibitor (B), the natural product parthenolide, a NF-κB inhibitor (C), and the natural product/nutraceutical isoliquiritin (D) were examined by MTT analysis. The MIA-PaCa-2 + WT-TP53, and MIA-PaCa-2 + pLXSN cells in each panel were all examined at the same time period. These experiments were repeated and similar results were obtained. Statistical analyses were performed by the T test on the means and standard deviations of various treatment groups. ***P < 0.0001.
Effects of WT-TP53 on sensitivity to natural products and nutraceuticals
The ability of various natural products and nutraceuticals to inhibit the proliferation in MIA-PaCa-2 cells in the presence and absence of WT-TP53 activity was determined. These compounds were selected on the basis of literature data suggesting their targets and their influence on the development of PDAC.
A natural product that inhibits the Hh signaling pathway is cyclopamine. The Hh pathway is very important in PDAC and metastasis [66, 67]. Restoration of WT-TP53 activity in MIA-PaCa-2 cells increased the sensitivity 2-fold to cyclopamine (Figure 6B).
Extracts from the plant fever few contain parthenolide. One of its targets is NF-κB [68]. Parthenolide has been observed to suppress PDAC progression [69]. Restoration of WT-TP53 activity in MIA-PaCa-2 cells increased the sensitivity to parthenolide 11.4-fold in comparison to cells lacking WT-TP53 activity (Figure 6C).
Licorice contains the flavonoid isoliquiritin which has various biological activities including anti-cancer activities [70, 71]. In lung cancer cells, it was shown that isoliquiritin can induce TP53 activity [71]. In pancreatic cancer cells it suppressed the invasiveness in vitro [72]. Restoration of WT-TP53 activity in MIA-PaCa-2 cells increased their sensitivity to isoliquiritin 3.2-fold (Figure 6D).
Genistein is an isoflavone. It possesses certain anti-cancer properties including inhibition of angiogenesis in PDAC [73]. It induces apoptosis in PDAC lines [74]. Restoration of WT-TP53 activity in MIA-PaCa-2 cells increased their sensitivity to genistein 4.3-fold in comparison to MIA-PaCa-2 cells lacking WT-TP53 (Figure 7A).
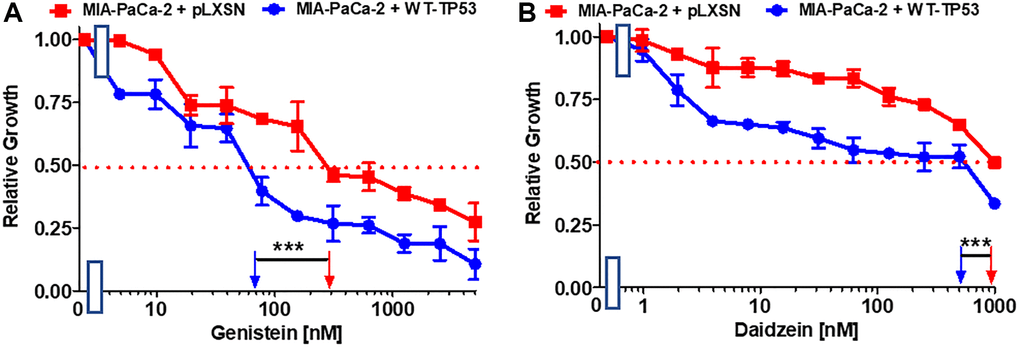
Figure 7. Effects of nutraceuticals on the growth of MIA-PaCa-2 + WT-TP53 and MIA-PaCa-2 + pLXSN cells. The effects of genistein (A), and daidzein (B), on MIA-PaCa-2 + pLXSN cells (solid red squared) and MIA-PaCa-2 + WT-TP53 cells (solid blue circles) were examined by MTT analysis. The MIA-PaCa-2 + WT-TP53, and MIA-PaCa-2 + pLXSN cells in each panel were all examined at the same time period. These experiments were repeated and similar results were obtained. Statistical analyses were performed by the T test on the means and standard deviations of various treatment groups. ***P < 0.0001.
Daidzein is an additional isoflavone. It inhibited breast cancer growth in rodent models [75, 76]. Restoration of WT-TP53 activity in MIA-PaCa-2 cells increased the sensitivity to daidzein 1.7-fold (Figure 7B).
Summarizing, restoration of WT-TP53 activity in MIA-PaCa-2 cells increased the sensitivity to various chemotherapeutic drugs, signal transduction inhibitors and natural products.
Effects of WT-TP53 on the ability of cells to form colonies in medium containing soft agar
The ability of cells to form colonies in medium containing soft agar in the absence of adhesion to the bottom of the tissue culture plate (anchorage-independent growth) is often considered as a measure of the extent of transformation of malignant transformation as most “normal” cells do not [77].
The effects of restoration of WT-TP53 activity on the ability to form colonies in increasing concentrations of 5FU were compared. As documented in Figure 9, restoration of WT-TP53 activity in MIA-PaCa-2 cells inhibited their ability to form colonies in soft agar in the presence of 5FU.
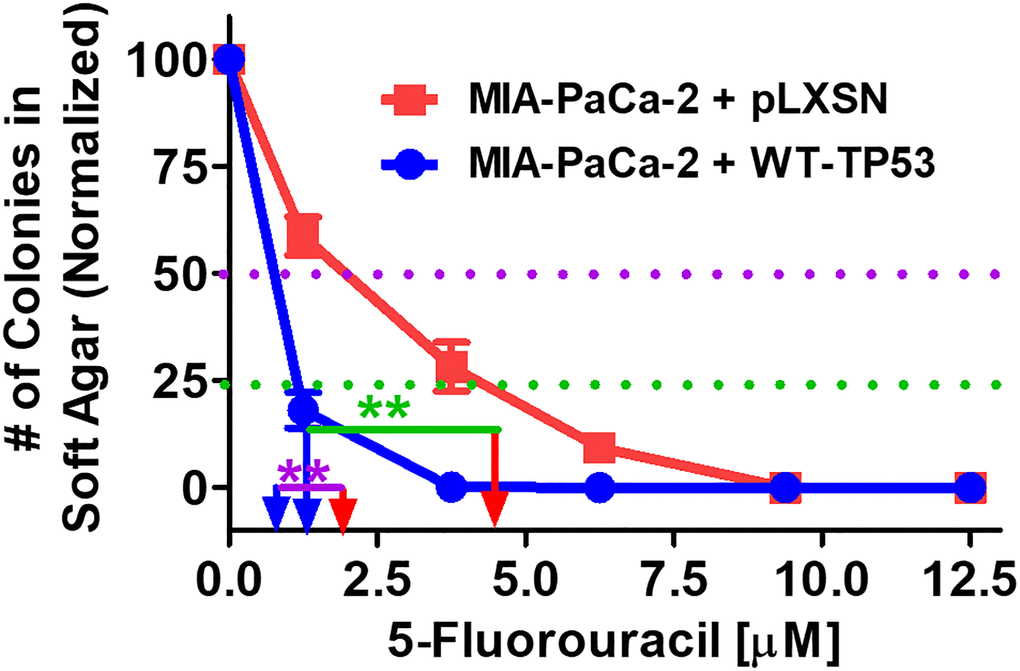
Figure 9. Effects of pLXSN and WT-TP53 on the colony formation in soft agar in the presence of 5-Fluorouracil. The effects of pLXSN and WT-TP53 on the colony formation in soft agar were examined. Red squares = MIA-PaCa-2 + pLXSN cells, blue circles = MIA-PaCa-2 + WT-TP53 cells. IC50 is indicated with a purple dotted line and IC25 is indicated with a green dotted line. IC25 is a term to indicate inhibition of colony formation at 25%. These experiments were repeated performed and similar results were observed. The colonies for each cell line were normalized to untreated cells so that the results from the MIA-PaCa-2 + pLXSN and MIA-PaCa-2 + WT-TP53 could be compared. **P < 0.005.
Figure 10 presents photographs of colonies stained with crystal violet, not only were there less colonies in soft agar when WT-TP53 activity was restored to MIA-PaCa-2 cells but the colony sizes were also smaller. When there was no 5FU in the culture medium, MIA-PaCa-2 cells containing or lacking WT-TP53 formed similar numbers of colonies of roughly equal sizes. However, even at the lowest dose of 5FU (1.25 μM), there was a massive drop in the number of colonies observed in MIA-PaCa-2 cells containing WT-TP3 activity while the decline in MIA-PaCa-2 cells lacking WT-TP53 activity, was not as extreme.
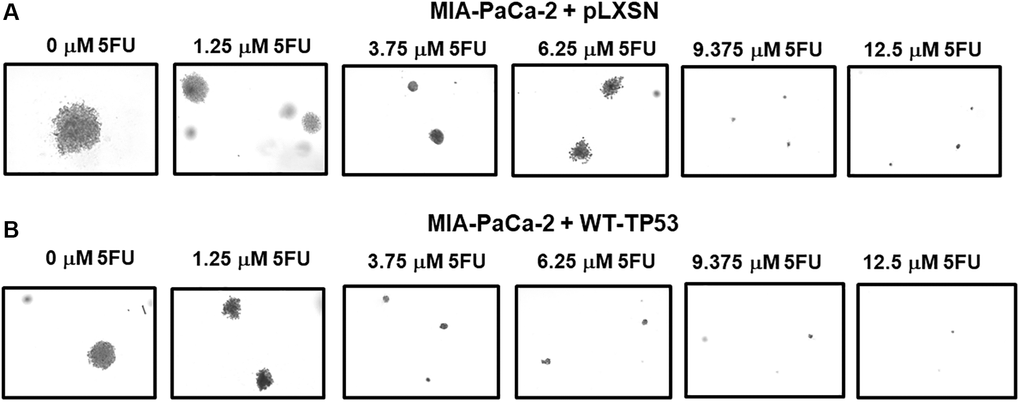
Figure 10. Crystal violet-stained colonies in soft agar in the presence of 5-Fluorouracil. The effects of pLXSN and WT-TP53 on the colony formation in soft agar were photographed after staining. Photographs were taken at the same day and at the same magnification on the microscope. (A) MIA-PaCa-2 + pLXSN cells treated with increasing concentration of 5FU, (B) MIA-PaCa-2 + WT-TP53 cells treated with increasing concentrations of 5FU.
Restoration of WT-TP53 activity in both MIA-PaCa-2 and PANC-28 cells decreased their ability to form colonies in soft agar containing docetaxel (Figure 11). Introduction of WT-TP53 activity decreased the ability of MIA-PaCa-2 cells to form colonies in soft agar containing doxorubicin (Figure 12A).
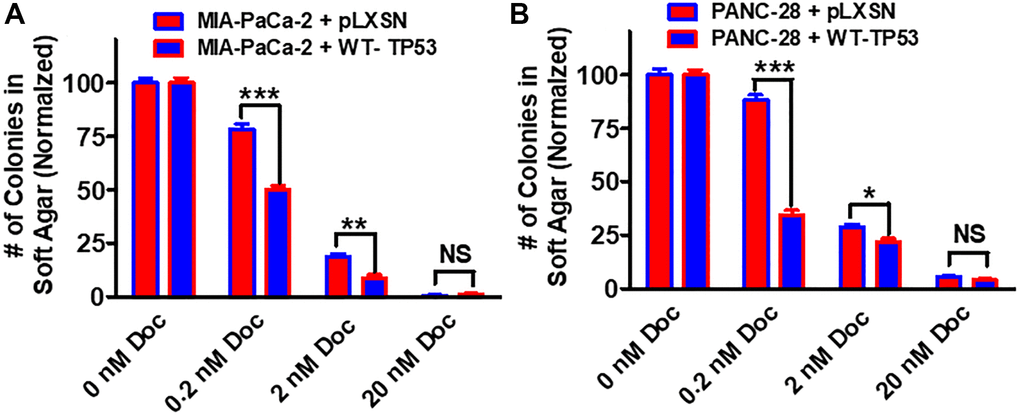
Figure 11. Effects of pLXSN and WT-TP53 on the colony formation in soft agar in the presence of docetaxel. The effects of pLXSN and WT-TP53 on the colony formation in soft agar in MIA-PaCa-2 and PANC-28 cells were examined. (A) MIA-PaCa-2 + pLXSN (red bars) and MIA-PaCa-2 + WT-TP53 (blue bars) were compared in response to docetaxel. (B) PANC-28 + pLXSN (red bars) and PANC-28 + WT-TP53 (blue bars) were compared in response to docetaxel. The colonies for each cell line were normalized to untreated so that the results from pLXSN and WT-TP53 could be compared. These studies were repeated and similar results were observed. ***P < 0.0001, **P < 0.005 and *P < 0.05, NS = not statistically significant.
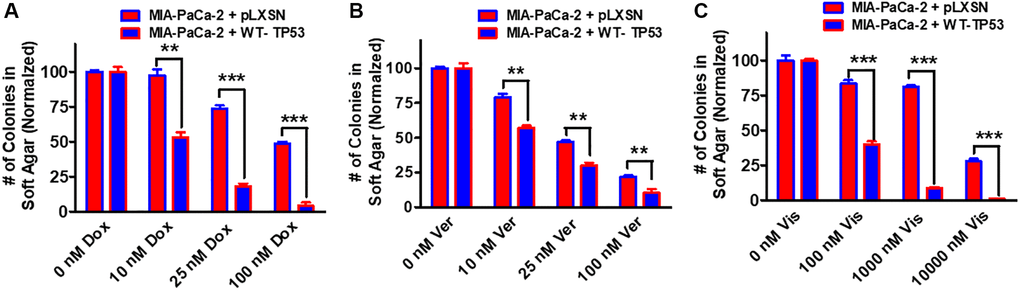
Figure 12. Effects of pLXSN and WT-TP53 on the colony formation in soft agar in the presence of doxorubicin, verapamil and vismodegib. The effects of pLXSN and WT-TP53 on the colony formation in soft agar in MIA-PaCa-2 in response to drugs was examined. (A) Colony formation abilities of MIA-PaCa-2 + pLXSN (red bars) and MIA-PaCa-2 + WT-TP53 (blue bars) were compared in response to treatment with doxorubicin. (B) Colony formation abilities of MIA-PaCa-2 + pLXSN (red bars) and MIA-PaCa-2 + WT-TP53 (blue bars) were compared in response to verapamil. (C) Colony formation abilities of MIA-PaCa-2 + pLXSN (red bars) and MIA-PaCa-2 + WT-TP53 (blue bars) were compared in response to treatment with vismodegib. The number of colonies for each cell line were normalized to untreated so that the results from pLXSN and WT-TP53 could be compared. These studies were repeated and similar results were observed. ***P < 0.0001, and **P < 0.005.
Drug transporters such as MDR1 are often upregulated in drug resistant cells [78–80]. Verapamil will inhibit the activity of certain drug transporters such as MDR1. Addition of WT-TP53 activity to MIA-PaCa-2 cells increased their sensitivity to verapamil as determined by colony formation in soft agar (Figure 12B).
Hh signaling is critical in differentiation and in some cases, cancer metastasis [81]. Hh pathway inhibitors have been evaluated in PDAC patients [82]. Restoration of WT-TP53 activity in MIA-PaCa-2 cells made them more sensitive to the Hh pathway vismodegib in soft agar colony formation assays (Figure 12C). Thus, restoration of WT-TP53 activity in both MIA-PaCa-2 and PANC-28 cells resulted in the cells becoming more sensitive to chemotherapeutic drugs.
Restoration of WT-TP53 activity in MIA-PaCa-2 cells alters their metabolic properties
For their rapid growth, cancer cells require a large amount of ATP that occurs by glycolysis and mitochondrial oxidative phosphorylation. To determine the consequence of restoration of WT-TP53 activity in energy metabolism in MIA-PaCa-2 cells, stress tests were done with the Seahorse analyzer. This machine determines the extent of glycolysis by determining the extracellular acidification (ECAR) and can also analyze mitochondrial oxidative phosphorylation by measuring the real-time oxygen consumption rate (OCR).
TP53 has been shown to be a cellular energy metabolism regulator [83–88]. It can influence both glycolysis and mitochondrial metabolism through multiple mechanisms [88]. Some studies have shown that mutant TP53 can have more effects on mitochondrial metabolism than glycolysis [89]. The effects of restoration of WT-TP53 activity on mitochondrial activity in PDAC cells have not been documented well.
The effects of WT-TP53 activity on metabolic parameters were determined in MIA-PaCa-2 cells containing and lacking WT-TP53 activity were determined as we previously described [90] using the Seahorse analyzer. The results presented here indicated that restoration of WT-TP53 activity led to a decrease in glycolytic capacity in comparison to cells lacking WT-TP53 activity (Figures 13–15). Moreover, the effects on mitochondrial respiration also were more pronounced in MIA-PaCa-2 cells containing WT-TP53 activity.
![Effects of presence of WT-TP53 on glycolysis and mitochondrial respiration. The data for MIA-PaCa-2 + pLXSN is the same control as presented in [91]. Both MIA-PaCa-2 + pLXSN and MIA-PaCa-2 + WT-TP53 cells were examined the same time on the Seahorse machine as were MIA-PaCa-2 + WT-GSK-3β and MIA-PaCa-2 + KD-GSK-3β cells (all four cell lines done at same time). The data presented in Figure 14 are the means and standard error of the means (SEM).](/article/204038/figure/f13/large)
Figure 13. Effects of presence of WT-TP53 on glycolysis and mitochondrial respiration. The data for MIA-PaCa-2 + pLXSN is the same control as presented in [91]. Both MIA-PaCa-2 + pLXSN and MIA-PaCa-2 + WT-TP53 cells were examined the same time on the Seahorse machine as were MIA-PaCa-2 + WT-GSK-3β and MIA-PaCa-2 + KD-GSK-3β cells (all four cell lines done at same time). The data presented in Figure 14 are the means and standard error of the means (SEM).
![Effects of presence of WT-TP53 on respiratory capacity. The data for MIA-PaCa-2 + pLXSN is the same control as presented in [91]. Both MIA-PaCa-2 + pLXSN and MIA-PaCa-2 + WT-TP53 were examined the same time on the Seahorse machine. The measurements were made 5 times (5 replicates). The data presented in Figure 14 are the means and standard error of the means (SEM).](/article/204038/figure/f14/large)
Figure 14. Effects of presence of WT-TP53 on respiratory capacity. The data for MIA-PaCa-2 + pLXSN is the same control as presented in [91]. Both MIA-PaCa-2 + pLXSN and MIA-PaCa-2 + WT-TP53 were examined the same time on the Seahorse machine. The measurements were made 5 times (5 replicates). The data presented in Figure 14 are the means and standard error of the means (SEM).
![Effects of presence of WT-TP53 on glycolysis. Glycolysis for STAT, glycolytic capacity, and glycolytic reserve for STAT were measured by the Seahorse instrument. The data for MIA-PaCa-2 + pLXSN is the same control as presented in [91]. Both MIA-PaCa-2 + MIA-PaCa-2 + WT-TP53 were examined the same time on the Seahorse machine. STAT is an abbreviation for statistics used in study which was the Mann–Whitney test.](/article/204038/figure/f15/large)
Figure 15. Effects of presence of WT-TP53 on glycolysis. Glycolysis for STAT, glycolytic capacity, and glycolytic reserve for STAT were measured by the Seahorse instrument. The data for MIA-PaCa-2 + pLXSN is the same control as presented in [91]. Both MIA-PaCa-2 + MIA-PaCa-2 + WT-TP53 were examined the same time on the Seahorse machine. STAT is an abbreviation for statistics used in study which was the Mann–Whitney test.
Upon restoration of WT-TP53 activity in MIA-PaCa-2 cells, the level of basal mitochondrial respiration was significantly lower than in MIA-PaCa-2 lacking WT-TP53 activity. Also, their maximal respiratory and spare respiratory capacity levels were significantly reduced in contrast to cells lacking WT-TP53 (Figures 13 and 14).