


Introduction
Successful aging is a multidimensional construct covering behavioral, social, and psychological domains of well-being, all amenable to individual actions and public health interventions [1–4]. Even if the multifaceted understanding of older people’s health and well-being is on the rise [5], most studies still focus on single well-being domains. For example, the protective effect of lifestyle factors such as Mediterranean diet [6–8], smoking [9, 10] and leisure activity [11–14] on physical frailty and survival has been extensively explored. Studies have also shown that better social and psychological well-being are associated with a slower decline in physical function [15], lower risk of disability [16], and longer survival [17] among older adults.
Nevertheless, none of these factors alone seems sufficient to explain the great heterogeneity in aging phenotypes, and successful aging may rather result from simultaneously adhering to several of these protective factors [18, 19]. In spite of this, few studies have addressed the complexity and multidimensionality of successful aging by accounting for the coexistence and interactions among several factors and their contribution to old-age health [15, 20–23]. This requires methodological approaches that integrate multiple interrelated indicators to identify those that are shared by groups of older adults with a given aging phenotype [24].
In this study, we used latent class analysis to detect data-driven subgroups of people with similar well-being profiles according to behavioral (diet, smoking, and physical and mental leisure activities), social (social participation, connections, and support) and psychological (life satisfaction, positive and negative affect) well-being indicators, as defined by the Centers for Disease Control and Prevention (CDC) [25]. Given that men and women tend to behave differently on several well-being factors, we performed our analyses stratified by sex. For instance, women are more likely to engage in protective health behaviors (e.g., healthy diet, non-smoking, routine physical checkups), participate in social events and report higher life satisfaction [26, 27], while men tend to be more physically active, feel less lonely and report better psychological well-being, in general [15, 26, 28, 29]. Men and women have also different healthy life expectancies [30].
Most studies looking at indicators of well-being in old age have focused on single outcomes such as frailty, disability or death [31, 32]. Unlike previous studies, we created a mobility-survival aggregate endpoint to convey the importance of not only living longer but also healthier, in consonance with the widespread claim of adding years to life and life to years [33]. Mobility decline precedes disability and premature death, and is therefore considered an optimal early indicator of physical function decay among older adults [34].
The specific aims of this study were: 1) to identify distinct well-being profiles among men and women separately, by using latent class analysis; 2) to determine which of these profiles are associated with the greatest benefit in terms of mobility-limitation-free survival; and 3) to quantify these potential benefits in absolute terms by calculating differences in median age at onset of mobility limitation or death across profiles.
Materials and Methods
Study population
Data were gathered from the Swedish National Study on Aging and Care in Kungsholmen (SNAC-K; https://www.snac-k.se/), an ongoing population-based study. SNAC-K includes a random sample of adults aged 60 years or older living at home or in institutions in the Kungsholmen district of Stockholm, Sweden, between 2001 and 2004. A random sample of individuals from 11 age cohorts (ages 60, 66, 72, 78, 81, 84, 87, 90, 93, 96 and ≥99 years) were invited to participate in the study. The baseline SNAC-K population included 3363 individuals (73.3% participation rate) who have been followed up regularly: every six years for the young-old cohorts (<78 years) and every three years for the older cohorts (≥78 years). At each study wave, physicians, nurses, and psychologists conducted extensive clinical examinations, interviews, and assessments following standard procedures. SNAC-K data has been linked to the National Patient Register and the Swedish Cause of Death Register to obtain information on medical history and vital status.
This study included data from baseline and four follow-ups of SNAC-K, extending until December 2015 (whereas the death register coverage extended until December 2016). Out of the 3363 participants from SNAC-K baseline, we first excluded 322 individuals (9.6%) with a definite or questionable dementia diagnosis according to the Diagnostic and Statistical Manual of Mental Disorders (4th edition) and 55 individuals (1.8% of the remaining sample) with a Mini-Mental State Examination (MMSE) score <24 because of the limited reliability of their self-reported exposures. We further excluded 704 individuals (23.6% of the remaining sample) with mobility limitation at baseline, i.e., walking speed <0.8 meters per second (m/s), according to an established clinical cut-off [35]. Finally, we excluded 794 individuals (34.8% of the remaining sample) with missing data on any variable (42 individuals with missing data on walking speed, 301 additional individuals with >20% missing data on diet, 9 additional individuals with missing data on smoking, 9 additional individuals with missing data on social connections, 116 additional individuals with missing data on life satisfaction, 285 additional individuals with missing data on positive affect, 32 additional individuals with missing data on negative affect). After applying all exclusion criteria, 1488 functionally healthy participants remained in the study sample (Supplementary Figure 1).
SNAC-K was approved by the Swedish Ethical Review Authority in Stockholm, and written informed consent was obtained from participants or their next of kin.
Outcome: mobility-limitation-free survival
Walking speed was assessed by trained nurses, whereby participants were asked to walk 6m or 2.4m at a self-selected speed and using a walking aid if needed. The length of the walk was determined by asking participants how fast they normally walked (i.e., normal/fast walkers did the longer walk and slow/very slow walkers did the shorter walk). It was reported as meters per second (m/s), reflecting the speed for whichever length walked [15]. Mobility limitation was defined as having a walking speed below 0.8 m/s, a well-established and clinically validated cut-off [15, 35]. Information on death date was obtained from the National Cause of Death Register hosted and updated annually by the Swedish National Board of Health and Welfare, and linked to SNAC-K data through the personal identification number assigned to Swedish residents.
A composite endpoint, considered to be an indicator of mobility-limitation-free survival, was operationalized by taking into account the time from study entry until the development of mobility limitation (i.e., walking speed <0.8m/s) or death, whichever occurred first.
Exposures
Behavioral well-being
Mediterranean diet
Usual dietary intakes were assessed using a validated self-administered 98-item semi-quantitative food frequency questionnaire (SFFQ). Participants were asked to report their average intake frequency of each food and beverage over the past 12 months on a fixed 9-level scale ranging from never to ≥4 times per day. Zero imputation was applied to replace SFFQ missing items [22]. This is considered a reasonable technique to use with the FFQ, especially for those foods that are not eaten frequently and are thus likely to represent a null consumption [36]. Frequencies were converted into daily consumption and the energy intake was calculated by multiplying these frequencies by a portion size value and by the energy content, based on a food composition database from the National Food Administration using MATs software Version 4.03 (Rudans Lättdata, Västerås, Sweden) [37]. A score indicating the degree of adherence to Mediterranean Diet (MDS: range 0-9) [22] was calculated according to the formula proposed by Trichopoulou et al. [38]. The score was adjusted for total energy intake using the residual method [39]. We further categorized MDS into low, moderate and high adherence according to its tertiles.
Smoking
Information was obtained from baseline data and smokers and former smokers were asked how long they had smoked and the number of cigarettes smoked per day. Former smokers were also asked at what age they had stopped smoking. We further categorized smoking into current, former and never smokers.
Physical and mental leisure activities
Participants were asked to specify the type and frequency (i.e., monthly, weekly, less frequently, never) of the leisure activities they regularly engaged in. We grouped the reported activities into physical, mental, and social according to the category they predominantly belonged to, following a procedure described elsewhere [40]. The scores for each type of activity were standardized (i.e., z-scores) based on the baseline mean and standard deviation and were further categorized into low, moderate and high levels according to their tertiles.
Physical leisure activities included: gardening, hiking in the forest/pick berries or mushrooms, hunting/fishing, doing home repairs, and carrying out light exercise (e.g., walking along roads/in parks, walking in the woods, short bicycle rides, light aerobics, golf) or moderate to intense exercise (e.g., jogging, long power walks, heavy duty gardening, long bicycle rides, high intensity aerobics, long distance ice skating, swimming, ball sports other than golf, or other similar activities). Mental leisure activities included: using the internet/playing computer games, painting/drawing/working with clay/pottery, carrying out car or mechanical repairs, and reading books.
Psychological well-being
Life satisfaction
Life satisfaction was assessed through the validated self-reported Life Satisfaction Index A (LSI-A) that captures five different components: zest versus apathy, resolution and fortitude, congruence between desired and achieved goals, positive self-concept, and mood tone. The LSI-A consists of 20 items with an “agree,” “disagree,” or “uncertain” response (range 0-100). A high score indicates that the person takes pleasure from the round of activities that constitutes his or her everyday life, regards life as meaningful and resolutely accepts life as it has been, feels he or she has succeeded in achieving his or her major goals, holds a positive self-image, and maintains happy and optimistic attitudes and mood [15, 41]. We further categorized life satisfaction into low, moderate and high levels according to tertiles.
Negative affect
Negative affect reflects the extent to which a person feels guilt, anger, or fear, and it considers the following features: distressed, upset, scared, nervous, and afraid. Respondents were asked to report whether and to what extent they had felt in the above-mentioned affective states during the last four weeks. The response options were “not at all,” “a little,” “somewhat,” “quite a bit,” and “very much” (range 5-25) [15, 41]. We further categorized negative affect into low, moderate and high levels according to tertiles.
Positive affect
Positive affect considers the following affective features: active, inspired, determined, alert, and enthusiastic. Respondents were asked to report whether and to what extent they had felt in the above-mentioned affective states during the last 4 weeks. The response options were “not at all,” “a little,” “somewhat,” “quite a bit,” and “very much” (range 5-25) [15, 41]. We further categorized positive affect into low, moderate and high levels according to tertiles.
Covariates
Several covariates were considered as possible confounders and measured at baseline: age (continuous), highest level of formal education (elementary school, high school, or university and above), number of chronic diseases (continuous) [42], and Mini-Mental State Examination score (MMSE). In SNAC-K, personality traits (extraversion, neuroticism, and openness to experience) were assessed with a short version of the self-reported NEO Five-Factor Inventory (NEO-FFI) questionnaire [43].
Statistical analysis
Latent class analysis (LCA) was used to derive the well-being profiles based on the 10 indicators of behavioral, social and psychological well-being assessed at baseline. LCA is a statistical person-centered approach which groups individuals into unobserved classes based on responses to manifest variables. This results in subgroups of individuals similar to each other and distinct from those in other classes [44]. We used the Stata command gsem lclass to estimate the latent class models using the maximum-likelihood estimation. Analyses were run separately in men and women. We started with 2 class-solutions, incrementally increasing the number of classes. The ideal number of classes was determined using statistical criteria and interpretations based on theoretical knowledge. Goodness-of-fit indices included Akaike Information Criterion (AIC) and Bayesian Information Criterion (BIC). Participants were assigned to one specific class according to their highest posterior probability. Subsequently, the distribution of all behavioral, social, and psychological factors across the derived classes was examined.
The association between the well-being profiles and the incidence rate of the composite endpoint (i.e., mobility limitation or death) was analyzed through multivariate Cox proportional hazards regression models, from which hazard ratios (HRs) and 95% confidence intervals (CIs) were obtained. The proportional hazard assumption was assessed by regressing the scaled Schoenfeld residuals against survival time. No deviation from the proportional hazard assumption was detected. The models were first adjusted for age and education, and additionally by baseline number of chronic diseases and MMSE score in a second phase. We used Laplace regressions to quantify the differences (in years) in median age at onset of mobility limitation or death (so-called median mobility-limitation-free survival), according to the well-being profiles. In other words, we analyzed the differences in age when 50% of subjects in each well-being profile had developed the composite endpoint. Population-attributable fractions (PAFs) were calculated to estimate the proportion of the composite outcome that would be avoided if all subjects belonged to the best profile, a measure that is valuable from the public health perspective. Because the interpretation of PAFs is more straightforward with binary exposures, all profiles were compared against the one with the greatest mobility-limitation-free survival.
We carried out the following sensitivity analyses. First, in order to verify the robustness of the classes derived from LCA, we performed a data dimension reduction using multiple correspondence analysis (MCA), a generalization of principal component analysis (PCA) for categorical data. We used the obtained dimensions to plot the coordinates for every category of the 10 well-being indicators and their corresponding sum of squared Cosine (Cos2). Second, we further plotted the original data on a reduced two-dimensional grid, while labelling the observations with their corresponding well-being profiles obtained from LCA. Finally, we repeated the Cox and Laplace regression analyses: a) additionally adjusting by personality traits, b) excluding participants who were only interviewed at baseline, and c) excluding participants who dropped-out without developing mobility limitation or death.
All analyses were performed using Stata version 15 and R version 3.6.1. with the level of statistical significance set at p <0.05.
Results
The study population consisted of 1488 individuals with a mean age of 69 years (standard deviation, SD: 8.3) at baseline. The majority were female (59%) and had at least high-school level education (91%) (Table 1). At baseline, the study sample had a median of three chronic diseases (inter-quartile range, IQR: 2;4) and a median MMSE score of 29 (IQR: 29;30). Eligible participants that were excluded due to missingness in any variable (n=794) were older (mean age (SD): 71.8 (8.3)), had a lower education level, more chronic diseases (median: 3; IQR: 2-5) and lower MMSE score (median: 29; IQR: 28-30). Weak-to-moderate correlations were found within and between behavioral, social, and psychological well-being indicators (Table 2). About 47% of the study population developed the composite endpoint during the follow-up (mean: 11 years, SD: 4.0 years) (Table 1). Participants with a walking speed <0.8m/s at baseline, and thus excluded from the sample, were older, had more chronic diseases and reported lower levels of behavioral, social and psychological well-being (Supplementary Table 1).
Table 1. Baseline characteristics of the study population by sex.
| Total population (n=1488) | Males (n=609) | Females (n=879) | p-value | ||||||||||||||||||||||||||||||||||||||||||||||||||||||||||||||||||||||||||||||||||||||||||||||||
| Age (mean, SD) | 69.1 (8.3) | 68.6 (8.2) | 69.5 (8.4) | 0.013 | |||||||||||||||||||||||||||||||||||||||||||||||||||||||||||||||||||||||||||||||||||||||||||||||
| Education (%) | |||||||||||||||||||||||||||||||||||||||||||||||||||||||||||||||||||||||||||||||||||||||||||||||||||
| Elementary | 141 (9.5) | 58 (9.5) | 83 (9.4) | 0.001 | |||||||||||||||||||||||||||||||||||||||||||||||||||||||||||||||||||||||||||||||||||||||||||||||
| High school | 707 (47.5) | 256 (42.2) | 451 (51.3) | ||||||||||||||||||||||||||||||||||||||||||||||||||||||||||||||||||||||||||||||||||||||||||||||||
| University | 640 (43.0) | 295 (48.3) | 345 (39.3) | ||||||||||||||||||||||||||||||||||||||||||||||||||||||||||||||||||||||||||||||||||||||||||||||||
| Number of chronic diseases, median (IQR) | 3 (2;4) | 3 (2;4) | 3 (2;4) | 0.031 | |||||||||||||||||||||||||||||||||||||||||||||||||||||||||||||||||||||||||||||||||||||||||||||||
| MMSE score, median (IQR) | 29 (29;30) | 29 (29;30) | 30 (29;30) | 0.196 | |||||||||||||||||||||||||||||||||||||||||||||||||||||||||||||||||||||||||||||||||||||||||||||||
| Mediterranean Diet Score (%) | |||||||||||||||||||||||||||||||||||||||||||||||||||||||||||||||||||||||||||||||||||||||||||||||||||
| Low | 705 (47.4) | 271 (44.5) | 434 (49.4) | 0.178 | |||||||||||||||||||||||||||||||||||||||||||||||||||||||||||||||||||||||||||||||||||||||||||||||
| Moderate | 331 (22.2) | 144 (23.7) | 187 (21.3) | ||||||||||||||||||||||||||||||||||||||||||||||||||||||||||||||||||||||||||||||||||||||||||||||||
| High | 452 (30.4) | 194 (31.9) | 258 (29.4) | ||||||||||||||||||||||||||||||||||||||||||||||||||||||||||||||||||||||||||||||||||||||||||||||||
| Smoking (%) | |||||||||||||||||||||||||||||||||||||||||||||||||||||||||||||||||||||||||||||||||||||||||||||||||||
| Current | 230 (15.5) | 86 (14.1) | 144 (16.4) | <0.001 | |||||||||||||||||||||||||||||||||||||||||||||||||||||||||||||||||||||||||||||||||||||||||||||||
| Former | 639 (42.9) | 321 (52.7) | 318 (36.2) | ||||||||||||||||||||||||||||||||||||||||||||||||||||||||||||||||||||||||||||||||||||||||||||||||
| Never | 619 (41.6) | 202 (33.2) | 417 (47.4) | ||||||||||||||||||||||||||||||||||||||||||||||||||||||||||||||||||||||||||||||||||||||||||||||||
| Physical leisure activity (%) | |||||||||||||||||||||||||||||||||||||||||||||||||||||||||||||||||||||||||||||||||||||||||||||||||||
| No activity | 497 (33.4) | 164 (26.9) | 333 (37.9) | <0.001 | |||||||||||||||||||||||||||||||||||||||||||||||||||||||||||||||||||||||||||||||||||||||||||||||
| Mild activity | 510 (34.3) | 209 (34.3) | 301 (34.2) | ||||||||||||||||||||||||||||||||||||||||||||||||||||||||||||||||||||||||||||||||||||||||||||||||
| Intense activity | 481 (32.3) | 236 (38.8) | 245 (27.9) | ||||||||||||||||||||||||||||||||||||||||||||||||||||||||||||||||||||||||||||||||||||||||||||||||
| Mental leisure activity (%) | |||||||||||||||||||||||||||||||||||||||||||||||||||||||||||||||||||||||||||||||||||||||||||||||||||
| No activity | 545 (36.5) | 172 (28.2) | 373 (42.4) | <0.001 | |||||||||||||||||||||||||||||||||||||||||||||||||||||||||||||||||||||||||||||||||||||||||||||||
| Mild activity | 448 (30.1) | 182 (29.9) | 266 (30.3) | ||||||||||||||||||||||||||||||||||||||||||||||||||||||||||||||||||||||||||||||||||||||||||||||||
| Intense activity | 495 (33.3) | 255 (41.9) | 240 (27.3) | ||||||||||||||||||||||||||||||||||||||||||||||||||||||||||||||||||||||||||||||||||||||||||||||||
| Social leisure activity (%) | |||||||||||||||||||||||||||||||||||||||||||||||||||||||||||||||||||||||||||||||||||||||||||||||||||
| Low | 496 (33.3) | 234 (38.4) | 262 (29.8) | 0.001 | |||||||||||||||||||||||||||||||||||||||||||||||||||||||||||||||||||||||||||||||||||||||||||||||
| Moderate | 496 (33.3) | 200 (32.8) | 296 (33.7) | ||||||||||||||||||||||||||||||||||||||||||||||||||||||||||||||||||||||||||||||||||||||||||||||||
| High | 496 (33.3) | 175 (28.7) | 321 (36.5) | ||||||||||||||||||||||||||||||||||||||||||||||||||||||||||||||||||||||||||||||||||||||||||||||||
| Social connections (%) | |||||||||||||||||||||||||||||||||||||||||||||||||||||||||||||||||||||||||||||||||||||||||||||||||||
| Low | 496 (33.3) | 175 (28.7) | 321 (36.5) | <0.001 | |||||||||||||||||||||||||||||||||||||||||||||||||||||||||||||||||||||||||||||||||||||||||||||||
| Moderate | 496 (33.3) | 199 (32.7) | 297 (33.8) | ||||||||||||||||||||||||||||||||||||||||||||||||||||||||||||||||||||||||||||||||||||||||||||||||
| High | 496 (33.3) | 235 (38.6) | 261 (29.7) | ||||||||||||||||||||||||||||||||||||||||||||||||||||||||||||||||||||||||||||||||||||||||||||||||
| Social support (%) | |||||||||||||||||||||||||||||||||||||||||||||||||||||||||||||||||||||||||||||||||||||||||||||||||||
| Low | 496 (33.3) | 222 (36.5) | 274 (30.9) | 0.104 | |||||||||||||||||||||||||||||||||||||||||||||||||||||||||||||||||||||||||||||||||||||||||||||||
| Moderate | 496 (33.3) | 193 (31.7) | 303 (34.5) | ||||||||||||||||||||||||||||||||||||||||||||||||||||||||||||||||||||||||||||||||||||||||||||||||
| High | 496 (33.3) | 194 (31.9) | 302 (34.4) | ||||||||||||||||||||||||||||||||||||||||||||||||||||||||||||||||||||||||||||||||||||||||||||||||
| Life satisfaction (%) | |||||||||||||||||||||||||||||||||||||||||||||||||||||||||||||||||||||||||||||||||||||||||||||||||||
| Low | 550 (37.0) | 209 (34.3) | 341 (38.8) | 0.211 | |||||||||||||||||||||||||||||||||||||||||||||||||||||||||||||||||||||||||||||||||||||||||||||||
| Moderate | 572 (38.4) | 243 (40.0) | 329 (37.4) | ||||||||||||||||||||||||||||||||||||||||||||||||||||||||||||||||||||||||||||||||||||||||||||||||
| High | 366 (24.6) | 157 (25.8) | 209 (23.8) | ||||||||||||||||||||||||||||||||||||||||||||||||||||||||||||||||||||||||||||||||||||||||||||||||
| Negative affect (%) | |||||||||||||||||||||||||||||||||||||||||||||||||||||||||||||||||||||||||||||||||||||||||||||||||||
| High | 482 (32.4) | 172 (28.2) | 310 (35.3) | 0.012 | |||||||||||||||||||||||||||||||||||||||||||||||||||||||||||||||||||||||||||||||||||||||||||||||
| Moderate | 356 (23.9) | 148 (24.3) | 208 (23.7) | ||||||||||||||||||||||||||||||||||||||||||||||||||||||||||||||||||||||||||||||||||||||||||||||||
| Low | 650 (43.7) | 289 (47.5) | 361 (41.1) | ||||||||||||||||||||||||||||||||||||||||||||||||||||||||||||||||||||||||||||||||||||||||||||||||
| Positive affect (%) | |||||||||||||||||||||||||||||||||||||||||||||||||||||||||||||||||||||||||||||||||||||||||||||||||||
| Low | 591 (39.7) | 243 (39.9) | 348 (39.6) | 0.676 | |||||||||||||||||||||||||||||||||||||||||||||||||||||||||||||||||||||||||||||||||||||||||||||||
| Moderate | 467 (31.4) | 197 (32.4) | 270 (30.7) | ||||||||||||||||||||||||||||||||||||||||||||||||||||||||||||||||||||||||||||||||||||||||||||||||
| High | 430 (28.9) | 169 (27.8) | 261 (29.7) | ||||||||||||||||||||||||||||||||||||||||||||||||||||||||||||||||||||||||||||||||||||||||||||||||
| Death or mobility limitation during follow-up | 699 (47%) | 286 (47%) | 413 (47%) | 0.993 | |||||||||||||||||||||||||||||||||||||||||||||||||||||||||||||||||||||||||||||||||||||||||||||||
| Death without mobility limitation during follow-up | 263 (17.7) | 133 (21.8) | 130 (14.8) | 0.001 | |||||||||||||||||||||||||||||||||||||||||||||||||||||||||||||||||||||||||||||||||||||||||||||||
| Mobility limitation (walking speed <0.8 m/s) during follow-up | 436 (29.3) | 153 (25.1) | 283 (32.2) | 0.003 | |||||||||||||||||||||||||||||||||||||||||||||||||||||||||||||||||||||||||||||||||||||||||||||||
| SD, standard deviation; IQR, interquartile range; MMSE, Mini Mental State Examination. | |||||||||||||||||||||||||||||||||||||||||||||||||||||||||||||||||||||||||||||||||||||||||||||||||||
| p-values for differences observed among males and females estimated using the chi2 test. | |||||||||||||||||||||||||||||||||||||||||||||||||||||||||||||||||||||||||||||||||||||||||||||||||||
Table 2. Correlations among the different behavioral, social and psychological well-being indicators.
| MDS | Smoking | Physical leisure | Mental leisure | Social leisure | Social connection | Social support | Life satisfaction | Negative affect | Positive affect | ||||||||||||||||||||||||||||||||||||||||||||||||||||||||||||||||||||||||||||||||||||||||||
| MDS | 1.00 | - | - | - | - | - | - | - | - | - | |||||||||||||||||||||||||||||||||||||||||||||||||||||||||||||||||||||||||||||||||||||||||
| Smoking | -0.08 | 1.00 | - | - | - | - | - | - | - | - | |||||||||||||||||||||||||||||||||||||||||||||||||||||||||||||||||||||||||||||||||||||||||
| Physical leisure | 0.19 | 0.04 | 1.00 | - | - | - | - | - | - | - | |||||||||||||||||||||||||||||||||||||||||||||||||||||||||||||||||||||||||||||||||||||||||
| Mental leisure | 0.17 | 0.12 | 0.45 | 1.00 | - | - | - | - | - | - | |||||||||||||||||||||||||||||||||||||||||||||||||||||||||||||||||||||||||||||||||||||||||
| Social leisure | 0.15 | -0.11 | 0.31 | 0.37 | 1.00 | - | - | - | - | - | |||||||||||||||||||||||||||||||||||||||||||||||||||||||||||||||||||||||||||||||||||||||||
| Social connection | 0.16 | -0.05 | 0.27 | 0.31 | 0.23 | 1.00 | - | - | - | - | |||||||||||||||||||||||||||||||||||||||||||||||||||||||||||||||||||||||||||||||||||||||||
| Social support | 0.13 | -0.04 | 0.18 | 0.25 | 0.41 | 0.46 | 1.00 | - | - | - | |||||||||||||||||||||||||||||||||||||||||||||||||||||||||||||||||||||||||||||||||||||||||
| Life satisfaction | 0.13 | -0.06 | 0.29 | 0.34 | 0.30 | 0.37 | 0.41 | 1.00 | - | - | |||||||||||||||||||||||||||||||||||||||||||||||||||||||||||||||||||||||||||||||||||||||||
| Negative affect | -0.04 | 0.06 | -0.03 | 0.08 | -0.03 | -0.05 | -0.16 | -0.24 | 1.00 | - | |||||||||||||||||||||||||||||||||||||||||||||||||||||||||||||||||||||||||||||||||||||||||
| Positive affect | 0.14 | -0.04 | 0.32 | 0.36 | 0.32 | 0.25 | 0.31 | 0.56 | -0.03 | 1.00 | |||||||||||||||||||||||||||||||||||||||||||||||||||||||||||||||||||||||||||||||||||||||||
| Correlations between and within psychological and social well-being indicators were assessed using the polychoric test. | |||||||||||||||||||||||||||||||||||||||||||||||||||||||||||||||||||||||||||||||||||||||||||||||||||
| MDS, Mediterranean Diet Score. | |||||||||||||||||||||||||||||||||||||||||||||||||||||||||||||||||||||||||||||||||||||||||||||||||||
A three-latent-class solution was identified to be optimal for both men and women, based on the BIC parameter and the interpretation of the identified profiles (Supplementary Table 2). The worst profile (n=151, 25% in men; n=373, 41.4% in women) was characterized by low adherence to MD, a higher proportion of former/never smokers, lowest levels of leisure activity engagement, and lowest levels of social and psychological well-being (Table 3). The intermediate profile (n=313, 51.2% in men; n=237, 28.9% in women) was characterized by low/moderate adherence to MD, a higher proportion of former/never smokers, and moderate levels of social and psychological well-being. Men in this profile had a low/moderate engagement in leisure activities, while women had moderate/high engagement levels. The best profile (n=145, 23.8% in men; n=269, 29.7% in women) was characterized by high adherence to MD, the lowest proportion of current smokers, high engagement with leisure activities, and highest levels of social and psychological well-being (Table 3). Results from the MCA showed that similar levels (i.e., low, moderate, high) of the 10 well-being indicators clustered together confirming the composition of the profiles identified by the LCA (Figure 1 and Supplementary Figure 2).
Table 3. Distribution of behavioral, social, and psychological well-being indicators across well-being profiles in males and females.
| Males (n=609) | Females (n=879) | |||||
| Worst 25.0% | Intermediate 51.2% | Best 23.8% | Worst 41.4% | Intermediate 28.9% | Best 29.7% | |
| Mediterranean Diet Score (%) | ||||||
| Low | 61.3 | 43.9 | 32.4 | 59.5 | 46.4 | 35.1 |
| Moderate | 14.2 | 22.8 | 27.1 | 21.3 | 21.5 | 24.4 |
| High | 24.5 | 33.3 | 40.5 | 19.2 | 32.1 | 40.5 |
| Smoking (%) | ||||||
| Current | 15.1 | 16.8 | 9.6 | 19.8 | 16.9 | 11.1 |
| Former | 50.4 | 52.3 | 56.0 | 28.2 | 46.7 | 37.0 |
| Never | 34.6 | 31.9 | 34.4 | 52.0 | 36.3 | 51.9 |
| Physical leisure activity (%) | ||||||
| No activity | 56.0 | 37.8 | 0.0 | 60.4 | 11.8 | 17.0 |
| Mild activity | 31.0 | 37.0 | 27.9 | 28.9 | 41.3 | 31.4 |
| Intense activity | 13.0 | 25.2 | 72.1 | 10.7 | 47.0 | 51.6 |
| Mental leisure activity (%) | ||||||
| No activity | 66.8 | 32.1 | 2.4 | 72.7 | 17.3 | 24.8 |
| Mild activity | 20.6 | 46.8 | 16.4 | 21.9 | 35.8 | 21.5 |
| Intense activity | 12.7 | 21.1 | 81.3 | 5.4 | 46.9 | 53.8 |
| Social leisure activity (%) | ||||||
| Low | 60.2 | 35.2 | 1.2 | 58.3 | 22.2 | 9.3 |
| Moderate | 30.5 | 37.9 | 26.7 | 25.8 | 45.2 | 32.6 |
| High | 9.4 | 26.9 | 72.2 | 15.9 | 32.5 | 58.1 |
| Social connections (%) | ||||||
| Low | 74.8 | 23.9 | 10.1 | 50.6 | 36.1 | 6.5 |
| Moderate | 20.3 | 42.4 | 27.5 | 29.9 | 39.9 | 31.7 |
| High | 5.9 | 33.7 | 62.4 | 19.5 | 24.0 | 61.8 |
| Social support (%) | ||||||
| Low | 78.8 | 22.9 | 8.2 | 50.7 | 42.5 | 0.0 |
| Moderate | 17.8 | 44.7 | 25.2 | 30.6 | 43.3 | 29.3 |
| High | 3.4 | 32.5 | 66.6 | 18.6 | 14.2 | 70.6 |
| Life satisfaction (%) | ||||||
| Low | 87.3 | 17.8 | 14.2 | 67.2 | 29.3 | 9.5 |
| Moderate | 12.3 | 55.0 | 36.5 | 21.4 | 42.5 | 25.4 |
| High | 0.4 | 27.2 | 49.3 | 11.5 | 28.3 | 66.1 |
| Negative affect (%) | ||||||
| High | 41.5 | 20.0 | 32.2 | 27.6 | 33.0 | 19.4 |
| Moderate | 24.7 | 23.4 | 25.8 | 30.6 | 38.4 | 28.5 |
| Low | 33.8 | 56.7 | 42.0 | 41.8 | 28.7 | 52.2 |
| Positive affect (%) | ||||||
| Low | 80.2 | 30.1 | 17.5 | 70.4 | 25.6 | 10.2 |
| Moderate | 12.8 | 43.0 | 30.0 | 19.4 | 40.7 | 36.8 |
| High | 7.0 | 26.3 | 52.5 | 10.2 | 33.8 | 53.0 |
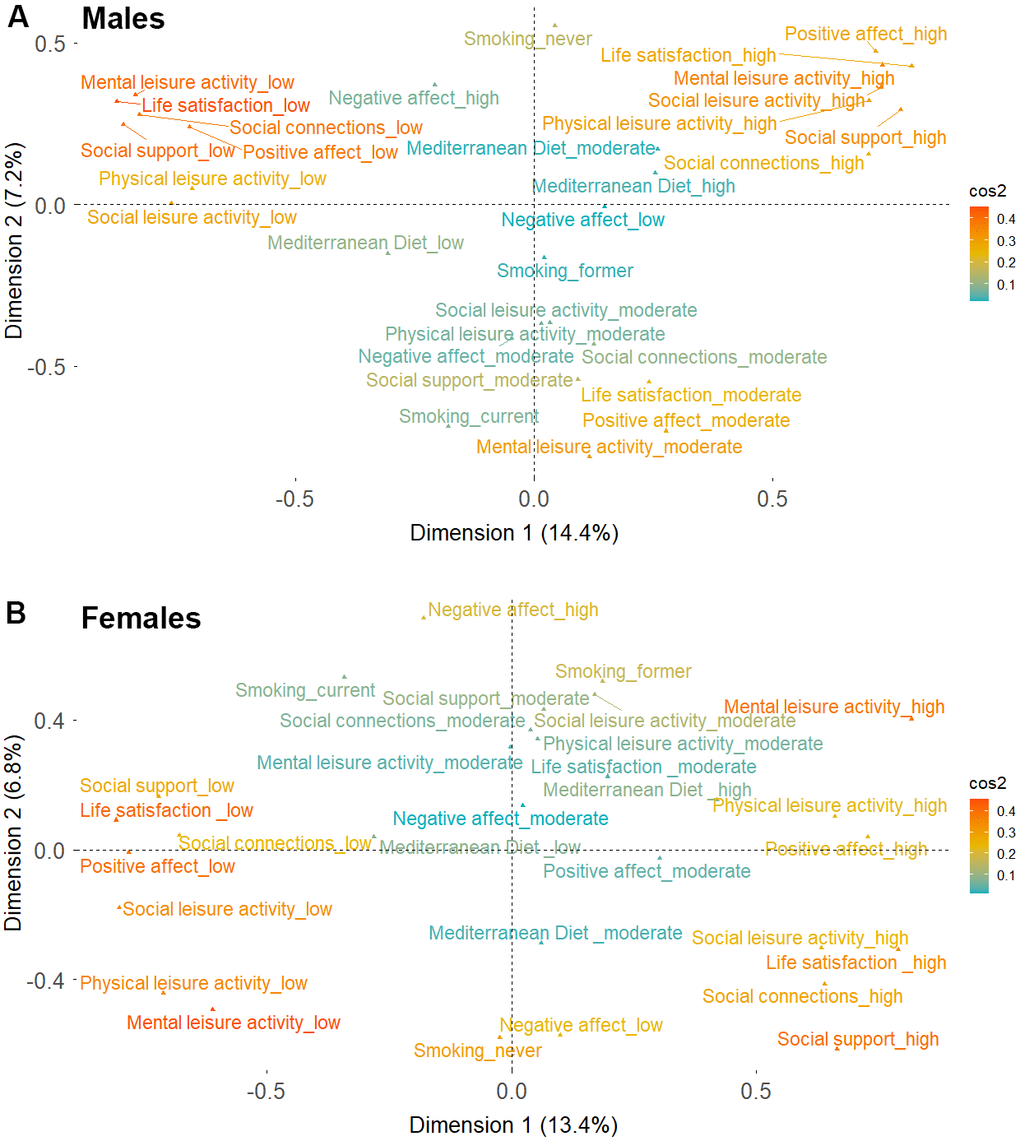
Figure 1. Two-dimensional coordinates for the different behavioral, social and psychological well-being indicators derived from multiple component analysis. (A) Males (B) Females. Cos2 color gradient represents the adequacy of the representation of the different indicators on the two-dimensional map. Cos2 values closer to one indicate a better representation of a variable’s categories over the two-dimensional map.
Men and women in the best profile were younger, with higher levels of education, had less chronic diseases at baseline, and had a lower incidence of the composite endpoint compared to those in the worst profile (Supplementary Table 3). The associations between the well-being profiles and the incidence of the composite outcome are shown in Figure 2. After adjusting for potential confounders, men and women in the intermediate profile had a 27% (HR 0.73; 95% CI 0.56-0.94) and a 23% (HR 0.77; 95% CI 0.59-1.00) lower hazard of developing the composite endpoint, respectively, compared to those in the worst profile. An even greater protective effect was seen among individuals in the best profile compared to those in the worst profile (HR 0.47; 95% CI 0.31-0.70 in men; HR 0.60; 95% CI 0.46-0.78 in women). We also show the outcome incidence rates across all well-being indicators and covariates in males and females in Supplementary Table 4.
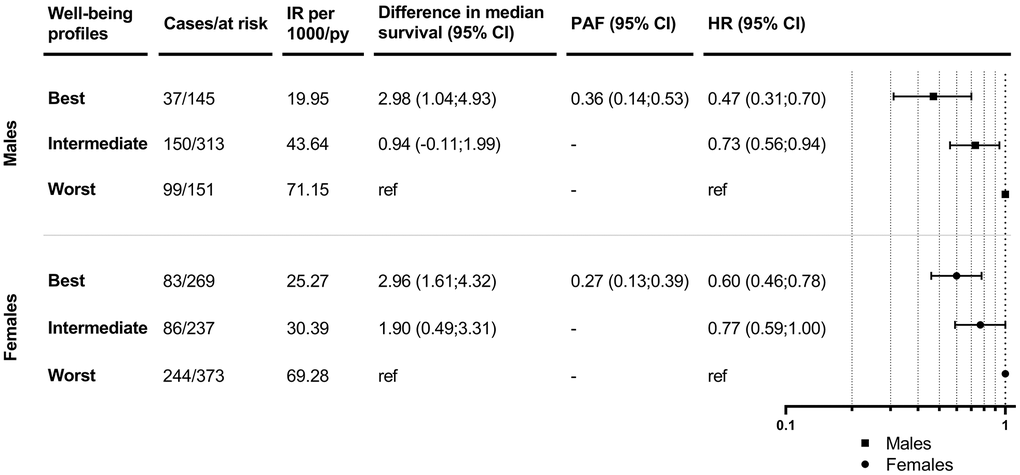
Figure 2. Associations between well-being profiles and mobility-limitation-free survival in males and females. IR: incidence rates; PY: person-years; CI: confidence interval; PAF: population attributable fraction; HR: hazard ratio. Models are adjusted for age, education, number of chronic diseases and MMSE score at baseline.
In agreement with the Cox regressions, results from Laplace regressions showed that men in the intermediate and best profiles survived 1 and 3 years longer without mobility limitations, respectively, compared to those in the worst profile after adjustment for potential confounders (Figure 2). Women in the intermediate and best profiles lived 2 and 3 years longer without mobility limitations, respectively, compared to those in the worst profile. The PAFs for belonging to the intermediate and worst versus the best profile was 36% (95% CI 0.14-0.53) for men and 27% (95% CI 0.13-0.39) for women. Similar trends were observed when further adjusting by personality traits, and when excluding individuals with only baseline information and/or those who dropped-out without developing the outcome (Supplementary Tables 5–7).
Discussion
In this large community-based cohort study of Swedish older adults aged ≥60 years, we found strong synergistic effects among different behavioral, social, and psychological indicators of well-being, leading to a clear gradient of well-being both in men and women. We also found that individuals in the intermediate and best well-being profiles lived between one to three years longer without mobility limitation compared to those in the worst profile, independent of potential confounders.
The few previous studies looking at multiple indicators of well-being simultaneously have suggested that these tend to be interrelated and to cluster within individuals [21, 24, 45]. For example, a recent study including 15,771 older adults from the Chinese Longitudinal Health Longevity Survey (CLHLS) identified four latent classes in men and women separately based on increasing levels of social engagement, psychological well-being and adherence to positive health behaviors [21]. The WELL study of Australian older adults identified two classes of lifestyle patterns (i.e., healthy and less healthy) based on concomitantly varying levels of healthy diet, physical activity, sedentary behavior, smoking and alcohol consumption [24]. In accordance with these studies, we found that similar levels across 10 different behavioral, social, and psychological well-being indicators clustered within specific well-being profiles, leading to a clear well-being gradient (i.e., worst, intermediate, best) among men and women. Despite the rising evidence supporting a multidimensional construct of successful aging, most longitudinal studies still fail to cover well-being indicators belonging to different domains, as shown by the disproportionate amount of literature focusing exclusively on lifestyle factors [45–48].
Our finding that well-being profiles may considerably prolong mobility-limitation-free survival among older adults has been partially corroborated by previous evidence. Studies carried out with populations from the blue zones constitute a relevant example. These populations are characterized by a high adherence to a healthy diet and physical activity, increased satisfaction with social ties, high social support and psychological well-being, and exceptional longevity without severe disability [49]. A recent study from the seniors-ENRICA cohort concluded that the joint effect of Mediterranean diet, physical activity, rest, social engagement and conviviality conferred the highest protection against frailty [23]. Similarly, in previous studies from SNAC-K, we showed that a higher adherence to Mediterranean diet, especially in combination with recommended levels of physical activity and high levels of social support, can delay the decline in mobility and muscle strength inherent to aging [22] and, that older adults with high levels in both social and psychological well-being have a slower loss of physical function [15]. In another study using SNAC-K, we also found that older adults in the healthiest behavioral profile−concurrently considering lifestyle factors, social network size, and leisure activity participation−lived almost three years longer and developed disability almost four years later compared to those in the least healthy behavioral profile [20]. Compared to the latter study, ours was based on a healthier sample and an outcome (i.e., mobility limitation) that precedes disability. Therefore, our findings further corroborate and complement those from Wu et al. A longitudinal study comprising 10,602 participants aged 40-64 years from the Atherosclerosis Risk in Communities (ARIC) study concluded that those with a healthy lifestyle, defined as following a healthy diet, moderate alcohol and coffee consumption, being physically active, having a normal body weight, and not smoking, had a significantly reduced risk of impaired lower extremity function, and limitations in basic and instrumental activities of daily living than participants with an unhealthy lifestyle [50]. Another longitudinal study of 5,248 American older adults showed that simultaneously adhering to multiple healthy lifestyle factors such as never smoking, moderate alcohol consumption, physical activity, healthy diet, low body mass index, intense social networks, and social support, can compress the number of years lived with disability [51]. Our results advance previous findings by integrating multiple indicators across the behavioral, social and psychological domains of well-being, highlighting their synergistic effects and targeting them as potential modifiable sources of resilience against age-related declines in physical function. Moreover, we created a mobility-survival aggregate endpoint highlighting the importance of not only living longer, but also healthier [33].
Although previous research suggests that non-pharmacological multi-domain interventions can help preserve mental health and cognitive function among older adults [52], there is a clear lack of intervention studies combining behavioral, social and psychological well-being domains in the context of mobility decline prevention in healthy older adults. Instead, most physical function interventions have been based solely on the improvement of nutrition and physical activity and have incorporated well-being and quality of life as primary or secondary outcomes [53–55]. This reflects, among others, the existing asymmetry towards observational studies looking at the reverse association, i.e., impact of physical function on well-being, even if the opposite causal pathway may also be plausible. Along these lines, there is preliminary evidence suggesting that interventions targeting well-being through purposeful activity, i.e., activities that cultivate the pursuit of personal and social goals, feelings of usefulness, and structured community engagement, also impact behavioral, social, and emotional domains [56], but their effect on physical function has not been extensively evaluated. In addition, longitudinal studies exploring the complex mechanisms triggered by the synergies among behavioral, social and psychological well-being factors are warranted, looking beyond their isolated roles in the pathogenesis of functional decline and mortality.
Strengths and limitations
The strengths of our study include the longitudinal study design, with a relatively large sample size, and with comprehensive information on a number of behavioral, social and psychological well-being indicators. Thanks to the availability of repeated measures of walking speed and vital status throughout the 15-year follow-up, we were able to create a composite endpoint of mobility-limitation-free survival. Moreover, the use of Laplace regressions allowed for the quantification of the years gained in association with belonging to different well-being profiles, enriching the interpretation of our results.
However, several limitations should be considered. Our exposures were assessed only at baseline to avoid reverse causality, which could be challenging among subjects who are less likely to maintain similar levels over time. Additionally, a subsample of the eligible population (35%) lacked data for any study variables, which could lead to selection bias as those with missing data were sicker. Nevertheless, this may be less problematic in our study given that the sample was purposefully selected to be functionally healthy at baseline. Information on all well-being indicators was self-reported, which might have led to misclassification of the exposures. Participants in this study were cognitively healthier and able to self-report their exposure levels, which might have led to an underestimation of the associations in the general population. Finally, our findings, and especially those referring to the well-being profiles, may have a limited transferability beyond the exceptionally healthy and socioeconomically affluent SNAC-K population.
Conclusions
While theoretical insights into different models of successful aging are on the rise, empirical evidence from population-based longitudinal data on the complex interplay among the distinct well-being domains and their association with person-centered outcomes, such as mobility-limitation-free survival, is currently lacking. This study addresses such an important gap and provides further evidence to better understand and promote functional independence in community-dwelling older adults through primary prevention multi-domain interventions.
Author Contributions
M Saadeh and A Calderón-Larrañaga developed the study concept and design. M Saadeh performed the data analysis (with help from X Hu) and drafted the manuscript. M Saadeh, X Hu, S Dekhtyar, AK Welmer, DL Vetrano, W Xu, L Fratiglioni and A Calderón-Larrañaga interpreted the data. All authors provided critical revisions and approved the final version of the manuscript for submission.
Acknowledgments
We thank the SNAC-K participants and the SNAC-K Group for their collaboration in data collection and management.
Conflicts of Interest
The authors declare that they have no conflicts of interest.
Ethical Statement
Swedish National Study on Aging and Care in Kungsholmen (SNAC-K) was approved by the Swedish Ethical Review Authority in Stockholm, and written informed consent was obtained from participants or their next of kin.
Funding
This work was supported by the funders of The Swedish National study on Aging and Care (SNAC): the Ministry of Health and Social Affairs, Sweden; the participating county councils and municipalities; and the Swedish Research Council. Specific grants were obtained from the Swedish Research Council (2016-00981, 2021-06398); the Swedish Research Council for Health, Working Life and Welfare (2017-01764, 2020-01544, 2021-00256); Karolinska Institutet’s Strategic Young Scholar Grants in Epidemiology or Biostatistics (SFO-EPI); Lindhés Advokatbyrå Foundation; and the Swedish National Graduate School on Ageing and Health (SWEAH). The financial sponsors played no role in the design, execution, analysis and interpretation of data, or writing of the study.
References
- 1. Anton SD, Woods AJ, Ashizawa T, Barb D, Buford TW, Carter CS, Clark DJ, Cohen RA, Corbett DB, Cruz-Almeida Y, Dotson V, Ebner N, Efron PA, et al. Successful aging: Advancing the science of physical independence in older adults. Ageing Res Rev. 2015; 24:304–27. https://doi.org/10.1016/j.arr.2015.09.005 [PubMed]
- 2. Michel JP, Sadana R. “Healthy Aging” Concepts and Measures. J Am Med Dir Assoc. 2017; 18:460–4. https://doi.org/10.1016/j.jamda.2017.03.008 [PubMed]
- 3. Sabia S, Singh-Manoux A, Hagger-Johnson G, Cambois E, Brunner EJ, Kivimaki M. Influence of individual and combined healthy behaviours on successful aging. CMAJ. 2012; 184:1985–92. https://doi.org/10.1503/cmaj.121080 [PubMed]
- 4. Fernández-Ballesteros R, Sánchez-Izquierdo M. Are Psycho-Behavioral Factors Accounting for Longevity? Front Psychol. 2019; 10:2516. https://doi.org/10.3389/fpsyg.2019.02516 [PubMed]
- 5. World Health Organization. World Report on Ageing and Health. 2015.
- 6. Struijk EA, Guallar-Castillón P, Rodríguez-Artalejo F, López-García E. Mediterranean Dietary Patterns and Impaired Physical Function in Older Adults. J Gerontol A Biol Sci Med Sci. 2018; 73:333–9. https://doi.org/10.1093/gerona/glw208 [PubMed]
- 7. Sánchez-Sánchez ML, García-Vigara A, Hidalgo-Mora JJ, García-Pérez MÁ, Tarín J, Cano A. Mediterranean diet and health: A systematic review of epidemiological studies and intervention trials. Maturitas. 2020; 136:25–37. https://doi.org/10.1016/j.maturitas.2020.03.008 [PubMed]
- 8. Silva R, Pizato N, da Mata F, Figueiredo A, Ito M, Pereira MG. Mediterranean Diet and Musculoskeletal-Functional Outcomes in Community-Dwelling Older People: A Systematic Review and Meta-Analysis. J Nutr Health Aging. 2018; 22:655–63. https://doi.org/10.1007/s12603-017-0993-1 [PubMed]
- 9. Brandts L, van den Brandt PA. Sex-specific associations between smoking habits and reaching longevity: Netherlands Cohort Study. Geriatr Gerontol Int. 2018; 18:1249–58. https://doi.org/10.1111/ggi.13468 [PubMed]
- 10. Gellert C, Schöttker B, Brenner H. Smoking and all-cause mortality in older people: systematic review and meta-analysis. Arch Intern Med. 2012; 172:837–44. https://doi.org/10.1001/archinternmed.2012.1397 [PubMed]
- 11. Liu X, Ruan Y, Huang L, Guo Y, Sun S, Chen H, Gao J, Shi Y, Xiao Q. Cognitive leisure activity and all-cause mortality in older adults: a 4-year community-based cohort. BMC Geriatr. 2021; 21:236. https://doi.org/10.1186/s12877-021-02180-3 [PubMed]
- 12. Pressman SD, Matthews KA, Cohen S, Martire LM, Scheier M, Baum A, Schulz R. Association of enjoyable leisure activities with psychological and physical well-being. Psychosom Med. 2009; 71:725–32. https://doi.org/10.1097/PSY.0b013e3181ad7978 [PubMed]
- 13. Haider S, Grabovac I, Dorner TE. Fulfillment of physical activity guidelines in the general population and frailty status in the elderly population : A correlation study of data from 11 European countries. Wien Klin Wochenschr. 2019; 131:288–93. https://doi.org/10.1007/s00508-018-1408-y [PubMed]
- 14. Mok A, Khaw KT, Luben R, Wareham N, Brage S. Physical activity trajectories and mortality: population based cohort study. BMJ. 2019; 365:l2323. https://doi.org/10.1136/bmj.l2323 [PubMed]
- 15. Saadeh M, Welmer AK, Dekhtyar S, Fratiglioni L, Calderón-Larrañaga A. The Role of Psychological and Social Well-being on Physical Function Trajectories in Older Adults. J Gerontol A Biol Sci Med Sci. 2020; 75:1579–85. https://doi.org/10.1093/gerona/glaa114 [PubMed]
- 16. James BD, Boyle PA, Buchman AS, Bennett DA. Relation of late-life social activity with incident disability among community-dwelling older adults. J Gerontol A Biol Sci Med Sci. 2011; 66:467–73. https://doi.org/10.1093/gerona/glq231 [PubMed]
- 17. Lacruz ME, Emeny RT, Baumert J, Ladwig KH. Prospective association between self-reported life satisfaction and mortality: results from the MONICA/KORA Augsburg S3 survey cohort study. BMC Public Health. 2011; 11:579. https://doi.org/10.1186/1471-2458-11-579 [PubMed]
- 18. Rizzuto D, Fratiglioni L. Lifestyle factors related to mortality and survival: a mini-review. Gerontology. 2014; 60:327–35. https://doi.org/10.1159/000356771 [PubMed]
- 19. Buettner D, Skemp S. Blue Zones: Lessons From the World’s Longest Lived. Am J Lifestyle Med. 2016; 10:318–21. https://doi.org/10.1177/1559827616637066 [PubMed]
- 20. Wu W, Xu W, Englund S, Shang Y, Pan KY, Rizzuto D. Can health behaviours prolong survival and compress the period of survival with the disability? A population-based cohort study. Age Ageing. 2021; 50:480–7. https://doi.org/10.1093/ageing/afaa143 [PubMed]
- 21. Shi Z, Lin J, Xiao J, Fang Y. Sex differences in the association between latent class of lifestyle and disability among older adults in China. BMC Geriatr. 2021; 21:188. https://doi.org/10.1186/s12877-021-02087-z [PubMed]
- 22. Saadeh M, Prinelli F, Vetrano DL, Xu W, Welmer AK, Dekhtyar S, Fratiglioni L, Calderón-Larrañaga A. Mobility and muscle strength trajectories in old age: the beneficial effect of Mediterranean diet in combination with physical activity and social support. Int J Behav Nutr Phys Act. 2021; 18:120. https://doi.org/10.1186/s12966-021-01192-x [PubMed]
- 23. Maroto-Rodriguez J, Delgado-Velandia M, Ortolá R, García-Esquinas E, Martinez-Gomez D, Struijk EA, Lopez-Garcia E, Rodriguez-Artalejo F, Sotos-Prieto M. A Mediterranean lifestyle and frailty incidence in older adults: the Seniors-ENRICA-1 cohort. J Gerontol A Biol Sci Med Sci. 2021. [Epub ahead of print]. https://doi.org/10.1093/gerona/glab292 [PubMed]
- 24. Södergren M, Wang WC, Salmon J, Ball K, Crawford D, McNaughton SA. Predicting healthy lifestyle patterns among retirement age older adults in the WELL study: a latent class analysis of sex differences. Maturitas. 2014; 77:41–6. https://doi.org/10.1016/j.maturitas.2013.09.010 [PubMed]
- 25. Centers for Disease Control and Prevention. Well-Being Concepts. 2018. https://www.cdc.gov/hrqol/wellbeing.htm.
- 26. Rogers RG, Everett BG, Onge JM, Krueger PM. Social, behavioral, and biological factors, and sex differences in mortality. Demography. 2010; 47:555–78. https://doi.org/10.1353/dem.0.0119 [PubMed]
- 27. Joshanloo M, Jovanović V. The relationship between gender and life satisfaction: analysis across demographic groups and global regions. Arch Womens Ment Health. 2020; 23:331–8. https://doi.org/10.1007/s00737-019-00998-w [PubMed]
- 28. Kemperman A, van den Berg P, Weijs-Perrée M, Uijtdewillegen K. Loneliness of Older Adults: Social Network and the Living Environment. Int J Environ Res Public Health. 2019; 16:406. https://doi.org/10.3390/ijerph16030406 [PubMed]
- 29. Carmel S. Health and Well-Being in Late Life: Gender Differences Worldwide. Front Med (Lausanne). 2019; 6:218. https://doi.org/10.3389/fmed.2019.00218 [PubMed]
- 30. Eurostat statistics Explained. Healthy life years statistics. 2021. https://ec.europa.eu/eurostat/statistics-explained/index.php?title=Healthy_life_years_statistics.
- 31. Feng Z, Lugtenberg M, Franse C, Fang X, Hu S, Jin C, Raat H. Risk factors and protective factors associated with incident or increase of frailty among community-dwelling older adults: A systematic review of longitudinal studies. PLoS One. 2017; 12:e0178383. https://doi.org/10.1371/journal.pone.0178383 [PubMed]
- 32. Zhang YB, Pan XF, Chen J, Cao A, Xia L, Zhang Y, Wang J, Li H, Liu G, Pan A. Combined lifestyle factors, all-cause mortality and cardiovascular disease: a systematic review and meta-analysis of prospective cohort studies. J Epidemiol Community Health. 2021; 75:92–9. https://doi.org/10.1136/jech-2020-214050 [PubMed]
- 33. Rodriguez-Mañas L, Rodríguez-Artalejo F, Sinclair AJ. The Third Transition: The Clinical Evolution Oriented to the Contemporary Older Patient. J Am Med Dir Assoc. 2017; 18:8–9. https://doi.org/10.1016/j.jamda.2016.10.005 [PubMed]
- 34. Ferrucci L, Cooper R, Shardell M, Simonsick EM, Schrack JA, Kuh D. Age-Related Change in Mobility: Perspectives From Life Course Epidemiology and Geroscience. J Gerontol A Biol Sci Med Sci. 2016; 71:1184–94. https://doi.org/10.1093/gerona/glw043 [PubMed]
- 35. Studenski S, Perera S, Patel K, Rosano C, Faulkner K, Inzitari M, Brach J, Chandler J, Cawthon P, Connor EB, Nevitt M, Visser M, Kritchevsky S, et al. Gait speed and survival in older adults. JAMA. 2011; 305:50–8. https://doi.org/10.1001/jama.2010.1923 [PubMed]
- 36. Fraser GE, Yan R, Butler TL, Jaceldo-Siegl K, Beeson WL, Chan J. Missing data in a long food frequency questionnaire: are imputed zeroes correct? Epidemiology. 2009; 20:289–94. https://doi.org/10.1097/EDE.0b013e31819642c4 [PubMed]
- 37. Shakersain B, Rizzuto D, Larsson SC, Faxén-Irving G, Fratiglioni L, Xu WL. The Nordic Prudent Diet Reduces Risk of Cognitive Decline in the Swedish Older Adults: A Population-Based Cohort Study. Nutrients. 2018; 10:229. https://doi.org/10.3390/nu10020229 [PubMed]
- 38. Trichopoulou A, Orfanos P, Norat T, Bueno-de-Mesquita B, Ocké MC, Peeters PH, van der Schouw YT, Boeing H, Hoffmann K, Boffetta P, Nagel G, Masala G, Krogh V, et al. Modified Mediterranean diet and survival: EPIC-elderly prospective cohort study. BMJ. 2005; 330:991. https://doi.org/10.1136/bmj.38415.644155.8F [PubMed]
- 39. Willett WC, Howe GR, Kushi LH. Adjustment for total energy intake in epidemiologic studies. Am J Clin Nutr. 1997; 65:1220S–8S. https://doi.org/10.1093/ajcn/65.4.1220S [PubMed]
- 40. Köhncke Y, Laukka EJ, Brehmer Y, Kalpouzos G, Li TQ, Fratiglioni L, Bäckman L, Lövdén M. Three-year changes in leisure activities are associated with concurrent changes in white matter microstructure and perceptual speed in individuals aged 80 years and older. Neurobiol Aging. 2016; 41:173–86. https://doi.org/10.1016/j.neurobiolaging.2016.02.013 [PubMed]
- 41. Straatmann VS, Dekhtyar S, Meinow B, Fratiglioni L, Calderón-Larrañaga A. Unplanned Hospital Care Use in Older Adults: The Role of Psychological and Social Well-Being. J Am Geriatr Soc. 2020; 68:272–80. https://doi.org/10.1111/jgs.16313 [PubMed]
- 42. Calderón-Larrañaga A, Vetrano DL, Onder G, Gimeno-Feliu LA, Coscollar-Santaliestra C, Carfí A, Pisciotta MS, Angleman S, Melis RJ, Santoni G, Mangialasche F, Rizzuto D, Welmer AK, et al. Assessing and Measuring Chronic Multimorbidity in the Older Population: A Proposal for Its Operationalization. J Gerontol A Biol Sci Med Sci. 2017; 72:1417–23. https://doi.org/10.1093/gerona/glw233 [PubMed]
- 43. Rennemark M, Berggren T. Relationships between work-status and leisure lifestyle at the age of 60 years old. Eur J Ageing. 2006; 3:82–8. https://doi.org/10.1007/s10433-006-0029-x [PubMed]
- 44. Hagenaars JA, McCutcheon AL, Eds., Applied Latent Class Analysis. Cambridge University Press. 2002.
- 45. Li Y, Pan A, Wang DD, Liu X, Dhana K, Franco OH, Kaptoge S, Di Angelantonio E, Stampfer M, Willett WC, Hu FB. Impact of Healthy Lifestyle Factors on Life Expectancies in the US Population. Circulation. 2018; 138:345–55. https://doi.org/10.1161/CIRCULATIONAHA.117.032047 [PubMed]
- 46. Nyberg ST, Singh-Manoux A, Pentti J, Madsen IE, Sabia S, Alfredsson L, Bjorner JB, Borritz M, Burr H, Goldberg M, Heikkilä K, Jokela M, Knutsson A, et al. Association of Healthy Lifestyle With Years Lived Without Major Chronic Diseases. JAMA Intern Med. 2020; 180:760–8. https://doi.org/10.1001/jamainternmed.2020.0618 [PubMed]
- 47. Zhang S, Tomata Y, Discacciati A, Otsuka T, Sugawara Y, Tanji F, Tsuji I. Combined Healthy Lifestyle Behaviors and Disability-Free Survival: the Ohsaki Cohort 2006 Study. J Gen Intern Med. 2019; 34:1724–9. https://doi.org/10.1007/s11606-019-05061-z [PubMed]
- 48. Zaninotto P, Head J, Steptoe A. Behavioural risk factors and healthy life expectancy: evidence from two longitudinal studies of ageing in England and the US. Sci Rep. 2020; 10:6955. https://doi.org/10.1038/s41598-020-63843-6 [PubMed]
- 49. Fastame MC, Hitchcott PK, Mulas I, Ruiu M, Penna MP. Resilience in Elders of the Sardinian Blue Zone: An Explorative Study. Behav Sci (Basel). 2018; 8:30. https://doi.org/10.3390/bs8030030 [PubMed]
- 50. Li D, Jia Y, Yu J, Liu Y, Li F, Liu Y, Wu Q, Liao X, Zeng Z, Zeng R, Wan Z. Adherence to Healthy Lifestyle and the Risk of Function Limitations in Late Life: The Atherosclerosis Risk in Communities Study. Front Aging Neurosci. 2021; 13:698699. https://doi.org/10.3389/fnagi.2021.698699 [PubMed]
- 51. Jacob ME, Yee LM, Diehr PH, Arnold AM, Thielke SM, Chaves PH, Gobbo LD, Hirsch C, Siscovick D, Newman AB. Can a Healthy Lifestyle Compress the Disabled Period in Older Adults? J Am Geriatr Soc. 2016; 64:1952–61. https://doi.org/10.1111/jgs.14314 [PubMed]
- 52. Whitty E, Mansour H, Aguirre E, Palomo M, Charlesworth G, Ramjee S, Poppe M, Brodaty H, Kales HC, Morgan-Trimmer S, Nyman SR, Lang I, Walters K, et al. Efficacy of lifestyle and psychosocial interventions in reducing cognitive decline in older people: Systematic review. Ageing Res Rev. 2020; 62:101113. https://doi.org/10.1016/j.arr.2020.101113 [PubMed]
- 53. Dedeyne L, Deschodt M, Verschueren S, Tournoy J, Gielen E. Effects of multi-domain interventions in (pre)frail elderly on frailty, functional, and cognitive status: a systematic review. Clin Interv Aging. 2017; 12:873–96. https://doi.org/10.2147/CIA.S130794 [PubMed]
- 54. Daniels R, van Rossum E, de Witte L, Kempen GI, van den Heuvel W. Interventions to prevent disability in frail community-dwelling elderly: a systematic review. BMC Health Serv Res. 2008; 8:278. https://doi.org/10.1186/1472-6963-8-278 [PubMed]
- 55. Frost R, Belk C, Jovicic A, Ricciardi F, Kharicha K, Gardner B, Iliffe S, Goodman C, Manthorpe J, Drennan VM, Walters K. Health promotion interventions for community-dwelling older people with mild or pre-frailty: a systematic review and meta-analysis. BMC Geriatr. 2017; 17:157. https://doi.org/10.1186/s12877-017-0547-8 [PubMed]
- 56. Owen R, Berry K, Brown LJ. Enhancing Older Adults’ Well-Being and Quality of Life through Purposeful Activity: A Systematic Review of Intervention Studies. Gerontologist. 2021. [Epub ahead of print]. https://doi.org/10.1093/geront/gnab017 [PubMed]