


Introduction
Pancreatic cancer is a deadly disease with almost the same mortality and morbidity [1, 2]. Pancreatic cancer is difficult to detect in most pancreatic cancer patients because it has no symptoms before it progresses to advanced stages [3, 4]. Almost 90% pancreatic malignancies are pancreatic ductal adenocarcinomas (PDAC) [5]. Patients with advanced pancreatic cancer are routinely treated with radiation and chemotherapy [6]. Despite decades of efforts to improve diagnostic techniques, surgery, radiation therapy and chemotherapy, the overall prognosis for PDAC patients remains poor [7, 8]. Gemcitabine is a deoxycytidine analog widely used for chemotherapy in various solid tumors [9–11], which has been a standard chemotherapy drug for pancreatic cancer patients in the past few decades [12]. Although gemcitabine can prolong the survival period of pancreatic cancer patients, the resistance of pancreatic cancer to gemcitabine hinders its efficacy, which makes pancreatic cancer more difficult to cure [13]. Generally, chemical resistance is divided into intrinsic resistance and acquired resistance [14, 15]. Intrinsic resistance occurs when the treatment is ineffective at the outset, and acquired resistance occurs after several rounds of treatment with anticancer drugs [16]. Nevertheless, neonatal or acquired resistance is the main reason of disease progression and a major obstacle that clinicians have to overcome [17]. Gemcitabine resistance may be mediated through several mechanisms such as the NF-kB pathway, histone deacetylation, heat shock proteins, fatty acid and sphingolipid metabolism, and pyruvate metabolism [13, 18]. However, there is still no effective strategy and target to reverse gemcitabine resistance. Therefore, the mechanism of gemcitabine resistance needs to be further elucidated to benefit more pancreatic cancer patients.
As is known to all, the Genomics of Drug Sensitivity in Cancer database (GDSC database) is the largest public resource for information on drug sensitivity and molecular markers of drug response in cancer cells [19]. The GDSC database collected data on the sensitivity and response of tumor cells to drugs. The variation of cancer genome will greatly affect the clinical therapeutic effect, and the response of different targets to drugs is also diverse. Therefore, GDSC database is very important for the discovery of potential tumor therapeutic targets. Additionally, The Cancer Genome Atlas database (TCGA database) represents a key milestone in the National Cancer Institute’s mission to reduce the burden of cancer suffering, which is not only rich in transcription data, but also has detailed clinical data and is a treasure trove of cancer researchers [20]. TCGA database is conducive to excavating the multi-omics data of various cancers and exploring the molecular mechanism of tumor occurrence and development.
In this study, we employed the drug sensitivity data in GDSC combined with TCGA database to identify Endoplasmic Reticulum Aminopeptidase 2 (ERAP2) as the key gene associated with cellular gemcitabine sensitivity and patient prognosis, providing a new option for adjuvant gemcitabine chemotherapy for pancreatic cancer.
Results
Drug sensitivity and transcripts in pancreatic cell lines
Firstly, we downloaded the sensitivity data of pancreatic cancer cell lines treated with gemcitabine from the public GDSC data, which included two data sets: GDSC1 and GDSC2. In this part, GDSC1 data set was adopted to screen genes related to gemcitabine sensitivity, which included IC50 values of 30 pancreatic cancer cells treated with gemcitabine (Table 1). Then, we conducted correlation analysis between gene expression value and IC50 value. We found that the IC50 of gemcitabine was positively relevant to 359 genes and negatively correlated with 456 genes (p < 0.05).
Table 1. IC50 values of pancreatic cancer cells treated with gemcitabine in GDSC1.
| CELL_LINE_NAME | DRUG_NAME | Log2_IC50 |
| AsPC-1 | Gemcitabine | 1.916122 |
| BxPC-3 | Gemcitabine | -5.32043 |
| CAPAN-1 | Gemcitabine | -6.23895 |
| CAPAN-2 | Gemcitabine | 1.773473 |
| CFPAC-1 | Gemcitabine | -8.24857 |
| DAN-G | Gemcitabine | 3.014603 |
| HPAC | Gemcitabine | -6.48888 |
| HPAF-II | Gemcitabine | -2.22445 |
| Hs-766T | Gemcitabine | 1.777713 |
| HuP-T3 | Gemcitabine | -3.30747 |
| HuP-T4 | Gemcitabine | -5.85751 |
| KP-1N | Gemcitabine | -4.74144 |
| KP-2 | Gemcitabine | -2.83739 |
| KP-4 | Gemcitabine | -6.09128 |
| MIA-PaCa-2 | Gemcitabine | -5.94014 |
| MZ1-PC | Gemcitabine | -1.67868 |
| PANC-02-03 | Gemcitabine | -1.38525 |
| PANC-03-27 | Gemcitabine | -7.23895 |
| PANC-04-03 | Gemcitabine | -1.63365 |
| PANC-08-13 | Gemcitabine | -0.71317 |
| PANC-10-05 | Gemcitabine | -5.53156 |
| PA-TU-8902 | Gemcitabine | -1.79899 |
| PA-TU-8988T | Gemcitabine | -6.14642 |
| PL18 | Gemcitabine | -5.27889 |
| PL4 | Gemcitabine | -2.83953 |
| PSN1 | Gemcitabine | -9.78819 |
| SU8686 | Gemcitabine | -4.39629 |
| SUIT-2 | Gemcitabine | -7.11558 |
| SW1990 | Gemcitabine | -3.4139 |
| YAPC | Gemcitabine | 4.533963 |
A multiple factors Cox proportional hazards regression model was established based on Lasso regression analysis
Next, we excluded OR2B2 for its barely expression, and finally 19 genes entered the variable selection of the model. Additionally, we utilized Lasso algorithm to screen out the independent variables. 1000 models were calculated by setting the parameter nlambda = 1000, and the coefficients of independent variables were obtained (Figure 1A). Besides, we filtered the lambda value (λ value) through 10-fold cross-validation, and obtained two models. It should be mentioned that one model was based on lambda.min (the error mean is the minimum corresponding lambda, dotted line on the left); the other was based on lambda.1se (the maximum lambda of the error mean within 1 standard deviation of the minimum value, dotted line on the right). As shown in Figure 1B, we adopted 9 genes as model variables for model construction. After determining the model variables, we employed the R package survival to construct the multi-factor Cox risk ratio model for these 9 genes, and identified the final model, which included the coefficients, risk values, and P values of each variable. Meanwhile, the coefficients of the best model of Lasso were also shown (Table 3). We adopted R package to plot the Forest plot of this model, and found that the P values of ERAP2 and DOCK11 were both less than 0.05, suggesting that they could be independent prognostic factors for pancreatic cancer patients treated with gemcitabine, respectively (Figure 1C). Moreover, we proved the Concordance Index of this model reaches 0.79, indicating that the model is accurate and reliable.
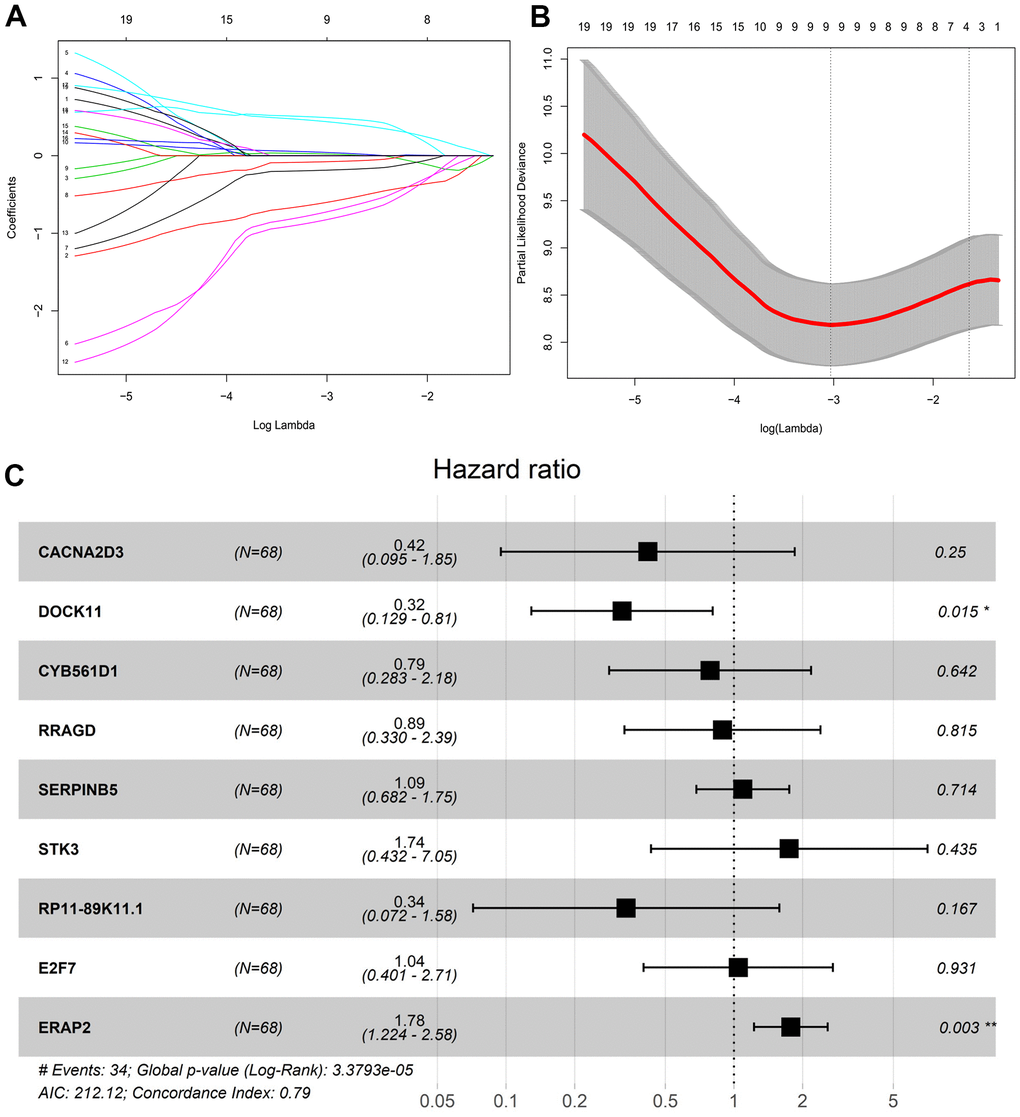
Figure 1. Lasso regression screening survival model variables. (A) Variable coefficient corresponding to the model with different number of variables. (B) 1000 models obtained through ten-fold cross validation. (C) Risk coefficient and P value of corresponding genes in multivariate Cox proportional risk regression model.
Table 3. Multivariate Cox proportional risk regression model.
| Symbol | coef | exp(coef) | z | Pr(>|z|) |
| CACNA2D3 | -0.87144 | 0.41835 | -1.15058 | 0.249905 |
| DOCK11 | -1.13124 | 0.322634 | -2.42187 | 0.015441 |
| CYB561D1 | -0.24186 | 0.785165 | -0.46466 | 0.642175 |
| RRAGD | -0.11797 | 0.888722 | -0.23356 | 0.81533 |
| SERPINB5 | 0.087906 | 1.091886 | 0.366625 | 0.713899 |
| STK3 | 0.556078 | 1.74382 | 0.780509 | 0.435092 |
| RP11-89K11.1 | -1.08972 | 0.33631 | -1.381 | 0.16728 |
| E2F7 | 0.042367 | 1.043277 | 0.086883 | 0.930765 |
| ERAP2 | 0.573894 | 1.775166 | 3.02303 | 0.002503 |
Risk factor association analysis
To further illustrate the validity of the Lasso-Cox regression model, we described the survival time and survival status of patients by a risk factor correlation diagram as their risk values changed. First of all, patients were assigned to high-risk group and low-risk group with cut off value equal to -0.3 (dotted line in the middle), which was calculated by Xtile software. We also mapped the distribution of survival time and status in pancreatic cancer patients based on the distribution of risk values. Patients in the high-risk group of the model group and the validation group showed shorter survival time and lower survival rates compared with the lower risk group (Figure 2A, 2B). We found ERAP2 and DOCK11 were important independent prognostic factors, and the relationship between their expression levels and risk values was also analyzed. As shown in the heat map, ERAP2 expression as a risk factor was higher in the high-risk group, while DOCK11 expression as a protective factor was lower in the low-risk group. The trend of model group and validation group is consistent, indicating a strong universality of the model (Figure 2C, 2D).
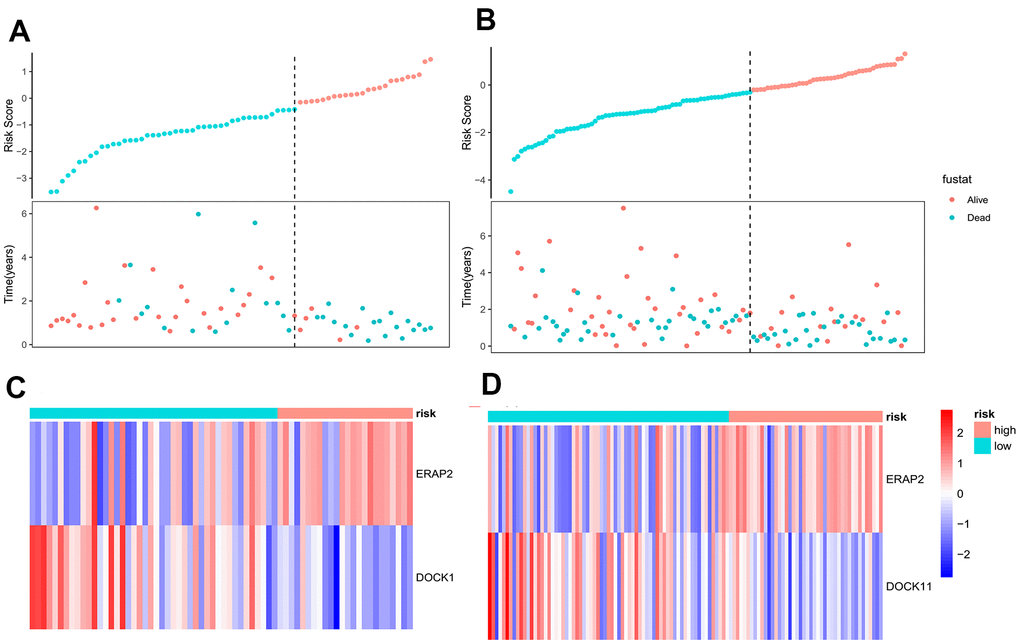
Figure 2. Correlation analysis of risk factors between model group and validation group. (A) The survival time and survival status of pancreatic cancer patients in the model group as a function of their risk values. (B) The survival time and survival status of pancreatic cancer patients in the validation group as a function of their risk values. (C) Heat map of gene expression as a function of risk values in the model group. (D) Heat map of gene expression as a function of risk values in the validation group.
Kaplan-Meier survival analysis based on risk score of pancreatic cancer patients
According to the variable coefficients of the optimal model of Lasso regression mentioned above (Table 3), the Lasso regression coefficients corresponding to 9 genes were obtained. Then we obtained the Risk Score of each pancreatic cancer patient according to the expression levels of 9 genes, and obtained the value of risk for 68 pancreatic cancer patients with gemcitabine treatment. After calculating the cut off value by Xtile software, patients with a risk value above -0.3 were considered to be in the high-risk group, while the rest were considered to be in the low-risk group. The corresponding Kaplan-Meier survival curve was shown in Figure 3A. At the same time, 113 pancreatic cancer patients without gemcitabine medication information were applied to validate the model. Similarly, the risk value of each patient was calculated by the expression levels of 9 genes, and the corresponding Kaplan-Meier survival curve was plotted (Figure 3B). It was obvious that the prognosis of low-risk patients in the model group (n = 68) and validation group (n = 113) was better than that of high-risk patients. We further draw the ROC curves of the prediction results of the model group and the validation group, and the 1-, 3- and 5-year ROC curves of pancreatic cancer patients, respectively. In the model group, the 1-, 3- and 5-year AUC area was 0.83, 0.83, and 0.76, respectively, indicating the good predictive ability on the survival of pancreatic cancer patients treated with gemcitabine of the model, and we observed that the Lasso-Cox regression model composed of these 9 genes had a very high accuracy (Figure 3C). In the validation group, the 1-, 3- and 5-year AUC areas were 0.6, 0.7 and 0.68, respectively. In the case of using external data, the model still maintained a high accuracy, indicating that the Lasso-Cox regression model constituted by these 9 genes had good universality (Figure 3D).
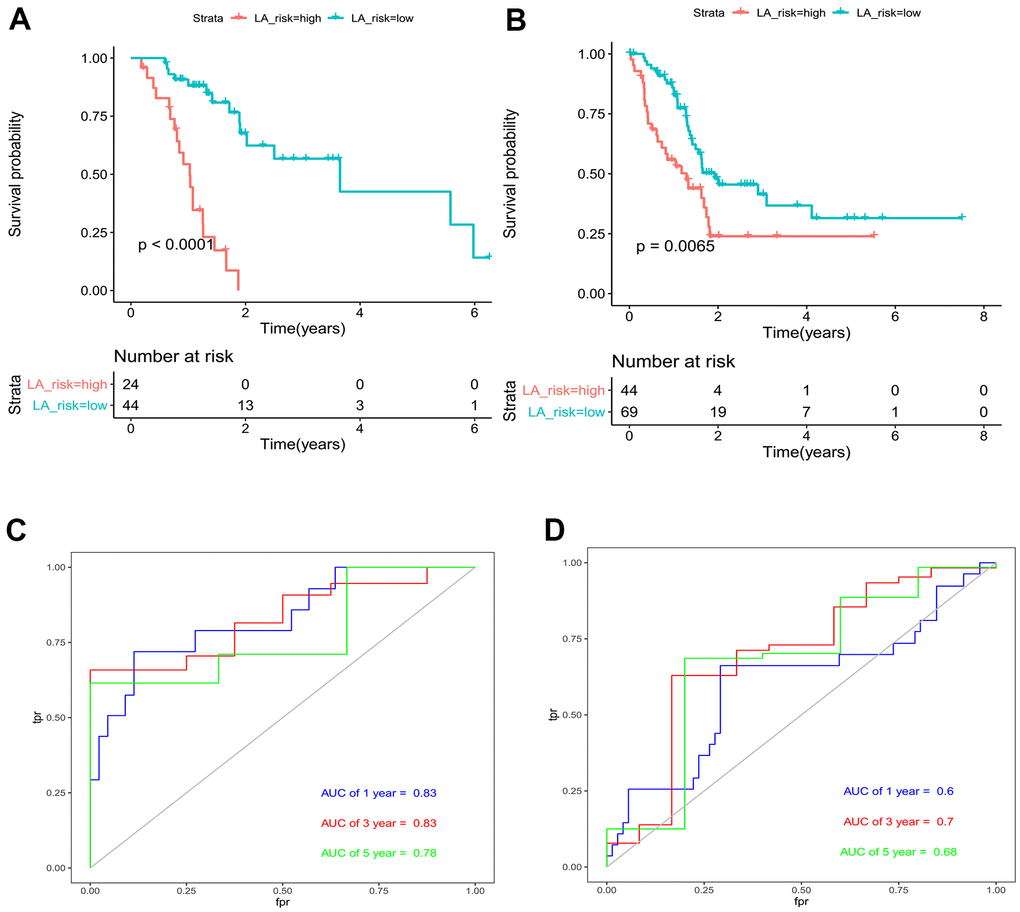
Figure 3. Evaluation and validation of Lasso-Cox regression model for pancreatic cancer. (A) Risk-based Kaplan-Meier survival curve for 68 pancreatic cancer patients treated with gemcitabine. (B) Risk-value Kaplan-Meier survival curve for 113 pancreatic cancer patients with no medication information. (C) AUC area of pancreatic cancer patients in the model group at 1, 3 and 5 years. (D) AUC area of pancreatic cancer patients in the validation group at 1, 3 and 5 years.
The expression of ERAP2 was associated with gemcitabine sensitivity and response
From the above Cox proportional risk regression model, we identified two genes, ERAP2 and DOCK11, associated with gemcitabine sensitivity. As a risk factor, ERAP2 expression is positively relevant to the risk value of pancreatic cancer patients, and is more suitable as a target for further research. First, we analyzed the relationship between ERAP2 expression and gemcitabine IC50 in pancreatic cancer cells in the GDSC1 and GDSC2 datasets. In GDSC1, the correlation between ERAP2 and gemcitabine log2 (IC50) value reached 0.5. In GDSC2, the correlation between ERAP2 and gemcitabine log2 (IC50) value also reached 0.47 (Figure 4A). In addition, we downloaded the expression chip GSE78982 of pancreatic cancer fibroblast from the GEO database, and analyzed the data by the GEO2R online tool. ERAP2 expression was significantly up-regulated in the gemcitabine resistant group, with differential multiple LogFc value of 1.19 and p-value of 0.0075 (Figure 4B). More importantly, we screened gemcitabine treated patients in the TCA-PAAD pancreatic cancer data set and measured their treatment efficacy, and found significantly lower ERAP2 expression values in the effective group (PR/CR) than in the ineffective group (PD) (Figure 4C). These results suggested that ERAP2 expression was significantly related to gemcitabine sensitivity in pancreatic cancer.
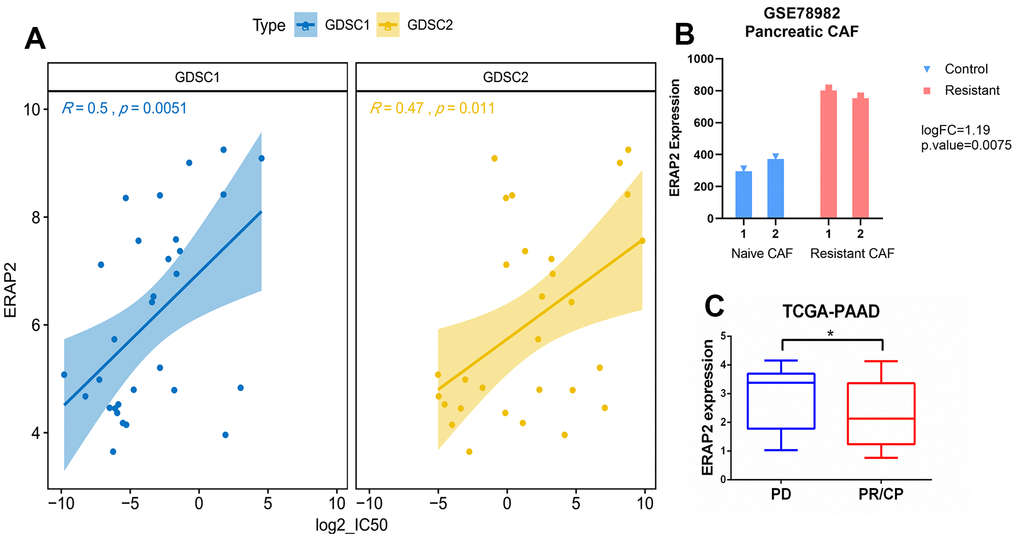
Figure 4. Relationship between expression of ERAP2 and sensitivity to gemcitabine in pancreatic cancer. (A) Correlation between the expression value of ERAP2 in GDSC1 and GDSC2 pancreatic cancer cell lines and the IC50 value of gemcitabine. (B) Expression of ERAP2 in two types of pancreatic cancer fibroblasts. (C) Relationship between the effect of gemcitabine treatment and ERAP2 expression in TCGA pancreatic cancer patients.
ERAP2 promoted pancreatic cancer progression
The above findings show that ERAP2 is a key gene affecting gemcitabine resistance in patients with pancreatic cancer, which enable us to further study whether there is a relationship between ERAP2 and the diagnosis and prognosis of pancreatic cancer. We downloaded the expression microarray GSE62452 from GEO database of pancreatic tumors and paracancerous tumors, and found that ERAP2 was highly expressed in pancreatic tumors (Figure 5A). In addition, ERAP2 was also significantly overexpressed in blood extracellular vesicle samples of pancreatic cancer patients from the BBCancer database (Figure 5B). Next, we analyzed the ERAP2 expression in pancreatic cancer by the GEPIA database and found that ERAP2 was significantly overexpressed in pancreatic cancer samples, which further demonstrated the cancer-promoting effect of ERAP2 (Figure 5C). In addition, we performed a Kaplan-Meier survival analysis in the TCGA pancreatic cancer dataset, using the median expression of ERAP2 as the threshold. The results are consistent with previous analysis, indicating that high ERAP2 expression is a risk factor for poor prognosis (Figure 5D), while DOCK11 failed to differentiate patient prognosis (Supplementary Figure 1). Finally, we adopted the immunohistochemical data of pancreatic tissues and pancreatic tumors in ProteinAtlas database to verify the expression of the protein level of ERAP2, and further confirmed the high expression of ERAP2 in pancreatic tumor (Figure 5E). The above results suggest that ERAP2 is overexpressed in pancreatic cancer, resulting in a poor prognosis.
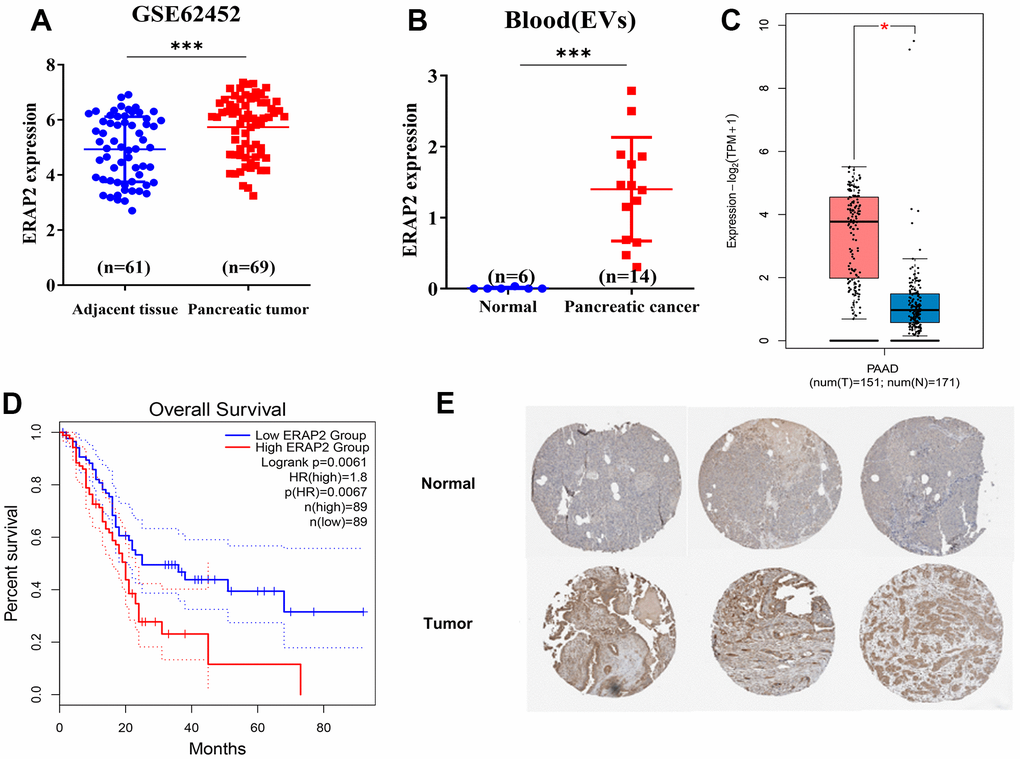
Figure 5. Expression and prognosis of ERAP2 in pancreatic cancer. (A) Expression of ERAP2 in GSE45452 chip pancreatic tumor and paracancerous tumor. (B) The expression of ERAP2 in extracellular vesicles of blood origin. (C) Expression of ERAP2 in the pancreatic cancer dataset from GEPIA database. (D) Kaplan-Meier survival curve of ERAP2 in pancreatic cancer data set from GEPIA database. (E) Immunohistochemical images of ERAP2 in pancreatic tissues and pancreatic tumors from ProteinAtlas database.
Expression of ERAP2 was positively correlated with gemcitabine resistance
Next, we examined the viability of BxPC-3 and PANC-1 cells exposed to gemcitabine for 0, 24, 48 and 72 h. We discovered that gemcitabine reduced the proliferation of BxPC-3 and PANC-1 cells with IC50 of 10.49 μM and 17.7 μM (72 h) (Figure 6A). We then examined the ERAP2 levels in pancreatic cancer cell lines with gemcitabine treatment. As shown in Figure 6B, 6C, ERAP2 expression and transcription level were significantly increased after gemcitabine treatment. We conclude that ERAP2 expression may play an important role in the sensitivity of pancreatic cancer cells to gemcitabine.
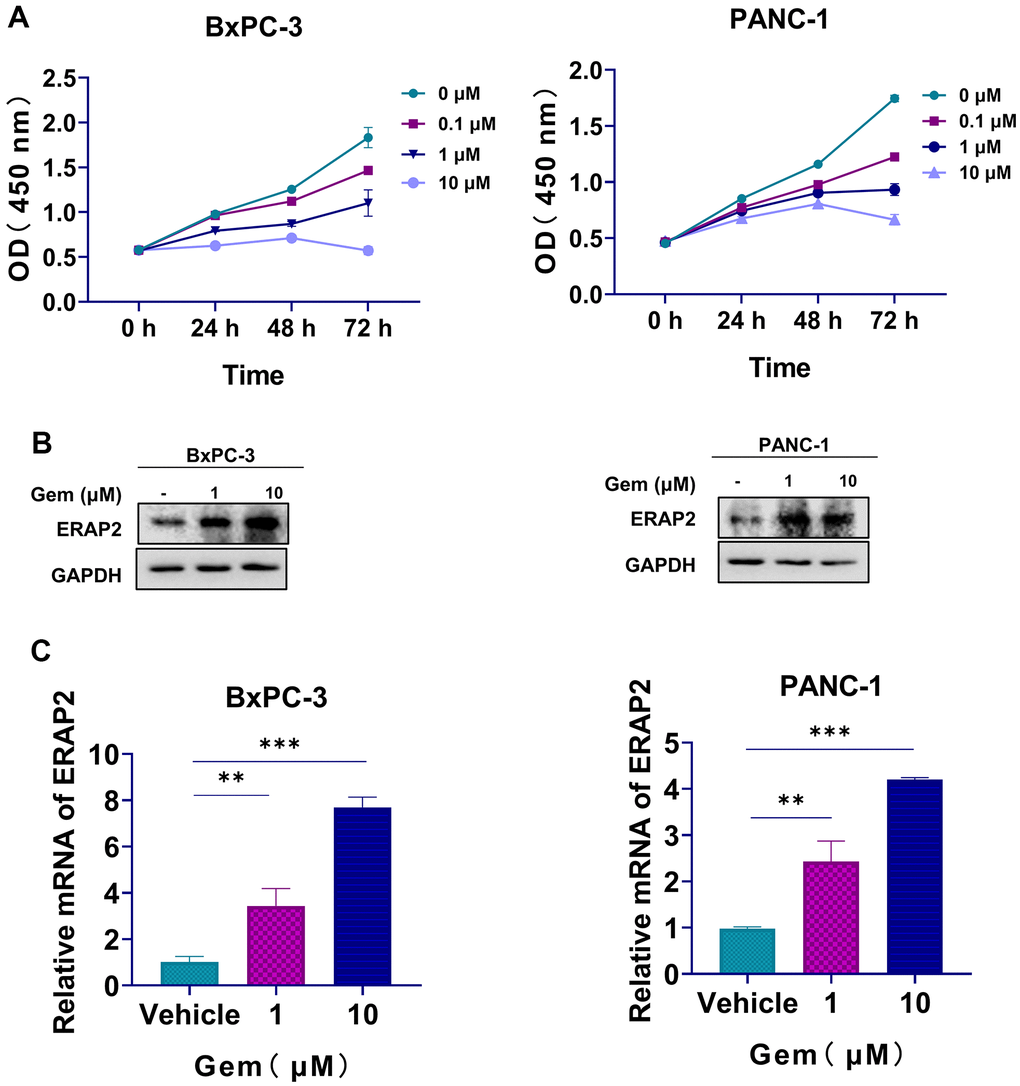
Figure 6. The relationship between ERAP2 expression and gemcitabine resistance. (A) Cell viability assay in BxPC-3 and PANC-1cell lines treated with gemcitabine. (B) The Protein levels of ERAP2 in BxPC-3 and PANC-1 cell lines treated with gemcitabine were assessed by western blot. (C) The mRNA levels of ERAP2 in BxPC-3 and PANC-1cell lines treated with gemcitabine were quantified by qRT-PCR. Data were shown as the mean ± SD of three independent experiments (*p < 0.05, **p < 0.01 and ***p < 0.001).
Inhibition of ERAP2 attenuated the tumorigenesis and increased sensitivity to gemcitabine of pancreatic cancer cells
We next identified the tumorigenesis and sensitivity of pancreatic cancer cells to gemcitabine after ERAP2 knockdown. It was indicated that ERAP2 knockdown significantly restrained the growth of pancreatic cancer cells (Figure 7A, 7B). Interestingly, ERAP2 knockdown also significantly increased sensitivity to gemcitabine in these two pancreatic cancer cell lines (Figure 7A, 7B). We also tested the effects of ERAP2 on cell migration and invasion by wound healing assay and Transwell invasion assay. As suggested in Figure 7C, 7D, knockdown of ERAP2 remarkably attenuated the migration ability of pancreatic cancer cell lines, and the invasion ability of pancreatic cancer cell lines was also inhibited. Compared with gemcitabine alone, knockdown ERAP2 combined with gemcitabine further reduced the migration ability of pancreatic cancer cells, and the invasion ability was more significantly inhibited (Figure 7C, 7D). Overall, our results suggest that down-regulation of ERAP2 significantly blocks the tumorigenic ability of pancreatic cancer cells and significantly enhances the anti-pancreatic cancer activity of gemcitabine.
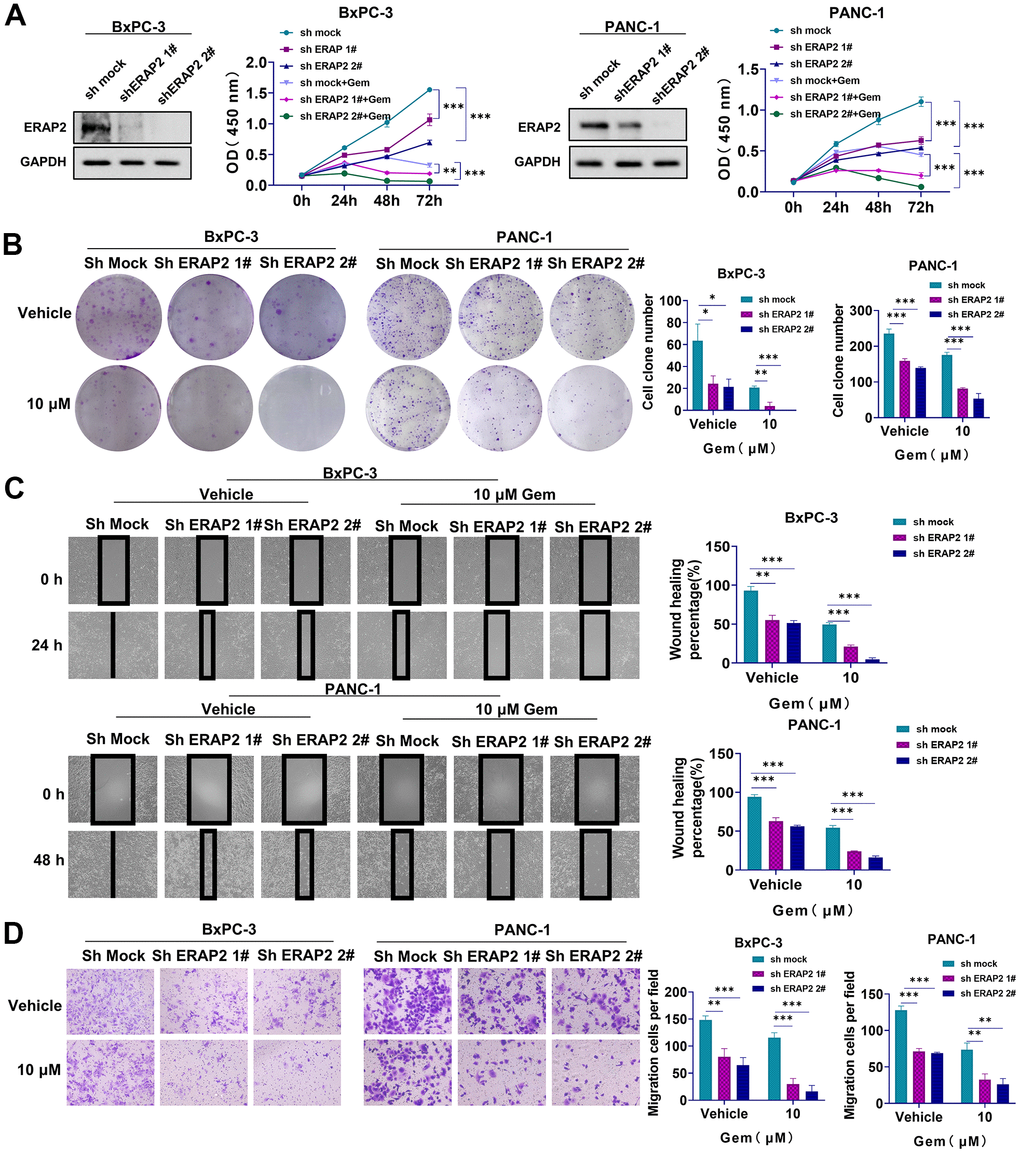
Figure 7. Effect of ERAP2 knockdown on tumorigenesis and gemcitabine sensitivity in pancreatic cancer cell lines. (A) Cell viability assay in two pancreatic cancer cell lines treated with ERAP2 knockdown, gemcitabine alone or gemcitabine with ERAP2 knockdown. (B) Cell proliferation assay in two pancreatic cancer cell lines treated with ERAP2 knockdown, gemcitabine alone or gemcitabine with ERAP2 knockdown. (C) Wound healing assay in two pancreatic cancer cell lines treated with ERAP2 knockdown, gemcitabine alone or gemcitabine with ERAP2 knockdown. (D) Transwell invasion assay in two pancreatic cancer cell lines treated with ERAP2 knockdown, gemcitabine alone or gemcitabine with ERAP2 knockdown. Data were shown as the mean ± SEM of three independent experiments (*p < 0.05, **p < 0.01 and ***p < 0.001).
Discussion
Gemcitabine is a first-line drug in the treatment of pancreatic cancer, but its efficacy is limited due to various factors, such as sun exposure, mutations, and overinsurance [3, 21, 22]. Hence, exploring the mechanisms of gemcitabine resistance is critical to enhance the prognosis of patients with this cancer. We firstly screened out 359 positively and 456 negatively genes that were significantly associated with IC50 values from drug sensitivity data in GDSC, and then performed functional annotation analysis on them. At the same time, we selected 68 patients with pancreatic cancer who received gemcitabine in the TCGA database and performed Cox survival analysis on originally selected drug-sensitive genes. We discovered that ERAP2 and DOCK11 were both related to gemcitabine resistance. Interestingly, ERAP2 promoted gemcitabine resistance, and high ERAP2 expression is a risk factor for poor prognosis. Unfortunately, DOCK11 failed to differentiate patient prognosis.
ERAP2 has previously been considered a homologue of placental leucine aminopeptidase/insulin-regulated aminopeptidase [23–25], but its function has not been thoroughly studied. Recent studies report that ERAP2 is an oncogenic gene, overexpressed in variant cancers, such as glioblastoma, choriocarcinoma and oral cavity squamous cell carcinoma (OSCC) [26–29]. ERAP2 overexpression has been reported to benefit cervical metastasis, resulting in a poor prognosis of OSCC [30]. Meanwhile, ERAP2 promotes tumor immune escape by helping to generate peptide ligands for MHC presentation [31, 32]. Given the importance of ERAP2 in immune evasion of cancer, potential clinical applications of its inhibitors have great prospects in tumor immunotherapy [33]. Inhibition of ERAP2 activity may be an effective method to improve tumor antigenicity, but the specific mechanisms need to be further elucidated. Similarly, we found that ERAP2 also closely relevant to the survival of pancreatic cancer patients. To our knowledge, the area of ERAP2 in gemcitabine drug resistance has never been set foot in. We found that gemcitabine treatment promoted ERAP2 expression, indicating that ERAP2 was involved in gemcitabine resistance. Furthermore, we demonstrated that knockdown of ERAP2 significantly improved the killing effect of gemcitabine on pancreatic cancer cells. Our data showed that ERAP2 played a role the classic PI3K/AKT/mTOR pathway of drug resistance through KEGG pathway analysis (Supplementary Figure 2A and Supplementary Table 1), which was further confirmed by the GEPIA analysis tool (Supplementary Figure 2B, 2C). Additionally, ERAP2 showed a significant down-regulation when mTOR was suppressed in the Connectivity Map tool in the IPA software (Supplementary Figure 2D).
The PI3K/AKT/mTOR signaling pathway is critical in cell physiology and regulates cell growth, survival, metastasis and metabolism by responding to many extracellular stimuli [34–37]. mTOR was reported to mediate drug resistance when activated in diverse tumor. For instance, mTOR activation was reported to promote lapatinib resistance in breast cancers [38]; mTOR modulates gemcitabine resistance in lung cancer through mTORC2 [39]. In pancreatic cancer, activating mTOR can promote glycolysis and reduce gemcitabine sensitivity [40]. At present, mTOR inhibitors such as rapamycin and temsirolimus have been approved for clinical use, and novel mTOR inhibitors are also in clinical research. As a downstream molecule of mTOR, ERAP2 inhibition may have better potential for pancreatic cancer treatment and blockade of gemcitabine resistance. The development of ERAP2 inhibitors will further expand the therapeutic options for pancreatic cancer, and provide strategies for gemcitabine combination therapy.
In summary, we found that ERAP2, a previously unreported biomarker, predicts sensitivity to gemcitabine in patients with pancreatic cancer, possibly acting in part through the PI3K/AKT/mTOR signaling pathway. In clinical treatment, it is reasonable to consider that gemcitabine combined with ERAP2 inhibitor may improve the sensitivity of pancreatic cancer patients to gemcitabine.
Materials and Methods
Construction of drug-sensitive prognosis model
To further screen out key genes, PAAD transcript and clinical data were collected from the TCGA database for subsequent analysis through the UCSC Xena browser (http://xena.ucsc.edu), and we totally obtained 68 pancreatic cancer patients who received gemcitabine. Finally, 815 candidate genes were analyzed by univariate Cox analysis (359 + 456), and the top 20 genes were taken into the Lasso algorithm to create the final multivariate Cox model. Additionally, we included other 113 pancreatic cancer patients as validation set. The R package glmnet (version 2.0.18) and ggrisk (version 1.2) were used for visualization of these results. The cut off value of risk score was obtained by Xtile software (version 3.6.1).
Functional annotation and pathway analysis
To investigate a comprehensive set of functionally annotated hub genes, David online analysis tool was utilized to carry out GO function annotation and KEGG pathway analysis on 359 positive correlation genes and 456 negative correlation genes, respectively (https://david.ncifcrf.gov). The regulatory network of ERAP2 is constructed using IPA software.
The analysis of expression and prognosis
The GEPIA2 online tool (http://gepia2.cancer-pku.cn) was used to analyze the expression and prognosis of the target gene, and the protein level of the gene was further verified in The Human protein atlas database (https://www.proteinatlas.org).
Cell culture
Pancreatic cancer cell lines PANC-1 and BxPC-3 were grown in Dulbecco's modified Eagle (DMEM, Gibco) with the addition of 10% fetal bovine serum (FBS; ExCell Bio).
Reagents
Gemcitabine was purchased from Selleck. Anti-GAPDH (1:5000) and ERAP2 (1:1000) antibodies were purchased from Proteintech.
shRNA transfection
6-well plates were inoculated with PANC-1 and BxPC-3 cells. Add 1 mL of lentiviral supernatant containing sh-ERAP2 (Genechem) lentiviral construct or control vector and 1 mL DMEM media with10% FBS to cells when the cell concentration reaches 50%-60%. Two days after infection, 2 μg/mL puromycin was utilized to screen cells that had been successfully infected. Two days later, the inhibition of ERAP2 was investigated by western blot.
Cell viability assay
The cells were evenly plated in a 96-well culture plate with 5000 cells per well. The cells were treated with 0, 0.1, 1 and 10 μM gemcitabine on the second day. The cytotoxicity of gemcitabine was determined at 0, 24, 48 and 72 h, respectively. 10 μL CCK-8 reagent (Biotool) was supplemented to each well, and the absorbance was determined at 450 nm after incubation at 37° C for 2 h.
Quantitative real-time PCR
Total RNA was extracted with MgZol reagent (Magen) according to the instructions. Quantitative real-time PCR was conduct to detect the mRNA level of ERAP2. Primers were designed and synthesized by Sangon Biotech. The primer sequences:
ERAP2:
Forward 5’- GAGGCGGAGTCTTGCTCTGTTG-3’
Reverse 5’- GAGGCAGGAGAATGGCGTGAAC-3’
Western blot
Cells were washed twice with PBS and collected. The mixture of RIPA buffer (Beyotime) and protease inhibitor (Bimake) was added. The cells were lysed for 30 min and the supernatant was collected by centrifugation. Protein concentration was determined by BCA protein assay kit (Beyotime). Protein was isolated with 10% SDS-PAGE and transferred to PVDF membrane after sufficient protein separation. The PVDF membrane was sealed with 5% skim milk at room temperature for 1 h, cleaned with PBS for 15min, and incubated overnight with primary antibody at 4° C. Subsequently, the PVDF membrane was incubated with secondary antibody at room temperature for 1 h. After cleaning with PBS for 30 min, ECL reagent was used for chemiluminescence detection.
Colony formation assay
Cells were seeded in 6-well culture plates with 1,000 cells per well. On the second day, cells were treated with 0, 0.1, 1, and 10 μM gemcitabine, respectively. After 24 h, the fresh medium was replaced. The fresh medium was replaced every 3 days thereafter. The cell status was observed after 10-14 days, and the medium was discarded after the cells formed suitable clones. After washed with PBS 2 times, the cells were fixed by 500 μL paraformaldehyde. After 15 min, paraformaldehyde was discarded. After washed with PBS 2 times, the cells were stained by 500 μL crystal violet. After 10 min, crystal violet was discarded. After washed with PBS 2 times, colonies were counted after the six-well plate becomes dry.
Wound healing assay
Cells were plated in 6-well plates until the density reached 80%-100%. The cells were scratched using a sterile 200μL spear tip. Wash the cells gently with PBS three times without breaking the drawn lines. Then 10 μM gemcitabine was added and cell microscope images were taken at 0, 24 and 48 h. Three different areas were selected from each well and the ability of cells to migrate was assessed according to the degree of healing.
Cell invasion assay
Cells invasion ability were evaluated using 24-well chemotaxis chambers (Costar, #3422). After pretreatment at 37° C for 12 h with a mixture of 60 ul serum-free medium (7): Matrigel (1) in the upper chamber, cells (50000 cells/well) suspended on 100 μL serum-free medium were added, followed by 500 μL culture base containing 30% FBS in the lower chamber. 24 h later, after washed with PBS 2 times, the cells were fixed by 500 μL paraformaldehyde. After 15 min, paraformaldehyde was discarded. After washed with PBS 2 times, the cells were stained by 500 μL crystal violet. After 10 min, crystal violet was discarded. After washed with PBS 2 times, photographed and counted.
Data analysis
Data were statistically analyzed by the unpaired two-tailed Student’s t-test of Graphpad Prism software (version 8.0), and P < 0.05 was considered as statistically significant difference between groups.
Author Contributions
PY, SL, CP and JL conceived and designed the study. PY and SL contributed to carry out the experiments. PY, SL and JC analyzed the data. PY and SL wrote the manuscript. CP and PY contributed funding. All authors read and approved the final manuscript.
Conflicts of Interest
The authors declare that they have no conflicts of interest.
Funding
This work was supported by National Natural Science, Grant No. 82073458, the Science and Technology Innovation Program of Hunan Province (2021RC4013), and the Science and Technology Innovation Program of Hunan Province (CX20200387, 2020ZZTS258).
References
- 1. Hackert T, Niesen W, Hinz U, Tjaden C, Strobel O, Ulrich A, Michalski CW, Büchler MW. Radical surgery of oligometastatic pancreatic cancer. Eur J Surg Oncol. 2017; 43:358–63. https://doi.org/10.1016/j.ejso.2016.10.023 [PubMed]
- 2. Park W, Chawla A, O’Reilly EM. Pancreatic Cancer: A Review. JAMA. 2021; 326:851–62. https://doi.org/10.1001/jama.2021.13027 [PubMed]
- 3. Mizrahi JD, Surana R, Valle JW, Shroff RT. Pancreatic cancer. Lancet. 2020; 395:2008–20. https://doi.org/10.1016/S0140-6736(20)30974-0 [PubMed]
- 4. Zeng S, Pöttler M, Lan B, Grützmann R, Pilarsky C, Yang H. Chemoresistance in Pancreatic Cancer. Int J Mol Sci. 2019; 20:4504. https://doi.org/10.3390/ijms20184504 [PubMed]
- 5. Xu Y, Wang Y, Höti N, Clark DJ, Chen SY, Zhang H. The next “sweet” spot for pancreatic ductal adenocarcinoma: Glycoprotein for early detection. Mass Spectrom Rev. 2021. [Epub ahead of print]. https://doi.org/10.1002/mas.21748 [PubMed]
- 6. Haller DG. New perspectives in the management of pancreas cancer. Semin Oncol. 2003; 30:3–10. https://doi.org/10.1016/s0093-7754(03)00296-3 [PubMed]
- 7. Zijlstra M, Bernards N, de Hingh IH, van de Wouw AJ, Goey SH, Jacobs EM, Lemmens VE, Creemers GJ. Does long-term survival exist in pancreatic adenocarcinoma? Acta Oncol. 2016; 55:259–64. https://doi.org/10.3109/0284186X.2015.1096020 [PubMed]
- 8. Siegel RL, Miller KD, Jemal A. Cancer statistics, 2018. CA Cancer J Clin. 2018; 68:7–30. https://doi.org/10.3322/caac.21442 [PubMed]
- 9. Wong A, Soo RA, Yong WP, Innocenti F. Clinical pharmacology and pharmacogenetics of gemcitabine. Drug Metab Rev. 2009; 41:77–88. https://doi.org/10.1080/03602530902741828 [PubMed]
- 10. Ciccolini J, Serdjebi C, Peters GJ, Giovannetti E. Pharmacokinetics and pharmacogenetics of Gemcitabine as a mainstay in adult and pediatric oncology: an EORTC-PAMM perspective. Cancer Chemother Pharmacol. 2016; 78:1–12. https://doi.org/10.1007/s00280-016-3003-0 [PubMed]
- 11. Vivaldi C, Crucitta S, Catanese S, Cucchiara F, Arrigoni E, Pecora I, Rofi E, Fornaro L, Salani F, Massa V, Vasile E, Morganti R, Danesi R, Del Re M. Comprehensive pharmacogenetic analysis of DPYD, UGT, CDA, and ABCB1 polymorphisms in pancreatic cancer patients receiving mFOLFIRINOX or gemcitabine plus nab-paclitaxel. Pharmacogenomics J. 2021; 21:233–42. https://doi.org/10.1038/s41397-020-00203-7 [PubMed]
- 12. Burris HA 3rd, Moore MJ, Andersen J, Green MR, Rothenberg ML, Modiano MR, Cripps MC, Portenoy RK, Storniolo AM, Tarassoff P, Nelson R, Dorr FA, Stephens CD, Von Hoff DD. Improvements in survival and clinical benefit with gemcitabine as first-line therapy for patients with advanced pancreas cancer: a randomized trial. J Clin Oncol. 1997; 15:2403–13. https://doi.org/10.1200/JCO.1997.15.6.2403 [PubMed]
- 13. Binenbaum Y, Na’ara S, Gil Z. Gemcitabine resistance in pancreatic ductal adenocarcinoma. Drug Resist Updat. 2015; 23:55–68. https://doi.org/10.1016/j.drup.2015.10.002 [PubMed]
- 14. Sarvepalli D, Rashid MU, Rahman AU, Ullah W, Hussain I, Hasan B, Jehanzeb S, Khan AK, Jain AG, Khetpal N, Ahmad S. Gemcitabine: A Review of Chemoresistance in Pancreatic Cancer. Crit Rev Oncog. 2019; 24:199–212. https://doi.org/10.1615/CritRevOncog.2019031641 [PubMed]
- 15. Amrutkar M, Gladhaug IP. Pancreatic Cancer Chemoresistance to Gemcitabine. Cancers (Basel). 2017; 9:157. https://doi.org/10.3390/cancers9110157 [PubMed]
- 16. El Maalouf G, Le Tourneau C, Batty GN, Faivre S, Raymond E. Markers involved in resistance to cytotoxics and targeted therapeutics in pancreatic cancer. Cancer Treat Rev. 2009; 35:167–74. https://doi.org/10.1016/j.ctrv.2008.10.002 [PubMed]
- 17. Antonuzzo L, Del Re M, Barucca V, Spada F, Meoni G, Restante G, Danesi R, Di Costanzo F, Fazio N. Critical focus on mechanisms of resistance and toxicity of m-TOR inhibitors in pancreatic neuroendocrine tumors. Cancer Treat Rev. 2017; 57:28–35. https://doi.org/10.1016/j.ctrv.2017.05.001 [PubMed]
- 18. Michl P, Gress TM. Current concepts and novel targets in advanced pancreatic cancer. Gut. 2013; 62:317–26. https://doi.org/10.1136/gutjnl-2012-303588 [PubMed]
- 19. Yang W, Soares J, Greninger P, Edelman EJ, Lightfoot H, Forbes S, Bindal N, Beare D, Smith JA, Thompson IR, Ramaswamy S, Futreal PA, Haber DA, et al. Genomics of Drug Sensitivity in Cancer (GDSC): a resource for therapeutic biomarker discovery in cancer cells. Nucleic Acids Res. 2013; 41:D955–61. https://doi.org/10.1093/nar/gks1111 [PubMed]
- 20. The TCGA Legacy. Cell. 2018; 173:281–2. https://doi.org/10.1016/j.cell.2018.03.049 [PubMed]
- 21. de Sousa Cavalcante L, Monteiro G. Gemcitabine: metabolism and molecular mechanisms of action, sensitivity and chemoresistance in pancreatic cancer. Eur J Pharmacol. 2014; 741:8–16. https://doi.org/10.1016/j.ejphar.2014.07.041 [PubMed]
- 22. Ma T, Chen W, Zhi X, Liu H, Zhou Y, Chen BW, Hu L, Shen J, Zheng X, Zhang S, Zhang B, Li H, Liang T. USP9X inhibition improves gemcitabine sensitivity in pancreatic cancer by inhibiting autophagy. Cancer Lett. 2018; 436:129–38. https://doi.org/10.1016/j.canlet.2018.08.010 [PubMed]
- 23. Hattori A, Tsujimoto M. Endoplasmic reticulum aminopeptidases: biochemistry, physiology and pathology. J Biochem. 2013; 154:219–28. https://doi.org/10.1093/jb/mvt066 [PubMed]
- 24. Hanson AL, Cuddihy T, Haynes K, Loo D, Morton CJ, Oppermann U, Leo P, Thomas GP, Lê Cao KA, Kenna TJ, Brown MA. Genetic Variants in ERAP1 and ERAP2 Associated With Immune-Mediated Diseases Influence Protein Expression and the Isoform Profile. Arthritis Rheumatol. 2018; 70:255–65. https://doi.org/10.1002/art.40369 [PubMed]
- 25. Robinson PC, Costello ME, Leo P, Bradbury LA, Hollis K, Cortes A, Lee S, Joo KB, Shim SC, Weisman M, Ward M, Zhou X, Garchon HJ, et al. ERAP2 is associated with ankylosing spondylitis in HLA-B27-positive and HLA-B27-negative patients. Ann Rheum Dis. 2015; 74:1627–9. https://doi.org/10.1136/annrheumdis-2015-207416 [PubMed]
- 26. Compagnone M, Cifaldi L, Fruci D. Regulation of ERAP1 and ERAP2 genes and their disfunction in human cancer. Hum Immunol. 2019; 80:318–24. https://doi.org/10.1016/j.humimm.2019.02.014 [PubMed]
- 27. Thuring C, Follin E, Geironson L, Freyhult E, Junghans V, Harndahl M, Buus S, Paulsson KM. HLA class I is most tightly linked to levels of tapasin compared with other antigen-processing proteins in glioblastoma. Br J Cancer. 2015; 113:952–62. https://doi.org/10.1038/bjc.2015.297 [PubMed]
- 28. Warthan MD, Washington SL, Franzese SE, Ramus RM, Kim KR, York TP, Stratikos E, Strauss JF 3rd, Lee ED. The role of endoplasmic reticulum aminopeptidase 2 in modulating immune detection of choriocarcinoma. Biol Reprod. 2018; 98:309–22. https://doi.org/10.1093/biolre/ioy001 [PubMed]
- 29. Yang Z, Tian H, Bie F, Xu J, Zhou Z, Yang J, Li R, Peng Y, Bai G, Tian Y, Chen Y, Liu L, Fan T, et al. ERAP2 Is Associated With Immune Infiltration and Predicts Favorable Prognosis in SqCLC. Front Immunol. 2021; 12:788985. https://doi.org/10.3389/fimmu.2021.788985 [PubMed]
- 30. Kuo IC, Kao HK, Huang Y, Wang CI, Yi JS, Liang Y, Liao CT, Yen TC, Wu CC, Chang KP. Endoplasmic reticulum aminopeptidase 2 involvement in metastasis of oral cavity squamous cell carcinoma discovered by proteome profiling of primary cancer cells. Oncotarget. 2017; 8:61698–708. https://doi.org/10.18632/oncotarget.18680 [PubMed]
- 31. Leone P, Shin EC, Perosa F, Vacca A, Dammacco F, Racanelli V. MHC class I antigen processing and presenting machinery: organization, function, and defects in tumor cells. J Natl Cancer Inst. 2013; 105:1172–87. https://doi.org/10.1093/jnci/djt184 [PubMed]
- 32. Lee ED. Endoplasmic Reticulum Aminopeptidase 2, a common immunological link to adverse pregnancy outcomes and cancer clearance? Placenta. 2017; 56:40–3. https://doi.org/10.1016/j.placenta.2017.03.012 [PubMed]
- 33. Georgiadis D, Mpakali A, Koumantou D, Stratikos E. Inhibitors of ER Aminopeptidase 1 and 2: From Design to Clinical Application. Curr Med Chem. 2019; 26:2715–29. https://doi.org/10.2174/0929867325666180214111849 [PubMed]
- 34. Engelman JA, Luo J, Cantley LC. The evolution of phosphatidylinositol 3-kinases as regulators of growth and metabolism. Nat Rev Genet. 2006; 7:606–19. https://doi.org/10.1038/nrg1879 [PubMed]
- 35. Janku F, Yap TA, Meric-Bernstam F. Targeting the PI3K pathway in cancer: are we making headway? Nat Rev Clin Oncol. 2018; 15:273–91. https://doi.org/10.1038/nrclinonc.2018.28 [PubMed]
- 36. O’Donnell JS, Massi D, Teng MWL, Mandala M. PI3K-AKT-mTOR inhibition in cancer immunotherapy, redux. Semin Cancer Biol. 2018; 48:91–103. https://doi.org/10.1016/j.semcancer.2017.04.015 [PubMed]
- 37. Polivka J
Jr , Janku F. Molecular targets for cancer therapy in the PI3K/AKT/mTOR pathway. Pharmacol Ther. 2014; 142:164–75. https://doi.org/10.1016/j.pharmthera.2013.12.004 [PubMed] - 38. Brady SW, Zhang J, Tsai MH, Yu D. PI3K-independent mTOR activation promotes lapatinib resistance and IAP expression that can be effectively reversed by mTOR and Hsp90 inhibition. Cancer Biol Ther. 2015; 16:402–11. https://doi.org/10.1080/15384047.2014.1002693 [PubMed]
- 39. Chawsheen MA, Dash PR. mTOR modulates resistance to gemcitabine in lung cancer in an MTORC2 dependent mechanism. Cell Signal. 2021; 81:109934. https://doi.org/10.1016/j.cellsig.2021.109934 [PubMed]
- 40. Feng M, Xiong G, Cao Z, Yang G, Zheng S, Qiu J, You L, Zheng L, Zhang T, Zhao Y. LAT2 regulates glutamine-dependent mTOR activation to promote glycolysis and chemoresistance in pancreatic cancer. J Exp Clin Cancer Res. 2018; 37:274. https://doi.org/10.1186/s13046-018-0947-4 [PubMed]