


Introduction
Lung cancer is the most frequent malignancy threatening human life with five-year survival rate of no more than 15% [1–3]. Since no specific clinical manifestations occur in the early stage of lung cancer, it is difficult to diagnose. Once there are apparent clinical symptoms, the malignancy has already developed into an advanced stage, when the prognosis of patients is extremely poor [4]. Spiral CT is often used for detection of early lung cancer. Early non-small cell lung cancer (NSCLC) patients are advised to receive surgery. Chemotherapy is usually administered in the perioperative period. High-dose stereotactic radiation therapy can be also used and usually sustained for 6 weeks. Molecular targeted therapy is often used for advanced lung cancer. For lung cancer, biomarkers play important roles in diagnosis, treatment and improving prognosis. However, many biomarkers are limited to specific molecular types of lung cancer, thus provoking searches for novel biomarkers to forecast prognosis on a grander scale.
FHL2, a multifunctional scaffolding protein, has been shown to modulate gene transcription and signaling cascades [5]. Previous reports have shown that FHL2 facilitates cell proliferation in glioblastoma [6], gastric, colon [7], and cervical [8] cancers. Specifically, FHL2 interacts with EGFR to promote glioblastoma growth [6]. FHL2 suppression inhibits gastric and colon carcinogenesis [7]. FHL2 facilitates MDM2-mediated degradation of IER3 to regulate proliferation of cervical cancer [8]. FHL2 also shows a great potential to diagnose malignancies, become a therapeutic target and predict prognosis of cancer. Nevertheless, the diagnostic and prognostic value of FHL2 in lung cancer is still unclear.
Herein, we assessed the correlation between FHL2 expression in lung cancer and clinicopathologic characteristics through analyzing data from The Cancer Genome Atlas (TCGA) database. The receiver operating characteristic (ROC) curves were plotted to analyze the diagnostic value of FHL2. We further evaluated the independent prognostic ability of FHL2 expression for relapse-free survival (RFS) and overall survival (OS) through the Kaplan–Meier curve, subgroup analysis, univariate Cox analysis and multivariate Cox analysis. Besides, the ability of FHL2 to predict RFS and OS was reflected by nomogram. Finally, the relationship of high FHL2 expression with glycolysis and unfolded protein reflection was explored by GSEA analysis.
Results
Patient features
The RNA expression information and related clinical data were acquired from TCGA database. In total, 1018 patients with lung cancer, including 407 females and 611 males were analyzed. Moreover, 109 patients were <55 years old, and 881 patients were ≥55 years old. The detailed clinical features of the patients derived from TCGA were demonstrated in Table 1. There were significant differences (P < 0.05) in histological type, T, N classification, and vital status. However, no statistical differences were found in other parameters.
Table 1. Relationship between FHL2 expression and clinicopathological parameters in patients with lung cancer.
| Parameter | N | FHL2 | X2 | P | |||||||||||||||||||||||||||||||||||||||||||||||||||||||||||||||||||||||||||||||||||||||||||||||
| High | % | Low | % | ||||||||||||||||||||||||||||||||||||||||||||||||||||||||||||||||||||||||||||||||||||||||||||||||
| Age | <55 | 109 | 58 | (11.76) | 51 | (10.26) | 0.4276 | 0.5132 | |||||||||||||||||||||||||||||||||||||||||||||||||||||||||||||||||||||||||||||||||||||||||||
| ≥55 | 881 | 435 | (88.24) | 446 | (89.74) | ||||||||||||||||||||||||||||||||||||||||||||||||||||||||||||||||||||||||||||||||||||||||||||||
| Gender | Female | 407 | 204 | (40.48) | 203 | (39.49) | 0.0654 | 0.7981 | |||||||||||||||||||||||||||||||||||||||||||||||||||||||||||||||||||||||||||||||||||||||||||
| Male | 611 | 300 | (59.52) | 311 | (60.51) | ||||||||||||||||||||||||||||||||||||||||||||||||||||||||||||||||||||||||||||||||||||||||||||||
| Histological type | lung adenocarcinoma | 517 | 284 | (56.35) | 233 | (45.24) | 12.1306 | 0.0005*** | |||||||||||||||||||||||||||||||||||||||||||||||||||||||||||||||||||||||||||||||||||||||||||
| lung squamous cell carcinoma | 502 | 220 | (43.65) | 282 | (54.76) | ||||||||||||||||||||||||||||||||||||||||||||||||||||||||||||||||||||||||||||||||||||||||||||||
| Stage | I | 521 | 249 | (49.9) | 272 | (53.65) | 3.8310 | 0.2810 | |||||||||||||||||||||||||||||||||||||||||||||||||||||||||||||||||||||||||||||||||||||||||||
| II | 284 | 138 | (27.66) | 146 | (28.8) | ||||||||||||||||||||||||||||||||||||||||||||||||||||||||||||||||||||||||||||||||||||||||||||||
| III | 168 | 94 | (18.84) | 74 | (14.6) | ||||||||||||||||||||||||||||||||||||||||||||||||||||||||||||||||||||||||||||||||||||||||||||||
| IV | 33 | 18 | (3.61) | 15 | (2.96) | ||||||||||||||||||||||||||||||||||||||||||||||||||||||||||||||||||||||||||||||||||||||||||||||
| T classification | T1 | 284 | 115 | (22.82) | 169 | (32.88) | 13.9650 | 0.0048** | |||||||||||||||||||||||||||||||||||||||||||||||||||||||||||||||||||||||||||||||||||||||||||
| T2 | 571 | 303 | (60.12) | 268 | (52.14) | ||||||||||||||||||||||||||||||||||||||||||||||||||||||||||||||||||||||||||||||||||||||||||||||
| T3 | 118 | 65 | (12.9) | 53 | (10.31) | ||||||||||||||||||||||||||||||||||||||||||||||||||||||||||||||||||||||||||||||||||||||||||||||
| T4 | 42 | 20 | (3.97) | 22 | (4.28) | ||||||||||||||||||||||||||||||||||||||||||||||||||||||||||||||||||||||||||||||||||||||||||||||
| TX | 3 | 1 | (0.2) | 2 | (0.39) | ||||||||||||||||||||||||||||||||||||||||||||||||||||||||||||||||||||||||||||||||||||||||||||||
| N classification | N0 | 652 | 321 | (63.69) | 331 | (64.52) | 14.1067 | 0.0057** | |||||||||||||||||||||||||||||||||||||||||||||||||||||||||||||||||||||||||||||||||||||||||||
| N1 | 227 | 99 | (19.64) | 128 | (24.95) | ||||||||||||||||||||||||||||||||||||||||||||||||||||||||||||||||||||||||||||||||||||||||||||||
| N2 | 114 | 73 | (14.48) | 41 | (7.99) | ||||||||||||||||||||||||||||||||||||||||||||||||||||||||||||||||||||||||||||||||||||||||||||||
| N3 | 7 | 2 | (0.4) | 5 | (0.97) | ||||||||||||||||||||||||||||||||||||||||||||||||||||||||||||||||||||||||||||||||||||||||||||||
| NX | 17 | 9 | (1.79) | 8 | (1.56) | ||||||||||||||||||||||||||||||||||||||||||||||||||||||||||||||||||||||||||||||||||||||||||||||
| M classification | M0 | 758 | 374 | (74.8) | 384 | (75.29) | 0.6057 | 0.7575 | |||||||||||||||||||||||||||||||||||||||||||||||||||||||||||||||||||||||||||||||||||||||||||
| M1 | 32 | 18 | (3.6) | 14 | (2.75) | ||||||||||||||||||||||||||||||||||||||||||||||||||||||||||||||||||||||||||||||||||||||||||||||
| MX | 220 | 108 | (21.6) | 112 | (21.96) | ||||||||||||||||||||||||||||||||||||||||||||||||||||||||||||||||||||||||||||||||||||||||||||||
| Radiation therapy | NO | 782 | 387 | (88.15) | 395 | (87.2) | 0.1111 | 0.7388 | |||||||||||||||||||||||||||||||||||||||||||||||||||||||||||||||||||||||||||||||||||||||||||
| YES | 110 | 52 | (11.85) | 58 | (12.8) | ||||||||||||||||||||||||||||||||||||||||||||||||||||||||||||||||||||||||||||||||||||||||||||||
| Residual tumor | R0 | 743 | 358 | (90.18) | 385 | (90.16) | 0.7633 | 0.8763 | |||||||||||||||||||||||||||||||||||||||||||||||||||||||||||||||||||||||||||||||||||||||||||
| R1 | 25 | 12 | (3.02) | 13 | (3.04) | ||||||||||||||||||||||||||||||||||||||||||||||||||||||||||||||||||||||||||||||||||||||||||||||
| R2 | 8 | 5 | (1.26) | 3 | (0.7) | ||||||||||||||||||||||||||||||||||||||||||||||||||||||||||||||||||||||||||||||||||||||||||||||
| RX | 48 | 22 | (5.54) | 26 | (6.09) | ||||||||||||||||||||||||||||||||||||||||||||||||||||||||||||||||||||||||||||||||||||||||||||||
| Vital status | Deceased | 404 | 218 | (43.25) | 186 | (36.19) | 5.0188 | 0.0251* | |||||||||||||||||||||||||||||||||||||||||||||||||||||||||||||||||||||||||||||||||||||||||||
| Living | 614 | 286 | (56.75) | 328 | (63.81) | ||||||||||||||||||||||||||||||||||||||||||||||||||||||||||||||||||||||||||||||||||||||||||||||
| Sample type | Primary Tumor | 1017 | 502 | (99.6) | 515 | (100) | 0.5229 | 0.4696 | |||||||||||||||||||||||||||||||||||||||||||||||||||||||||||||||||||||||||||||||||||||||||||
| Recurrent Tumor | 2 | 2 | (0.4) | 0 | (0) | ||||||||||||||||||||||||||||||||||||||||||||||||||||||||||||||||||||||||||||||||||||||||||||||
| X represents unknown, *P < 0.05; **P < 0.01; ***P < 0.001. | |||||||||||||||||||||||||||||||||||||||||||||||||||||||||||||||||||||||||||||||||||||||||||||||||||
High FHL2 mRNA expression in lung cancer
The mRNA expression of FHL2 in lung tumor tissue was significantly higher (P < 2.2e-16) than that in normal lung tissue (Figure 1A). Moreover, different FHL2 expression levels were observed (Figure 1B–1L). Lung adenocarcinoma patients had higher FHL2 expression levels (P < 0.01) than lung squamous cell carcinoma patients (Figure 1B). Despite the P value was bigger than 0.05, the result indicated a gradual increase with higher stages (Figure 1C). FHL2 mRNA expression levels of T, N, M classifications are illustrated in Figure 1D–1F. Despite statistical differences are not significant, we still identified patients who were female, <55 years old, deceased and treated with radiation therapy had higher FHL2 expression levels than patients who were male, ≥55 years old, living, and not treated with radiation therapy respectively (Figure 1G–1J). With regard to residual tumor, 4 groups had similar FHL2 expression, while R2 had the higher FHL2 expression level compared to the other groups (Figure 1K). Patients with primary tumor seemed to have lower FHL2 expression levels than patients with recurrent tumor (Figure 1L, P = 0.74), but further studies need to be conducted due to only 2 patients with recurrent tumor.
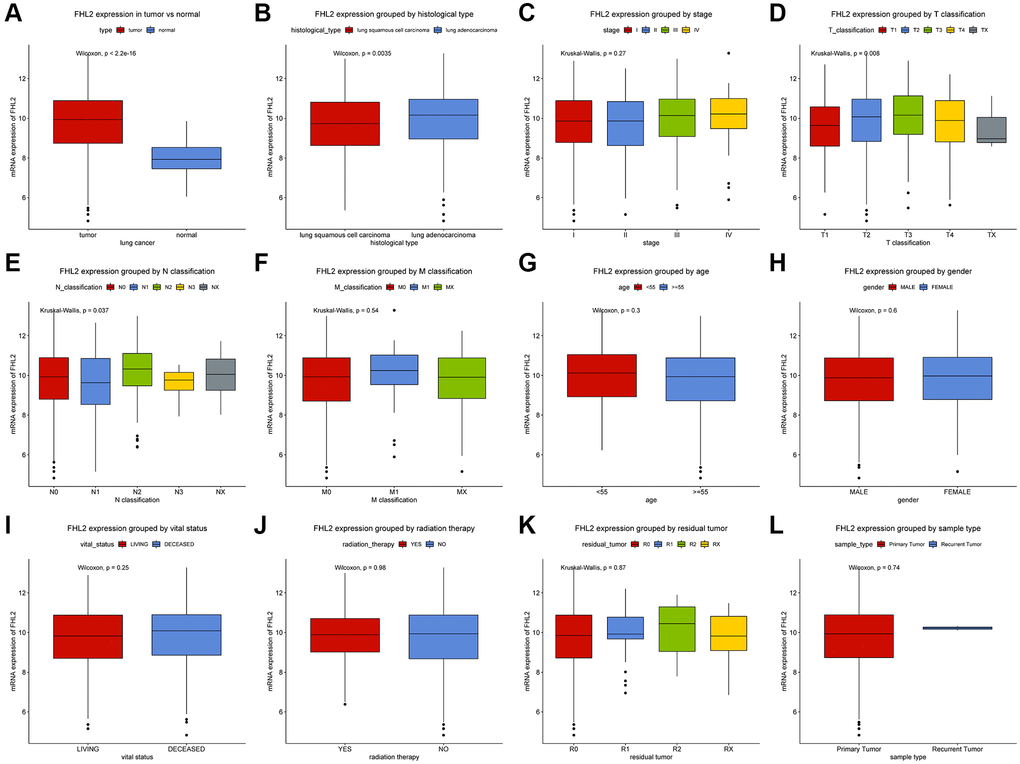
Figure 1. Expression of FHL2 in normal population and lung cancer patients and its relationship with clinicopathological parameters. (A) The expression difference of FHL2 between normal population and lung cancer patients. (B, C) Expression of FHL2 in different histological types and stages. (D–F) The relationship between FHL2 expression and T classification, N classification, and M classification. (G–L) The relationship between FHL2 expression and age, gender, vital status, radiotherapy, residual tumor, and recurrent tumors. *P < 0.05; **P < 0.01.
Capability of FHL2 to diagnose lung cancer
The ROC curves were utilized to analyze the diagnostic value of FHL2. A moderate diagnostic capability in lung cancer was observed with the AUC of 0.857 (Figure 2A). We also evaluated the diagnostic ability of FHL2 in the different stages. The similar results were found (Figure 2B–2E) that AUC values were 0.861 (stage I), 0.835 (stage II), 0.877 (stage III) and 0.866 (stage IV), respectively.
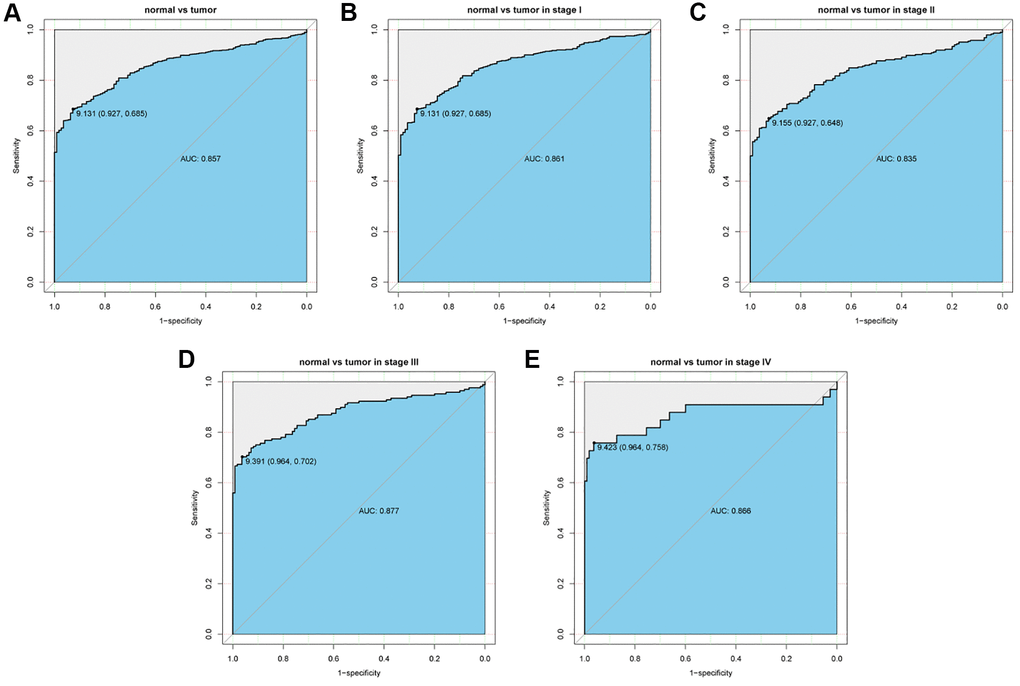
Figure 2. ROC curve to assess the diagnostic ability of FHL2 at different stages. (A) The diagnostic value of FHL2 in lung cancer patients. (B–E) Diagnostic value of FHL2 in patients with stage I, stage II, stage III, and stage IV.
Relationships between clinical features and FHL2 expression
The patients were divided into the low- and high- groups according to the threshold of FHL2 level determined from the ROC curve. As demonstrated in Table 1, high FHL2 mRNA expression was highly correlated with histological type (P = 0.0005), T classification (P = 0.0048), N classification (P = 0.0057) and vital status (P = 0.0251) in the light of Chi-square tests.
FHL2 mRNA expression is associated with overall survival
As demonstrated in Figure 3, the Kaplan–Meier curve with log rank tests showed the relationship between FHL2 mRNA expression and overall survival. High FHL2 mRNA expression was remarkably related with poor overall survival (Figure 3A, P = 0.0005). The further subgroup analysis (Figure 3B–3P) revealed that high FHL2 expression was associated with poor OS of patients with lung adenocarcinoma (P = 0.0110), lung squamous cell carcinoma (P = 0.0160), stage II (P = 0.0059), T2 (P < 0.0001), N2 (P = 0.0033) and M0 (P = 0.0048). Additionally, although P value was bigger than 0.05, we still identified that high FHL2 expression was correlated with poor OS patients with stage I, stage III, stage IV, T1, T3, T4, N0, N1 and M1 NSCLC.
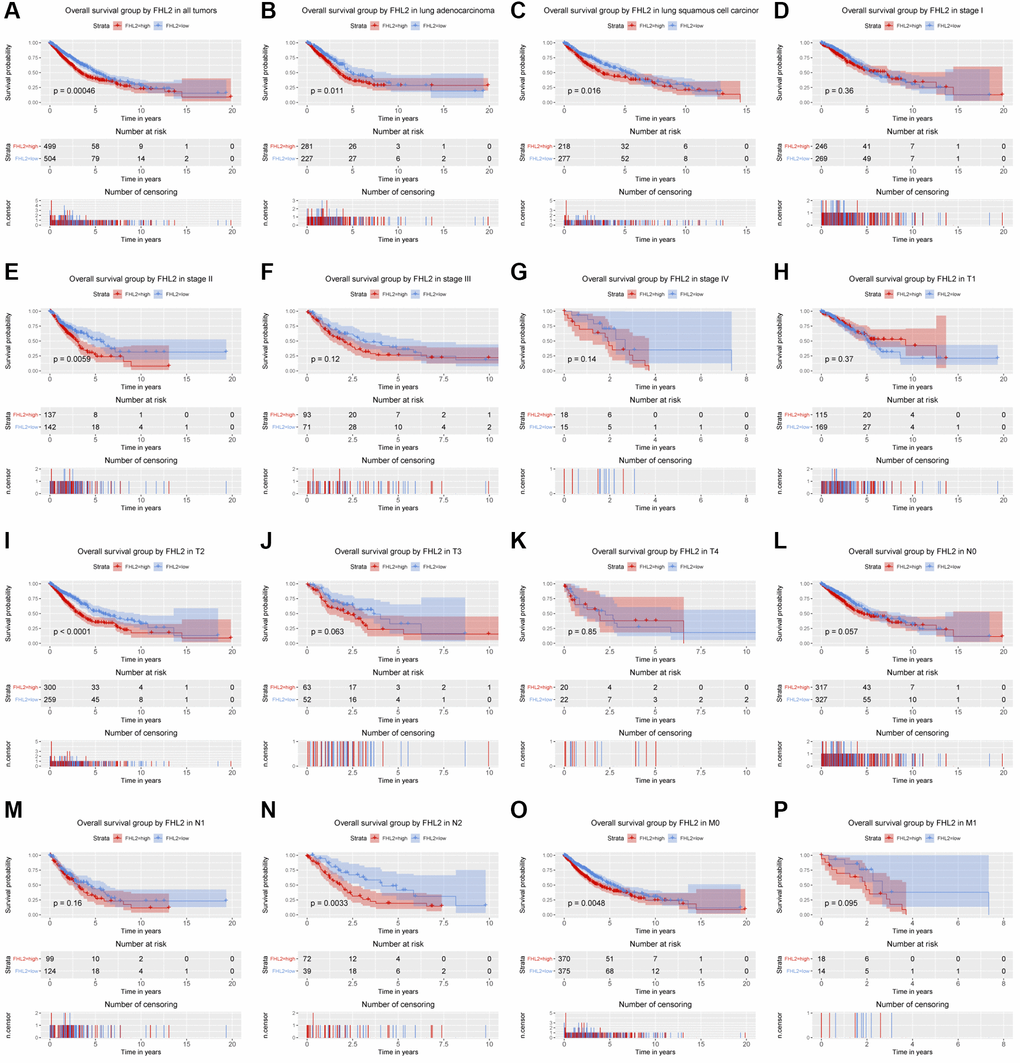
Figure 3. The relationship between FHL2 mRNA expression and overall survival. (A) Overall survival group by FHL2 in all tumors. (B–P) Overall survival group by FHL2 in lung adenocarcinoma, lung squamous cell carcinoma, stage I, stage II, stage III, stage IV, T1, T2, T3, T4, N0, N1, N2, M0, M1.
Univariate Cox analysis identified several crucial variables, and the subsequent multivariate analysis confirmed that stage [hazard ratio (HR): 1.343, 95% confidence interval (CI): 1.148–1.570, P < 0.001], T classification (HR: 1.185, 95% CI: 1.027–1.367, P = 0.020), residual tumor (HR: 1.138, 95% CI: 1.003–1.291, P = 0.045) and FHL2 expression (HR: 1.415, 95% CI: 1.160–1.726, P < 0.001) had independent prognostic value for OS of patients with lung cancer. (Figure 4).
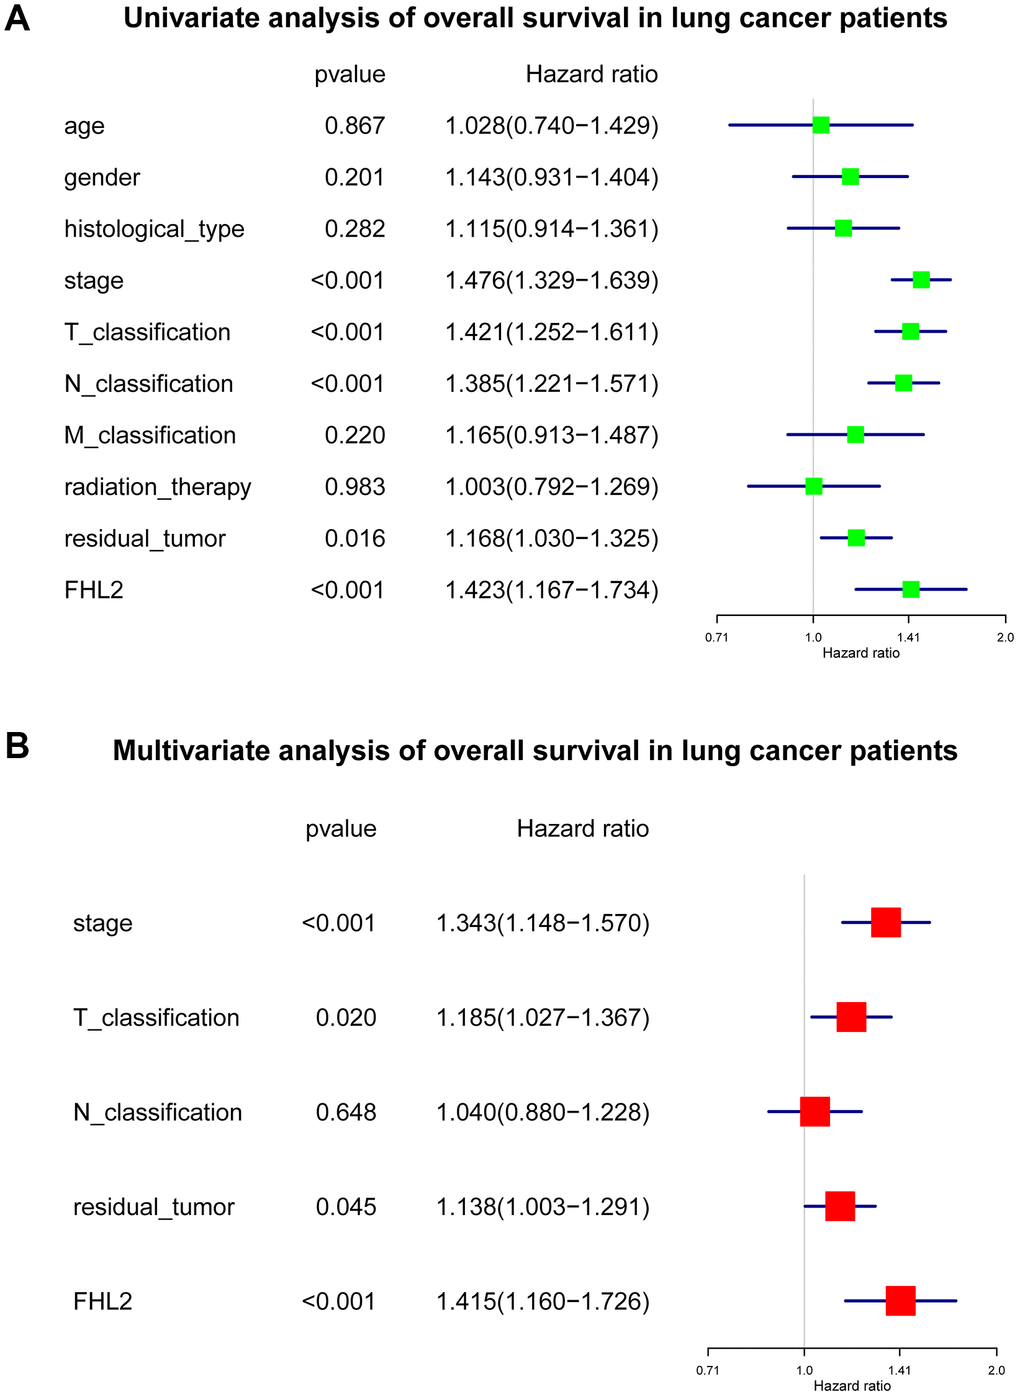
Figure 4. The subsequent multivariate analysis about FHL2 and overall survival in lung cancer. (A) Univariate analysis of overall survival in lung cancer patients. (B) Multivariate analysis of overall survival in lung cancer patients. *P < 0.05; **P < 0.01; ***P < 0.001.
FHL2 mRNA expression is correlated with relapse-free survival
The Kaplan–Meier survival curve was utilized to evaluate the relationship between FHL2 expression and RFS (Figure 5). Similar to the outcomes above, high FHL2 expression demonstrated a close association with lung adenocarcinoma, stage II, T2, and M0 lung carcinoma. High FHL2 expression showed remarkable prognostic value (P = 0.0036). More importantly, we plotted ROC curves to assess the value of FHL2 in predicting one-, three-, and even five-year RFS in lung cancer patients. Additionally, univariate Cox analysis was utilized to select the crucial prognostic factors. Furthermore, multivariable analysis was implemented to modify interaction between factors. Eventually, FHL2 expression was validated as an independent prognostic factor of patients with NSCLC (Figure 6).
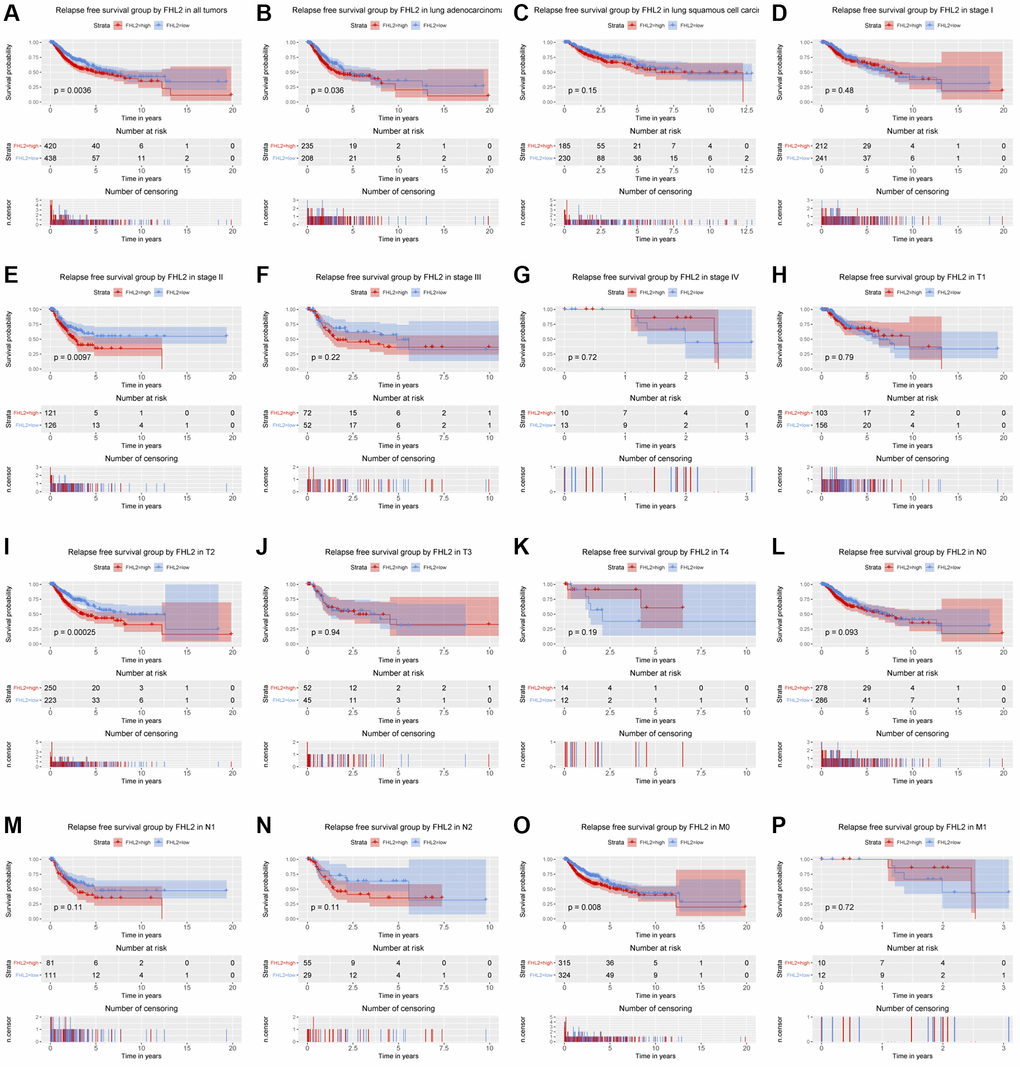
Figure 5. The relationship between FHL2 mRNA expression and relapse free survival. (A) Relapse free survival group by FHL2 in all tumors. (B–P) Relapse free survival group by FHL2 in lung adenocarcinoma, lung squamous cell carcinoma, stage I, stage II, stage III, stage IV, T1, T2, T3, T4, N0, N1, N2, M0, M1.
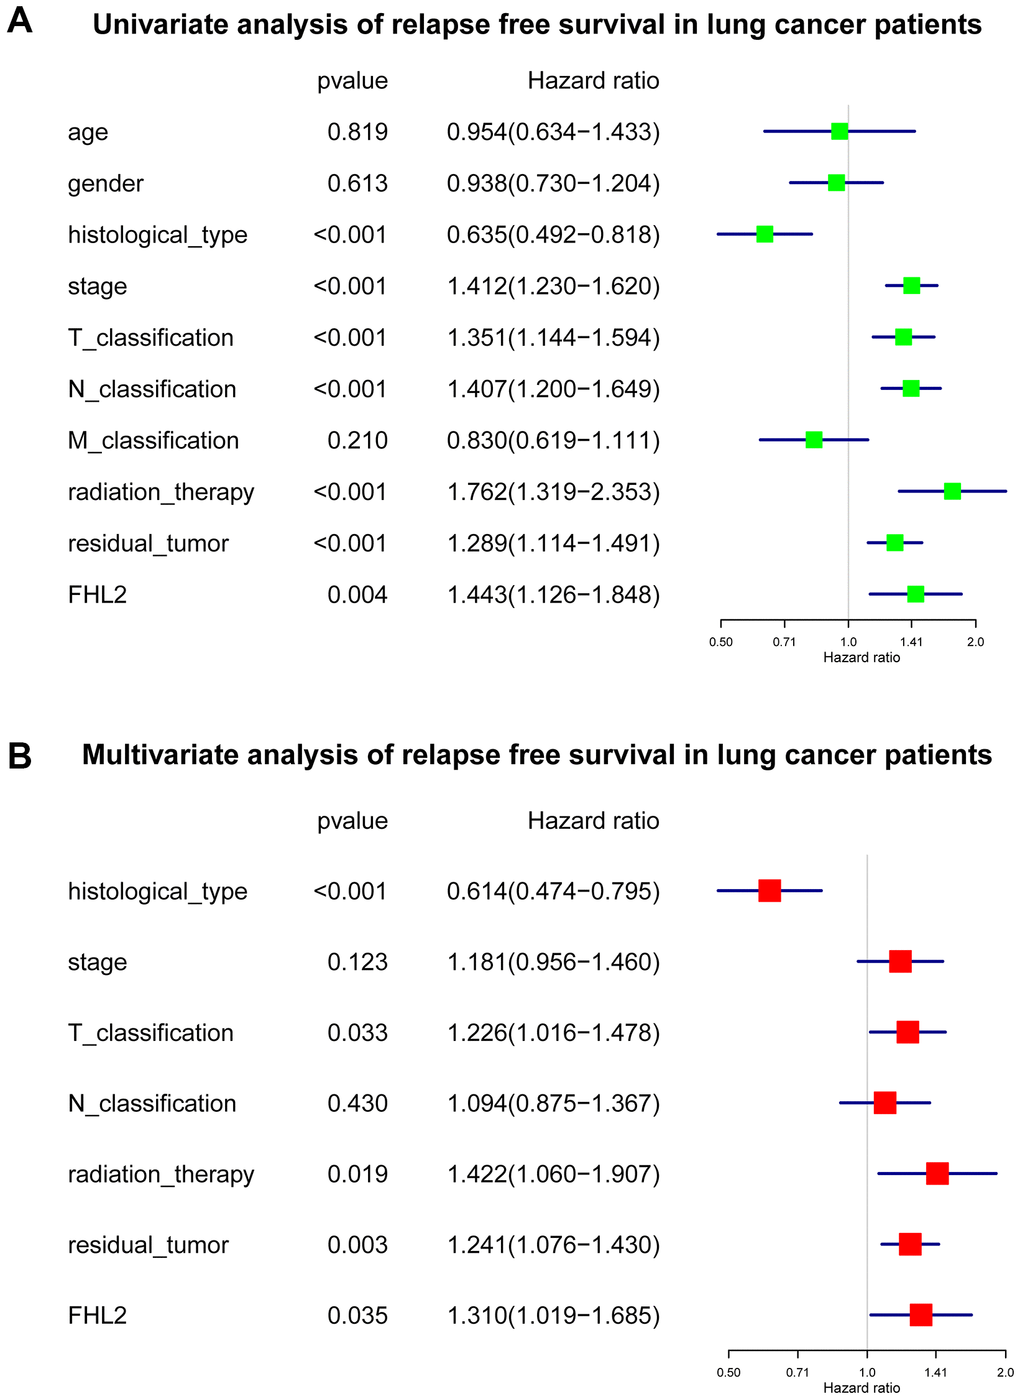
Figure 6. The subsequent multivariate analysis about FHL2 and relapse free survival in lung cancer. (A) Univariate analysis of relapse free survival in lung cancer patients. (B) Multivariate analysis of relapse free survival in lung cancer patients. *P < 0.05; **P < 0.01; ***P < 0.001.
FHL2 can serve as an independent predictor of survival
To evaluate the value of FHL2 as an independent indicator for predicting patient survival, we used the data downloaded from the TCGA database to draw a nomogram of FHL2 predicting patient survival and progression-free survival, and reflected the prediction results through the ROC curve.
As shown in Figure 7, the results showed that patients with high FHL2 expression had shorter OS. Besides, the patients with higher stages, higher T classification, higher N classification, or higher residual tumor also had shorter overall survival. The time-dependent ROC curve exhibited a moderate diagnostic capability with AUC of 0.56 at 1 year, 0.54 at 3 and 5 years (Figure 7A). The nomogram-predicted probability of 1-year, 3-year, and 5-year OS were close to the corresponding actual OS (Figure 7B–7D). At the same time, the decision curve was used to reflect the FHL2 prediction model, and the results showed that patients with high FHL2 expression could predict shorter OS (Figure 7E–7G).
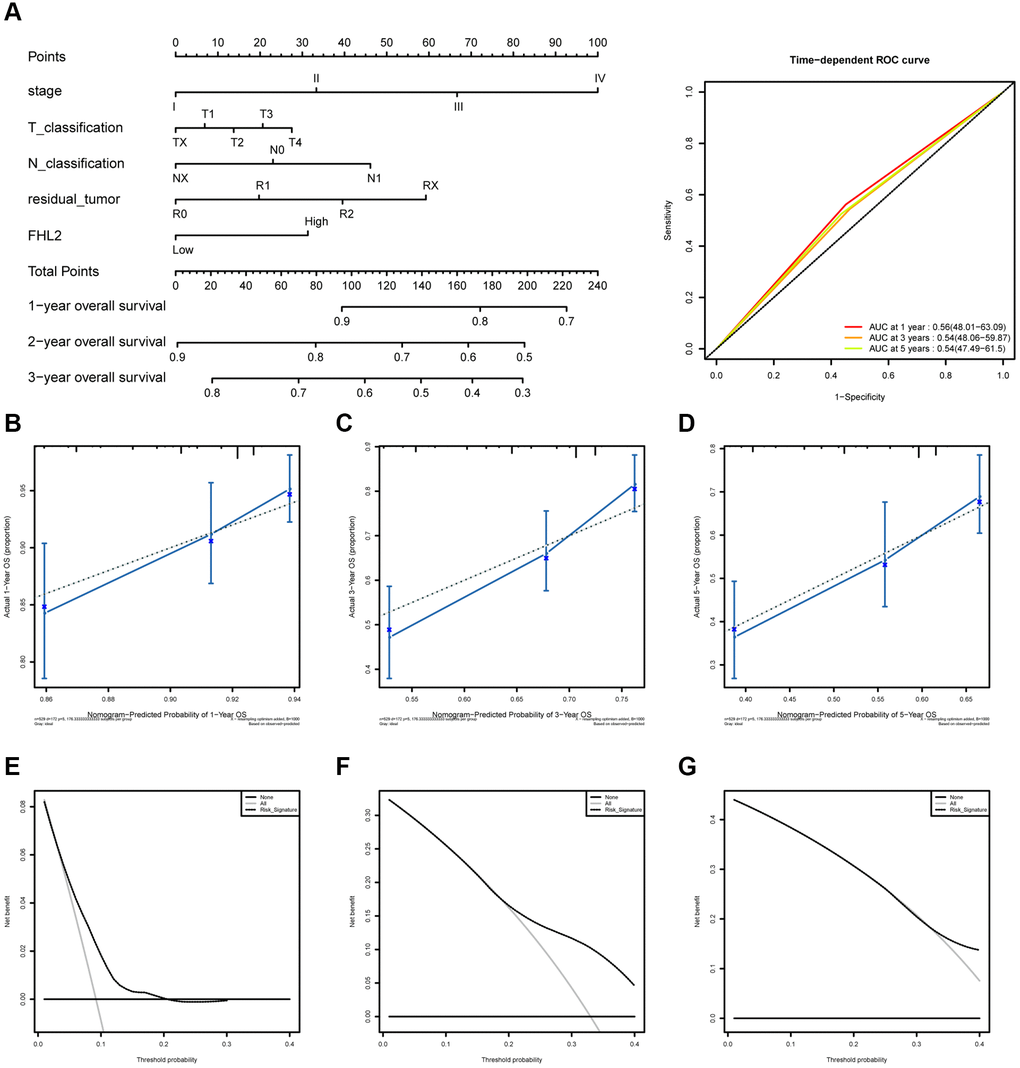
Figure 7. The ROC curves and nomogram about FHL2 and overall survival in lung cancer. (A) ROC curves evaluating the value of FHL2 for predicting overall survival in lung cancer patients. (B) Nomogram predicted 1-year overall survival versus actual 1-year overall survival. (C) Nomogram predicted 3-year overall survival versus actual 3-year overall survival. (D) Nomogram predicted 5-year overall survival versus actual 5-year overall survival. (E–G) Decision curve analysis reflects the feasibility of FHL2 in predicting 1-year, 3-year, and 5-year overall survival of patients.
As shown in Figure 8, the results showed that patients with high FHL2 expression had shorter RFS. Similarly, the patients with adenocarcinoma, higher stages, higher T classification, or higher N classification also had shorter RFS. The time-dependent ROC curve exhibited a moderate diagnostic capability with AUC of 0.56 at 1 year, 0.53 at 3 years, and 0.51 at 5 years (Figure 8A). The nomogram-predicted probability of 1-year, 3-year, and 5-year RFS were close to the corresponding actual RFS (Figure 8B–8D). At the same time, the decision curve was used to reflect the FHL2 prediction model, and the results showed that patients with high FHL2 expression could predict shorter RFS (Figure 8E–8G).
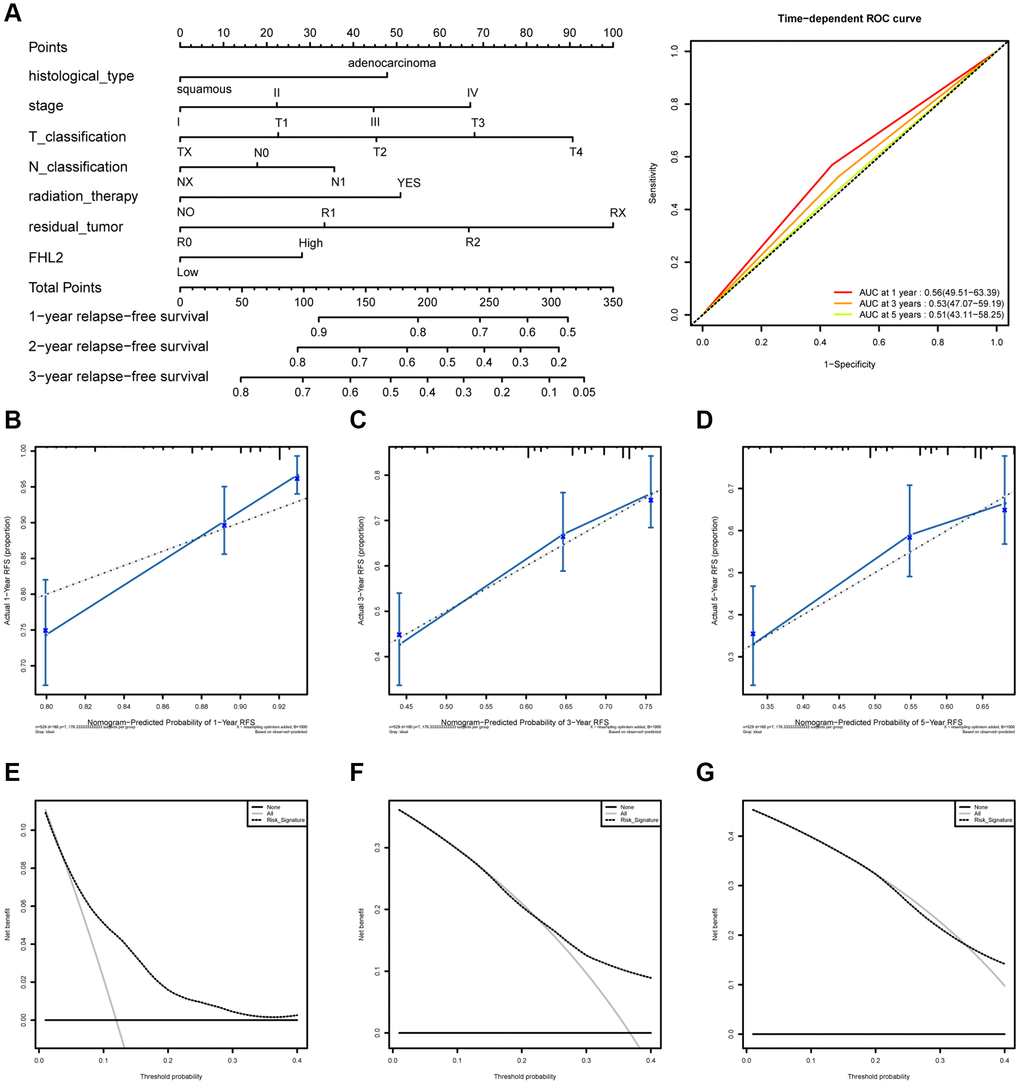
Figure 8. The ROC curves and nomogram about FHL2 and RFS in lung cancer. (A) ROC curves evaluating the value of FHL2 for predicting RFS in lung cancer patients. (B) Nomogram predicted 1-year RFS versus actual 1-year RFS. (C) Nomogram predicted 3-year RFS versus actual 3-year RFS. (D) Nomogram predicted 5-year RFS versus actual 5-year RFS. (E–G) Decision curve analysis reflects the feasibility of FHL2 in predicting 1-year, 3-year, and 5-year RFS of patients.
Patients with high FHL2 expression are more prone to glycolysis and unfold protein response
To further explore the mechanism by which FHL2 affects lung cancer progression, the GSEA analysis through the database obtained from TCGA was further performed to examine the correlation between high FHL2 expression and Glycolytic and unfolded protein responses. The relevant data scores are shown in Table 2.
Table 2. Gene set for FHL2 high group.
| Name | Size | ES | NES | NOM p-val | FDR q-val | ||||||||||||||||||||||||||||||||||||||||||||||||||||||||||||||||||||||||||||||||||||||||||||||
| HALLMARK_GLYCOLYSIS | 199 | 0.549744 | 2.132682 | 0 | 0.019725 | ||||||||||||||||||||||||||||||||||||||||||||||||||||||||||||||||||||||||||||||||||||||||||||||
| HALLMARK_UNFOLDED_PROTEIN_RESPONSE | 113 | 0.477332 | 2.022087 | 0.002028 | 0.022602 | ||||||||||||||||||||||||||||||||||||||||||||||||||||||||||||||||||||||||||||||||||||||||||||||
| *P < 0.05; **P < 0.01. | |||||||||||||||||||||||||||||||||||||||||||||||||||||||||||||||||||||||||||||||||||||||||||||||||||
The results showed that high FHL2 expression was highly correlated with Glycolysis and unfolded protein responses (Figure 9). This suggests that FHL2 may affect lung cancer progression by regulating Glycolysis and inducing unfolded protein response.
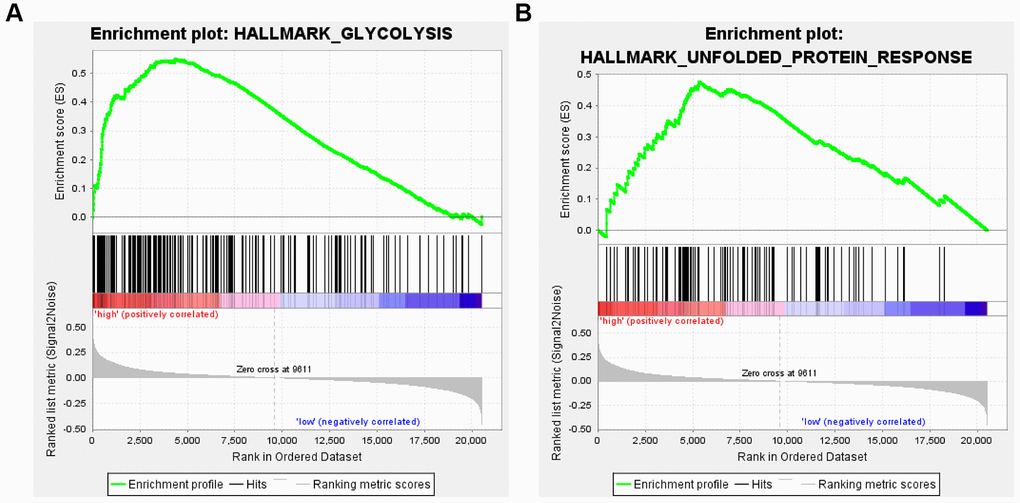
Figure 9. Enrichment analysis of FHL2 expression and glycolytic and unfolded protein responses. (A) High expression of FHL2 is enriched in the Glycolytic pathway. (B) High FHL2 expression is highly correlated with unfolded protein response.
FHL2 knockdown inhibits proliferation, migration, and invasion of NSCLC cells
In order to explore the effect of FHL2 on the biological behavior of NSCLC in vitro, we selected 95-D and NCI-H1299 cell lines with high invasiveness and active proliferation for subsequent experiments. We established A549 and NCI-H1299 cells stably expressing FHL2 targeted shRNA, and detected the transfection efficiency by qRT-PCR (Figure 10A). The results of CCK8 assays showed that the proliferation ability of the cells was markedly decreased in sh-FHL2 group compared to sh-NC group (Figure 10B). This indicates that the proliferation ability of cells was inhibited after silencing FHL2. We further explored the effects of FHL2 on NSCLC cell migration and invasion. As shown in Figure 10C–10F, the number of migrated and invaded cells were decreased in sh-FHL2 group compared to sh-NC group. These experiments proved that FHL2 may play an important role in promoting NSCLC by promoting the migration, invasion, and proliferation ability of NSCLC cells. This finding provides a new idea for the clinical treatment of NSCLC.
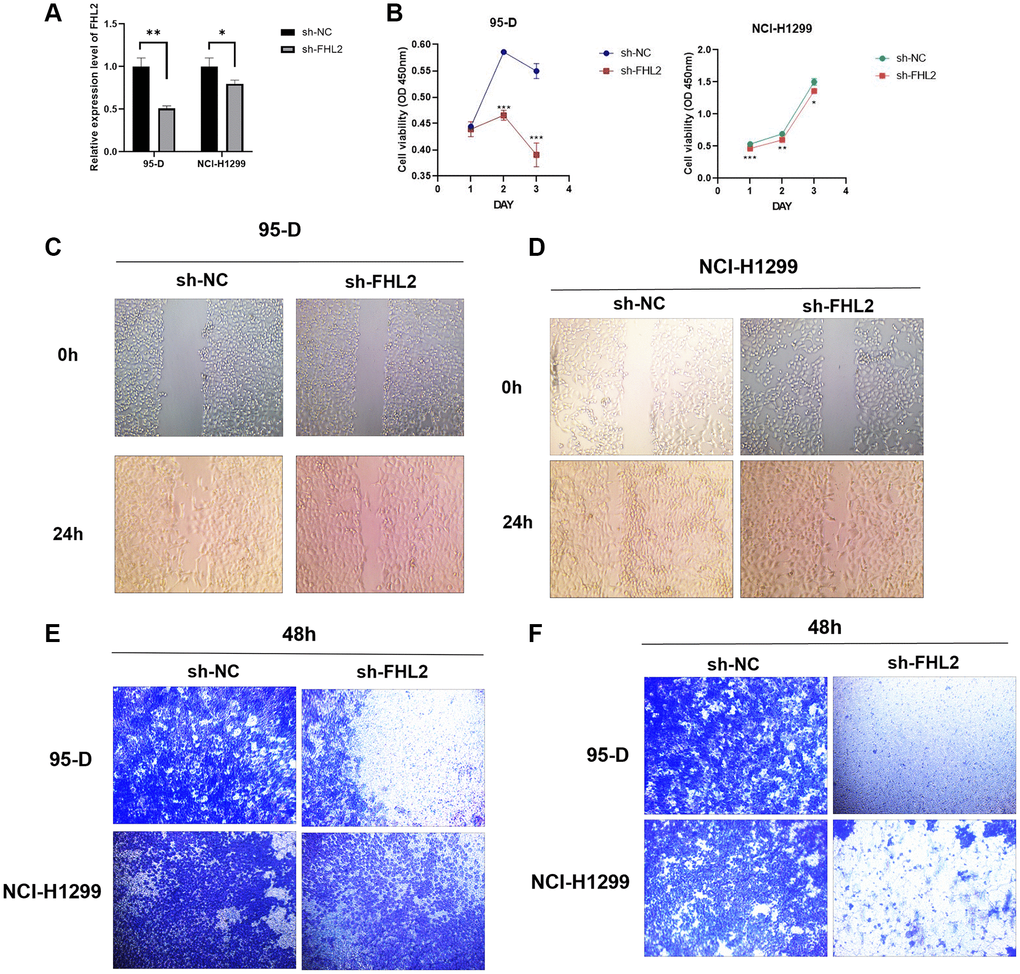
Figure 10. Effects of FHL2 on proliferation, migration, and invasion of NSCLC. (A) qRT-PCR detected the efficiency of transfection. (B) CCK8 detected the viability of NSCLC cells. (C, D) Wound healing experiment detected the migration ability of NSCLC cells. (E) Transwell experiment detected the migration ability of NSCLC cells. (F) Transwell experiment detected the invasive ability of NSCLC cell. *P < 0.05; **P < 0.01; ***P < 0.001.
Discussion
Globally, NSCLC is the second most frequent malignancy with the mortality gradually increased [2, 3]. New molecular biomarkers that can improve the survival and predicting prognosis of NSCLC are urgently required. This study focused on FHL2 mRNA expression and revealed the crucial role of FHL2 in NSCLC. In addition, FHL2 expression exhibited independent prognostic value of NSCLC, making it a potential biomarker in the near future.
FHL2 comprises four and one-half highly preserved cysteine-rich LIM homeodomains. These unique structures lead to interaction of FHL2 with many different proteins [9]. The function of FHL2 in cancer is especially intriguing because it may function as a tumor inhibitor or an oncogenic protein [5]. Previous reports have shown that FHL2 facilitates cell proliferation in glioblastoma [6], gastric, colon [7], and cervical [8] cancers, but inhibits neuroblastoma [10] and myeloid malignancies [11]. In this study, FHL2 has been observed to be overexpressed in patients with lung malignancy (P < 2.2e−16). Additionally, we also observe that higher FHL2 was corelated with poor outcomes of NSCLC patient.
The detailed molecular mechanisms of the oncogenic effects of FHL2 remain poorly understood. FHL2 has been involved in the Wnt/β-catenin signaling cascades [9]. Wingless/integrated-mediated signal pathways are known to adjust stemness and development, but are also highly associated with cancer [12–14]. Activated Wnt signal pathway has been identified to mediate NSCLC initiation and progression by modulating cell proliferation, apoptosis, and epithelial-to-mesenchymal transition [15, 16].
The Wnt signal pathway is commonly separated from β-catenin-dependent and β-catenin-independent signaling [12, 13]. Wnt ligand combining to Frizzled receptors and LRP co-receptors activates the β-catenin-dependent pathway. These interactions interrupt the APC/Axin/ CK1A/GSK3β complex, which lead to β-catenin translocating and amassing in the nucleus [12, 13]. FHL2 was first reported to be a coactivator of β-catenin [17] that drove differentiation of mouse myoblasts [18]. In colon cancer and osteosarcoma, FHL2 can make nuclear β-catenin stable, prompting β-catenin transactivation activity [19, 20]. FHL2 was also reported to promote tubular EMT through modulating β-catenin signaling pathway in fibrotic kidneys [21]. In agreement with aberrant Wnt/β-catenin signaling, the gene expression of FHL2 has been shown to be dysregulated in a wide variety of cancers [8, 20, 22, 23]. As a coactivator of β-catenin [17], FHL2 activates the Wnt signaling cascade, EMT signals, and downstream cell cycle progression.
Consistently, FHL2 was highly expressed in lung cancer patients. At the same time, the results of the boxplot indicated that the high expression of FHL2 was associated with the poor clinical characteristics of the patients. We found that high FHL2 expression was associated with worse OS and RFS. Also, through nomogram and decision curve results, we found that FHL2 can serve as an independent predictive model for predicting patient OS and RFS.
GSEA analysis revealed findings on the mechanism by which FHL2 affects lung cancer progression. We found that FHL2 contributes to lung cancer progression by inducing glycolysis and promoting unfolded protein responses. However, how FHL2 regulates glycolysis and unfolded protein reflection remains to be further explored. In addition, in vitro experiments also showed that FHL2 is highly expressed in lung cancer cells, and the high expression of FHL2 is related to the enhancement of the proliferation, migration, and invasion ability.
In conclusion, FHL2 has great potential to predict the prognosis of lung cancer. The further study needs to be implemented to explore the molecular mechanism. In vivo study may further confirm these discoveries. The high expression level of FHL2 in lung cancer can be used as an independent predictor of prognosis in clinical practice.
Materials and Methods
Clinical data
The complete RNA-Seq expression information and corresponding clinical characteristics were acquired from TCGA database. The FHL2 mRNA expression was calculated as log2 (x + 1) and converted into RSEM normalized counts.
Nomogram plotting
The lung cancer patients were grouped according to FHL2 expression. Based on the different FHL2 expression, the T/N/M classification, stage, grade, and prognosis of patients were compared.
GSEA assay
The TCGA database was screened, followed by performing GSEA analysis through the online website to explore the relationship between FHL2 expression and Glycolysis and unfolded protein reflection.
Cell culture
Human lung cancer cell lines 95-D and NCI-H1299 were cultured in 1640 medium containing 10% fetal bovine serum and 1% penicillin-streptomycin solution in a 5% CO2 humidified incubator at 37°C.
Plasmid and transfection
The sh-FHL2 plasmid and sh-control plasmid were purchased (Miaoling Bio, China), followed by transfection into the cell and generation of the stable clone.
RT-qPCR
All the reagents and kits were purchased from Invitrogen (USA). The TRIzol was used to extract total RNA. The reverse transcription was performed using 1 mL of extracted RNA. Finally, the real time quantitative PCR (RT-qPCR) was carried out.
Wound healing assay
The cells were scratched to form a 1-mm wide gap, and cultured for 2 days [24]. In order to measure the breadth of the injured region, pictures were obtained at 0 and 48 hours.
Transwell invasion assay
The plates with 8 μm pore were used, covering with Matrigel (Corning, USA). In the Transwell’s upper chamber, cells were added. Then, the crystal violet-stained cells invasive to the lower surface were observed.
CCK-8 assay
The cells were seeded with density of 1 × 10⁵/well [25]. After culturing for 24 h, DOX was added. Then, 10 μL CCK-8 reagent was added and the absorbance at 450 nm was measured.
Statistical analysis
All materials were retrospectively evaluated using R (version 3.5.1) [26]. We utilized non-parametric rank sum examinations to evaluate FHL2 mRNA expression levels. Wilcoxon rank sum examinations were utilized to contrast two subgroups, and Kruskal–Wallis tests were utilized for comparing multiple subgroups. We utilized the pROC package to depict Receiver Operating Characteristic (ROC) curves for the analysis of FHL2 diagnostic ability through calculating area under ROC curves (AUC) values and measuring ideal cutoff point [27]. In addition, association between clinical characteristics and FHL2 expression was evaluated by chi-square tests with Fisher’s exact test. Kaplan–Meier curve was utilized to study survival status. Univariate Cox and multivariate Cox analysis were utilized to study the independent prognostic ability of FHL2 in lung cancer was identified through. P < 0.05 was statistically significant.
Author Contributions
Y.J., and Y.L. designed this study and had full access to all of data in the study; Y.J., and J.W. extracted the data; Z.L., and J.Z. analyzed and interpreted the data; Y.J., and Z.L. performed the experiments; Y.J., and Y.L wrote the paper. All authors reviewed the manuscript.
Conflicts of Interest
The authors declare no conflicts of interest related to this study.
Funding
This study was funded by Special Project for Health Talents of Jilin Provincial Department of Finance (No. JLSWSRCZX2021-071). This work was in part supported by grants from the Finance Department of Jilin Province (No. JLSCZD2021-071).
References
- 1. Nasim F, Sabath BF, Eapen GA. Lung Cancer. Med Clin North Am. 2019; 103:463–73. https://doi.org/10.1016/j.mcna.2018.12.006 [PubMed]
- 2. Chu GCW, Lazare K, Sullivan F. Serum and blood based biomarkers for lung cancer screening: a systematic review. BMC Cancer. 2018; 18:181. https://doi.org/10.1186/s12885-018-4024-3 [PubMed]
- 3. Rankin NM, McWilliams A, Marshall HM. Lung cancer screening implementation: Complexities and priorities. Respirology. 2020 (Suppl 2); 25:5–23. https://doi.org/10.1111/resp.13963 [PubMed]
- 4. Jacobsen MM, Silverstein SC, Quinn M, Waterston LB, Thomas CA, Benneyan JC, Han PKJ. Timeliness of access to lung cancer diagnosis and treatment: A scoping literature review. Lung Cancer. 2017; 112:156–64. https://doi.org/10.1016/j.lungcan.2017.08.011 [PubMed]
- 5. Verset L, Feys L, Trépant AL, De Wever O, Demetter P. FHL2: a scaffold protein of carcinogenesis, tumour-stroma interactions and treatment response. Histol Histopathol. 2016; 31:469–78. https://doi.org/10.14670/HH-11-709 [PubMed]
- 6. Sun L, Yu S, Xu H, Zheng Y, Lin J, Wu M, Wang J, Wang A, Lan Q, Furnari F, Cavenee W, Purow B, Li M. FHL2 interacts with EGFR to promote glioblastoma growth. Oncogene. 2018; 37:1386–98. https://doi.org/10.1038/s41388-017-0068-0 [PubMed]
- 7. Wang J, Yang Y, Xia HH, Gu Q, Lin MC, Jiang B, Peng Y, Li G, An X, Zhang Y, Zhuang Z, Zhang Z, Kung HF, Wong BC. Suppression of FHL2 expression induces cell differentiation and inhibits gastric and colon carcinogenesis. Gastroenterology. 2007; 132:1066–76. https://doi.org/10.1053/j.gastro.2006.12.004 [PubMed]
- 8. Jin H, Lee K, Kim YH, Oh HK, Maeng YI, Kim TH, Suh DS, Bae J. Scaffold protein FHL2 facilitates MDM2-mediated degradation of IER3 to regulate proliferation of cervical cancer cells. Oncogene. 2016; 35:5106–18. https://doi.org/10.1038/onc.2016.54 [PubMed]
- 9. Johannessen M, Møller S, Hansen T, Moens U, Van Ghelue M. The multifunctional roles of the four-and-a-half-LIM only protein FHL2. Cell Mol Life Sci. 2006; 63:268–84. https://doi.org/10.1007/s00018-005-5438-z [PubMed]
- 10. Han W, Wu Z, Zhao Y, Meng Y, Si Y, Yang J, Fu X, Yu L. FHL2 interacts with and acts as a functional repressor of Id2 in human neuroblastoma cells. Nucleic Acids Res. 2009; 37:3996–4009. https://doi.org/10.1093/nar/gkp332 [PubMed]
- 11. Hou Y, Wang X, Li L, Fan R, Chen J, Zhu T, Li W, Jiang Y, Mittal N, Wu W, Peace D, Qian Z. FHL2 regulates hematopoietic stem cell functions under stress conditions. Leukemia. 2015; 29:615–24. https://doi.org/10.1038/leu.2014.254 [PubMed]
- 12. Clevers H, Nusse R. Wnt/β-catenin signaling and disease. Cell. 2012; 149:1192–205. https://doi.org/10.1016/j.cell.2012.05.012 [PubMed]
- 13. Zhan T, Rindtorff N, Boutros M. Wnt signaling in cancer. Oncogene. 2017; 36:1461–73. https://doi.org/10.1038/onc.2016.304 [PubMed]
- 14. Anastas JN, Moon RT. WNT signalling pathways as therapeutic targets in cancer. Nat Rev Cancer. 2013; 13:11–26. https://doi.org/10.1038/nrc3419 [PubMed]
- 15. Arend RC, Londoño-Joshi AI, Straughn JM
Jr , Buchsbaum DJ. The Wnt/β-catenin pathway in ovarian cancer: a review. Gynecol Oncol. 2013; 131:772–9. https://doi.org/10.1016/j.ygyno.2013.09.034 [PubMed] - 16. Tammela T, Sanchez-Rivera FJ, Cetinbas NM, Wu K, Joshi NS, Helenius K, Park Y, Azimi R, Kerper NR, Wesselhoeft RA, Gu X, Schmidt L, Cornwall-Brady M, et al. A Wnt-producing niche drives proliferative potential and progression in lung adenocarcinoma. Nature. 2017; 545:355–9. https://doi.org/10.1038/nature22334 [PubMed]
- 17. Wei Y, Renard CA, Labalette C, Wu Y, Lévy L, Neuveut C, Prieur X, Flajolet M, Prigent S, Buendia MA. Identification of the LIM protein FHL2 as a coactivator of beta-catenin. J Biol Chem. 2003; 278:5188–94. https://doi.org/10.1074/jbc.M207216200 [PubMed]
- 18. Martin B, Schneider R, Janetzky S, Waibler Z, Pandur P, Kühl M, Behrens J, von der Mark K, Starzinski-Powitz A, Wixler V. The LIM-only protein FHL2 interacts with beta-catenin and promotes differentiation of mouse myoblasts. J Cell Biol. 2002; 159:113–22. https://doi.org/10.1083/jcb.200202075 [PubMed]
- 19. Brun J, Dieudonné FX, Marty C, Müller J, Schüle R, Patiño-García A, Lecanda F, Fromigué O, Marie PJ. FHL2 silencing reduces Wnt signaling and osteosarcoma tumorigenesis in vitro and in vivo. PLoS One. 2013; 8:e55034. https://doi.org/10.1371/journal.pone.0055034 [PubMed]
- 20. Zhang W, Jiang B, Guo Z, Sardet C, Zou B, Lam CS, Li J, He M, Lan HY, Pang R, Hung IF, Tan VP, Wang J, Wong BC. Four-and-a-half LIM protein 2 promotes invasive potential and epithelial-mesenchymal transition in colon cancer. Carcinogenesis. 2010; 31:1220–9. https://doi.org/10.1093/carcin/bgq094 [PubMed]
- 21. Cai T, Sun D, Duan Y, Qiu Y, Dai C, Yang J, He W. FHL2 promotes tubular epithelial-to-mesenchymal transition through modulating β-catenin signalling. J Cell Mol Med. 2018; 22:1684–95. https://doi.org/10.1111/jcmm.13446 [PubMed]
- 22. Nouët Y, Dahan J, Labalette C, Levillayer F, Julien B, Jouvion G, Cairo S, Vives FL, Ribeiro A, Huerre M, Colnot S, Perret C, Nhieu JT, et al. The four and a half LIM-only protein 2 regulates liver homeostasis and contributes to carcinogenesis. J Hepatol. 2012; 57:1029–36. https://doi.org/10.1016/j.jhep.2012.06.035 [PubMed]
- 23. Gabriel B, Mildenberger S, Weisser CW, Metzger E, Gitsch G, Schüle R, Müller JM. Focal adhesion kinase interacts with the transcriptional coactivator FHL2 and both are overexpressed in epithelial ovarian cancer. Anticancer Res. 2004; 24:921–7. [PubMed]
- 24. Cai H, Dai X, Guo X, Zhang L, Cao K, Yan F, Ji B, Liu Y. Ataxia telangiectasia mutated inhibitor-loaded copper sulfide nanoparticles for low-temperature photothermal therapy of hepatocellular carcinoma. Acta Biomater. 2021; 127:276–86. https://doi.org/10.1016/j.actbio.2021.03.051 [PubMed]
- 25. Cai H, Wang R, Guo X, Song M, Yan F, Ji B, Liu Y. Combining Gemcitabine-Loaded Macrophage-like Nanoparticles and Erlotinib for Pancreatic Cancer Therapy. Mol Pharm. 2021; 18:2495–506. https://doi.org/10.1021/acs.molpharmaceut.0c01225 [PubMed]
- 26. R Core Team. R: A language and environment for statistical computing. 2013.
- 27. Robin X, Turck N, Hainard A, Tiberti N, Lisacek F, Sanchez JC, Müller M. pROC: an open-source package for R and S+ to analyze and compare ROC curves. BMC Bioinformatics. 2011; 12:77. https://doi.org/10.1186/1471-2105-12-77 [PubMed]