


Introduction
Late-onset Alzheimer’s disease (AD) has a multifactorial etiology, which is affected by a complex interplay of genetic and non-genetic factors [1]. The estimates of heritability of 45% for women and 58% for men in a study of Swedish twins [2] suggest that the genetic contribution to AD pathogenesis can be substantial. However, capturing the genetic architecture of AD is challenging because of the complex interplay of genetic and non-genetic factors in its etiology. Indeed, despite discoveries of AD loci in large-scale genome-wide association studies (GWAS) [3–6], these loci are considered risk rather than causal factors for AD. The challenging role of genes in AD is exemplified by the apolipoprotein E (APOE) ε4 allele, which is the strongest individual genetic risk factor for AD. Even though the APOE gene has been studied for decades, its role in AD is not fully understood [7, 8].
The 2018 NIA-AA research framework [9–11] promoted the biological definition of AD pathology based on amyloid β (Aβ), tau, and neurodegeneration biomarkers. Positron emission tomography (PET) imaging studies identified Aβ and tau as valuable biomarkers to characterize AD development, with tau considered a more accurate AD biomarker than Aβ [12]. Cerebrospinal fluid (CSF) and plasma measurements of Aβ, particularly Aβ42 and tau, are used to facilitate AD diagnosis [13, 14]. Low levels of Aβ42 indicate accumulation of Aβ in plaques, whereas high tau levels are associated with neuronal injury [15]. The emergence of the biological definition of AD pathology opens a promising avenue in studies of the genetic architecture of AD.
Prior analyses showed that carriers of the APOE ε4 allele have lower levels of Aβ42 [16] and higher levels of tau [17] in CSF, although the latter might be controversial [18]. Given the multifactorial etiology of AD, the genetic architecture of AD and its biomarkers is likely heterogeneous. It is complicated by polygenicity, pleiotropy, and interactions with genetic and non-genetic factors. This complexity is in contrast to Mendelian traits; the traits, which may be caused by genetic mutations directly affecting protein function [19]. For example, the autosomal dominant form of early-onset AD can be caused by specific mutations in the APP, PSEN1, or PSEN2 genes [20–23].
Studies also examined a role of an interplay between the APOE variants and other genetic factors in AD. For example, Franceschi’s group identified a haplotype comprising the ε4 and rs405509_T promoter variants conferring the AD risk [24]. Haplotypes composed of non-coding variants in the APOE gene cluster were reported in [25, 26]. Roses’s group showed a pivotal role of TOMM40 poly-T rs10524523 and APOE ε2/ε3/ε4 haplotypes in AD pathogenesis [27]. Le Guen et al., [28] identified rare APOE functional variants co-inheriting with the ε4 allele and ameliorating its adverse effect. However, studies examining the relationships between combinations of genetic variants and AD biomarkers are in their infancy [29] and novel methods can be helpful for accelerating progress in the field.
A method examining differences in linkage disequilibrium (LD) structures in trait-affected and unaffected subjects was suggested to efficiently map promising associations [30]. Its advantage is that it helps identify connections between combinations of genetic variants and a complex trait. This method is well adapted to examine pairs of genetic variants, such as single nucleotide polymorphisms (SNPs). Recently, we generalized it from pairs of SNPs to triples of SNPs using the co-skewness metric [31]. Following these methods, we mapped compound genotypes—certain combinations of genetic variants—comprising rs429358 (APOE), rs2075650 (TOMM40), and rs12721046 (APOC1) SNPs to AD [31, 32]. We showed that a combination of the APOE ε4 allele (encoded by rs429358 minor allele) and minor alleles of rs2075650 and rs12721046 SNPs conferred a remarkably high risk of AD compared to the ε4-bearing compound genotypes which do not include minor alleles of rs2075650 and rs12721046 [32]. Here, we examine the associations of the APOE ε2 and ε4 alleles and the AD-risk-differentiating compound genotypes comprising rs429358, rs2075650, and rs12721046 SNPs with Aβ40, Aβ42, and tau AD biomarkers measured in CSF and plasma using data from three studies: the AD Neuroimaging Initiative (ADNI), the Atherosclerosis Risk in Communities (ARIC) study, and the Framingham Heart Study (FHS).
Results
Study overview
We performed three types of analyses. First, we evaluated mean levels of Aβ40, Aβ42, and tau in CSF and plasma and the correlation between them. Second, we examined associations of the ε4 and ε2 alleles individually with AD biomarkers to establish benchmark effects in our samples. Third, as no significant associations of the ε2 allele with AD biomarkers were identified, we explored associations of the AD-risk- differentiating ε4-bearing compound genotypes comprising rs429358, rs2075650, and rs12721046 SNPs with the selected AD biomarkers. The goal was to identify whether the ε4 allele exerted effects on the selected biomarkers independently of the TOMM40 rs2075650 and APOC1 rs12721046 SNPs or whether its effect could be modulated by the latter two SNPs.
Plasma and CSF AD biomarkers: mean levels and correlation
Table 1 and Supplementary Table 1 show that the mean levels of both baseline- and longitudinally-measured AD biomarkers vary across the study cohorts (see Methods), and they are substantially larger in CSF than in plasma. Correlation analysis of the AD biomarkers shows that CSF total tau and p-tau are perfectly correlated with the Pearson correlation coefficient r = 0.98 in ADNI (Supplementary Table 2). Given that p-tau was not available in other studies, the results for p-tau were not included.
Table 1. Baseline characteristics of the genotyped participants of European ancestry in the selected studies.
| Study | Source | N | Men (%) | Age (SD, SE), years | Aβ40 (SD, SE), pg/ml | Aβ42 (SD, SE), pg/ml | Tau (SD, SE), pg/ml | pTau (SD, SE), pg/ml | |||||||||||||||||||||||||||||||||||||||||||||||||||||||||||||||||||||||||||||||||||||||||||
| ARIC | Plasma | 1560 | 723 (46.3) | 77.4 (5.4, 0.1) | 247.0 (84.5, 2.1) | 39.1 (11.2, 0.3) | NA | NA | |||||||||||||||||||||||||||||||||||||||||||||||||||||||||||||||||||||||||||||||||||||||||||
| FHS_C1 | Plasma | 636 | 227 (35.7) | 79.8 (4.2, 0.2) | 168.3 (41.9, 1.7) | 45.4 (11.5, 0.5) | 5.0 (1.5, 0.1) | NA | |||||||||||||||||||||||||||||||||||||||||||||||||||||||||||||||||||||||||||||||||||||||||||
| FHS_C2 | Plasma | 3095 | 1443 (46.6) | 61.0 (9.5, 0.2) | 159.6 (40.5, 0.8) | 43.7 (10.3, 0.7) | 4.2 (2.7, 0.1) | NA | |||||||||||||||||||||||||||||||||||||||||||||||||||||||||||||||||||||||||||||||||||||||||||
| FHS_C3 | Plasma | 3029 | 1424 (47.0) | 45.7 (8.0, 0.1) | 242.5 (58.0, 1.1) | 42.7 (10.0, 0.2) | 4.1 (1.5, 0.02) | NA | |||||||||||||||||||||||||||||||||||||||||||||||||||||||||||||||||||||||||||||||||||||||||||
| ADNI-1 | Plasma | 612 | 374 (61.1) | 75.4 (6.7, 0.3) | 152.9 (50.5, 2.0) | 37.2 (11.3, 0.5) | 2.9 (1.6, 0.1) | NA | |||||||||||||||||||||||||||||||||||||||||||||||||||||||||||||||||||||||||||||||||||||||||||
| ADNI-1 | CSF | 350 | 212 (60.6) | 74.9 (7.1, 0.4) | 7737.3 (2352.3, 125.7) | 769.0 (352.0, 18.9) | 302.3 (118.4, 6.3) | 29.7 (13.6, 0.7) | |||||||||||||||||||||||||||||||||||||||||||||||||||||||||||||||||||||||||||||||||||||||||||
| ADNI-2/GO | CSF | 360 | 203 (56.4) | 72.9 (7.4, 0.4) | 8590.2 (2437.7, 130.1) | 920.6 (368.2, 19.4) | 271.6 (118.6, 6.3) | 25.7 (13.1, 0.7) | |||||||||||||||||||||||||||||||||||||||||||||||||||||||||||||||||||||||||||||||||||||||||||
| N denotes the number of subjects; Abbreviations: CSF: cerebrospinal fluid; SD: standard deviation; SE: standard error; NA: not available. ARIC is the Atherosclerosis Risk in Communities Study; FHS_C1, FHS_C2, and FHS_C3 denote the Framingham Heart Study parental, offspring, and grandchildren cohorts, respectively; ADNI-1 and ADNI-2/GO denote the Alzheimer’s disease Neuroimaging Initiative initial and extended cohorts, respectively. Age was defined at the time of the Alzheimer’s disease biomarker measurement. | |||||||||||||||||||||||||||||||||||||||||||||||||||||||||||||||||||||||||||||||||||||||||||||||||||
Associations of the APOE ε2 and ε4 alleles with AD biomarkers
The ε4 alleles were consistently associated (see Methods) with lower levels of both CSF and plasma Aβ42 in each cohort (Table 2 and Supplementary Table 3), despite the lack of significant correlation between them, r = 0.074 (p = 0.219) (Supplementary Table 2). Although CSF and plasma tau were weakly correlated (r = 0.155, p = 4.5 × 10⁻³), the APOE ε4 alleles were consistently associated with higher levels of CSF tau, but they were not significantly associated with plasma tau. The meta-analysis did not show significant associations with Aβ40 either in CSF or plasma, despite its modest-to-strong correlation with Aβ42, i.e., r = 0.388–0.703 in plasma and r = 0.253–0.304 in CSF. Qualitatively the same associations were observed using longitudinal measurements (Supplementary Table 3).
Table 2. Meta-analysis of the associations of the APOE ε4 allele with Alzheimer’s disease (AD) biomarkers.
| Biomarker | Source | Nreference | Nε4 | Beta | SE | P value | Direction | ||||||||||||||||||||||||||||||||||||||||||||||||||||||||||||||||||||||||||||||||||||||||||||
| Aβ40 | CSF* | 334 | 304 | −0.011 | 0.024 | 6.49E-01 | −+???? | ||||||||||||||||||||||||||||||||||||||||||||||||||||||||||||||||||||||||||||||||||||||||||||
| Aβ40 | Plasma** | 5683 | 2109 | −1.287 | 1.300 | 3.22E-01 | −?−+−− | ||||||||||||||||||||||||||||||||||||||||||||||||||||||||||||||||||||||||||||||||||||||||||||
| Aβ42 | CSF* | 259 | 292 | −0.334 | 0.034 | 1.50E-22 | −−???? | ||||||||||||||||||||||||||||||||||||||||||||||||||||||||||||||||||||||||||||||||||||||||||||
| Aβ42 | Plasma** | 5679 | 2106 | −1.903 | 0.271 | 2.18E-12 | −?−−−− | ||||||||||||||||||||||||||||||||||||||||||||||||||||||||||||||||||||||||||||||||||||||||||||
| Tau | CSF* | 341 | 302 | 0.261 | 0.031 | 6.58E-17 | ++???? | ||||||||||||||||||||||||||||||||||||||||||||||||||||||||||||||||||||||||||||||||||||||||||||
| Tau | Plasma* | 3951 | 1484 | 0.006 | 0.011 | 5.67E-01 | +?−+−? | ||||||||||||||||||||||||||||||||||||||||||||||||||||||||||||||||||||||||||||||||||||||||||||
| Nreference denotes the number of carriers of the ε33 genotype used as a reference. Nε4 shows the number of the APOE ε4 carriers defined as having either ε34 or ε44 genotype. SE denotes standard error and CSF denotes cerebrospinal fluid. Asterisks denote a gamma general linear model with a log link function (*) and an ordinary linear model (**) used for the analysis. Column “Direction” shows sign of the effect beta in individual studies in the following order: ADNI-1, ADNI-2/GO, FHS_C1, FHS_C2, FHS_C3, and ARIC. Question mark indicates missing estimates. Note, CSF biomarkers were available only in ADNI cohorts; plasma biomarkers were not available in ADNI-2/GO, and tau was not reported in ARIC. Biomarkers were measured at baseline. More details with individual-study estimates are given Supplementary Table 3. | |||||||||||||||||||||||||||||||||||||||||||||||||||||||||||||||||||||||||||||||||||||||||||||||||||
The ε2 alleles were associated only with CSF Aβ42 in the meta-analysis of the data available from baseline measurements in ADNI-1 and ADNI-2/GO (β = 0.143, p = 0.032) with a small number of subjects (N = 37), but not in longitudinal analysis of these data (β = 0.112, p = 0.280) with a larger number of observations (N = 80) (Supplementary Table 4).
Associations of compound genotypes with AD biomarkers
Given associations of the ε4 alleles with Aβ42 and tau, we examined associations of the AD-risk differentiating compound genotypes comprising the ε4-encoding rs429358, TOMM40 rs2075650, and APOC1 rs12721046 SNPs with Aβ42 and tau measured at baseline (see Table 3 and Supplementary Table 5 for notations and the results). The ε4-bearing compound genotypes were significantly associated with lower levels of CSF and plasma Aβ42 and higher levels of CSF tau regardless of minor alleles of the other two SNPs. However, the compound genotype with the ε4 alleles and no minor alleles of the other two SNPs was associated with smaller levels of plasma tau (Table 3, 100+200), whereas no significant associations were observed for carriers of the compound genotypes aggregating minor alleles of those two SNPs (Table 3, 111+222 and 1XY+2XY). No significant associations were seen for non-carriers of the ε4 alleles who have minor alleles of rs2075650 and rs12721046 (Table 3, 0XY).
Table 3. Meta-analysis of the associations of compound genotypes with Alzheimer’s disease (AD) Aβ42 and tau biomarkers.
| Biomarker | Source | Genotype | N | Beta | SE | P value | Direction | ||||||||||||||||||||||||||||||||||||||||||||||||||||||||||||||||||||||||||||||||||||||||||||
| Aβ42 | CSF | 0XY | 59 | 0.026 | 0.055 | 6.37E-01 | −+???? | ||||||||||||||||||||||||||||||||||||||||||||||||||||||||||||||||||||||||||||||||||||||||||||
| Aβ42 | CSF | 100+200 | 56 | −0.272 | 0.057 | 2.13E-06 | −−???? | ||||||||||||||||||||||||||||||||||||||||||||||||||||||||||||||||||||||||||||||||||||||||||||
| Aβ42 | CSF | 111+222 | 178 | −0.341 | 0.039 | 2.46E-18 | −−???? | ||||||||||||||||||||||||||||||||||||||||||||||||||||||||||||||||||||||||||||||||||||||||||||
| Aβ42 | CSF | 1XY+2XY | 242 | −0.373 | 0.037 | 2.18E-24 | −−???? | ||||||||||||||||||||||||||||||||||||||||||||||||||||||||||||||||||||||||||||||||||||||||||||
| Aβ42 | CSF | 000 | 237 | Reference | |||||||||||||||||||||||||||||||||||||||||||||||||||||||||||||||||||||||||||||||||||||||||||||||
| Aβ42 | Plasma | 0XY | 951 | 0.351 | 0.364 | 3.35E-01 | −?−−++ | ||||||||||||||||||||||||||||||||||||||||||||||||||||||||||||||||||||||||||||||||||||||||||||
| Aβ42 | Plasma | 100+200 | 396 | −2.305 | 0.551 | 2.82E-05 | −?−−−− | ||||||||||||||||||||||||||||||||||||||||||||||||||||||||||||||||||||||||||||||||||||||||||||
| Aβ42 | Plasma | 111+222 | 1462 | −1.582 | 0.312 | 4.14E-07 | −?−−−− | ||||||||||||||||||||||||||||||||||||||||||||||||||||||||||||||||||||||||||||||||||||||||||||
| Aβ42 | Plasma | 1XY+2XY | 1821 | −1.656 | 0.287 | 7.98E-09 | −?−−−− | ||||||||||||||||||||||||||||||||||||||||||||||||||||||||||||||||||||||||||||||||||||||||||||
| Aβ42 | Plasma | 000 | 5549 | Reference | |||||||||||||||||||||||||||||||||||||||||||||||||||||||||||||||||||||||||||||||||||||||||||||||
| Tau | CSF | 0XY | 70 | 0.088 | 0.050 | 7.97E-02 | ++???? | ||||||||||||||||||||||||||||||||||||||||||||||||||||||||||||||||||||||||||||||||||||||||||||
| Tau | CSF | 100+200 | 56 | 0.233 | 0.056 | 2.85E-05 | ++???? | ||||||||||||||||||||||||||||||||||||||||||||||||||||||||||||||||||||||||||||||||||||||||||||
| Tau | CSF | 111+222 | 189 | 0.293 | 0.035 | 4.87E-17 | ++???? | ||||||||||||||||||||||||||||||||||||||||||||||||||||||||||||||||||||||||||||||||||||||||||||
| Tau | CSF | 1XY+2XY | 253 | 0.294 | 0.032 | 6.75E-20 | ++???? | ||||||||||||||||||||||||||||||||||||||||||||||||||||||||||||||||||||||||||||||||||||||||||||
| Tau | CSF | 000 | 326 | Reference | |||||||||||||||||||||||||||||||||||||||||||||||||||||||||||||||||||||||||||||||||||||||||||||||
| Tau | Plasma | 0XY | 647 | 0.009 | 0.013 | 4.91E-01 | −?−+−? | ||||||||||||||||||||||||||||||||||||||||||||||||||||||||||||||||||||||||||||||||||||||||||||
| Tau | Plasma | 100+200 | 289 | −0.045 | 0.018 | 1.28E-02 | +?−−−? | ||||||||||||||||||||||||||||||||||||||||||||||||||||||||||||||||||||||||||||||||||||||||||||
| Tau | Plasma | 111+222 | 1033 | −0.010 | 0.011 | 3.66E-01 | +?−−−? | ||||||||||||||||||||||||||||||||||||||||||||||||||||||||||||||||||||||||||||||||||||||||||||
| Tau | Plasma | 1XY+2XY | 1280 | −0.002 | 0.010 | 8.42E-01 | +?−−−? | ||||||||||||||||||||||||||||||||||||||||||||||||||||||||||||||||||||||||||||||||||||||||||||
| Tau | Plasma | 000 | 3913 | Reference | |||||||||||||||||||||||||||||||||||||||||||||||||||||||||||||||||||||||||||||||||||||||||||||||
| Column “Genotype” shows compound genotypes encoded by triples of numbers and X and Y letters. Numbers show the counts of minor alleles (i.e., 0, 1, 2) in rs429358_T/c, rs2075650_A/g or rs12721046_G/a SNP, in that order. The upper/lower case denotes here major/minor allele. The most frequent 000 genotype denotes the major allele homozygote for all three SNPs, i.e., rs429358_TT, rs2075650_AA, rs12721046_GG. The 100+200 genotype indicates rs429358_Tc, rs2075650_AA, rs12721046_GG (100) and rs429358_cc, rs2075650_AA, rs12721046_GG (200). The 111+222 genotype denotes rs429358_Tc, rs2075650_Ag, rs12721046_Ga (111) and rs429358_cc, rs2075650_gg, rs12721046_aa (222). Letters X and Y indicate aggregation of minor alleles of rs2075650 and rs12721046, respectively. Then, 0XY aggregates all non-ε4 genotypes except 000. The 1XY+2XY genotype aggregates rs429358_Tc (1) and rs429358_cc (2) and all genotypes of rs2075650 (X) and rs12721046 (Y), except major allele homozygote of both SNPs, rs2075650_AA and rs12721046_GG (00), because it is included in the 100+200 genotype. Column “Direction” shows sign of the effect beta in individual studies in the following order: ADNI-1, ADNI-2/GO, FHS_C1, FHS_C2, FHS_C3, and ARIC. Question mark indicates missing estimates. Note, cerebrospinal fluid (CSF) biomarkers were available only in ADNI cohorts; plasma biomarkers were not available in ADNI-2/GO, and tau was not reported in ARIC. A gamma general linear model with a log link function was used for all biomarkers except Aβ42 measured in plasma. SE denotes standard error. More details with individual-study estimates are given Supplementary Table 5. | |||||||||||||||||||||||||||||||||||||||||||||||||||||||||||||||||||||||||||||||||||||||||||||||||||
The ε4-bearing compound genotypes having (111+222 and 1XY+2XY) and not having (100+200) minor alleles of rs2075650 and rs12721046 represent polygenic profiles conferring higher and lower AD risk, respectively [32]. Then, we quantified potential differences in the associations of these compound genotypes with Aβ42 and tau (Table 4 and Supplementary Table 6). No significant differences in the associations of these ε4-bearing higher and lower AD risk compound genotypes with CSF and plasma Aβ42 were identified. Carrying the ε4 allele and minor alleles of rs2075650 and rs12721046 was associated with significantly higher levels of plasma tau compared to having the ε4 allele and no minor alleles of these two SNPs, β = 0.047, p = 0.023 (Table 4, 1XY+2XY), consistently across all cohorts (Supplementary Table 6). The same effect direction was also observed for CSF tau in the meta-analysis, β = 0.060, p = 0.270, and each cohort (Supplementary Table 6), although the estimates did not attain the significance due to a 5-fold smaller sample with CSF tau than plasma tau. Because plasma and CSF tau were measured in ADNI-1, we were able to examine the association of the aggregated compound genotype 1XY+2XY with CSF tau with adjustment for plasma tau. This analysis did not show the mediating effect of plasma tau because the difference in the associations between the adjusted (β = 0.026, p = 0.700) and unadjusted (β = 0.030, p = 0.650) models by plasma tau in ADNI-1 was trivial.
Table 4. Comparative meta-analysis of the associations of the selected compound genotypes with Alzheimer’s disease (AD) Aβ42 and tau biomarkers.
| Biomarker | Source | Genotype | N | Beta | SE | P value | Direction | ||||||||||||||||||||||||||||||||||||||||||||||||||||||||||||||||||||||||||||||||||||||||||||
| Aβ42 | CSF | 111+222 | 178 | -0.054 | 0.062 | 3.77E-01 | −−???? | ||||||||||||||||||||||||||||||||||||||||||||||||||||||||||||||||||||||||||||||||||||||||||||
| Aβ42 | CSF | 1XY+2XY | 242 | -0.091 | 0.060 | 1.32E-01 | −−???? | ||||||||||||||||||||||||||||||||||||||||||||||||||||||||||||||||||||||||||||||||||||||||||||
| Aβ42 | CSF | 100+200 | 56 | Reference | |||||||||||||||||||||||||||||||||||||||||||||||||||||||||||||||||||||||||||||||||||||||||||||||
| Aβ42 | Plasma | 111+222 | 1462 | 0.619 | 0.569 | 2.77E-01 | −?++++ | ||||||||||||||||||||||||||||||||||||||||||||||||||||||||||||||||||||||||||||||||||||||||||||
| Aβ42 | Plasma | 1XY+2XY | 1821 | 0.509 | 0.553 | 3.57E-01 | −?++++ | ||||||||||||||||||||||||||||||||||||||||||||||||||||||||||||||||||||||||||||||||||||||||||||
| Aβ42 | Plasma | 100+200 | 396 | Reference | |||||||||||||||||||||||||||||||||||||||||||||||||||||||||||||||||||||||||||||||||||||||||||||||
| Tau | CSF | 111+222 | 189 | 0.066 | 0.057 | 2.46E-01 | ++???? | ||||||||||||||||||||||||||||||||||||||||||||||||||||||||||||||||||||||||||||||||||||||||||||
| Tau | CSF | 1XY+2XY | 253 | 0.060 | 0.054 | 2.70E-01 | ++???? | ||||||||||||||||||||||||||||||||||||||||||||||||||||||||||||||||||||||||||||||||||||||||||||
| Tau | CSF | 100+200 | 56 | Reference | |||||||||||||||||||||||||||||||||||||||||||||||||||||||||||||||||||||||||||||||||||||||||||||||
| Tau | Plasma | 111+222 | 1033 | 0.033 | 0.021 | 1.25E-01 | +?+++? | ||||||||||||||||||||||||||||||||||||||||||||||||||||||||||||||||||||||||||||||||||||||||||||
| Tau | Plasma | 1XY+2XY | 1280 | 0.047 | 0.021 | 2.27E-02 | +?+++? | ||||||||||||||||||||||||||||||||||||||||||||||||||||||||||||||||||||||||||||||||||||||||||||
| Tau | Plasma | 100+200 | 289 | Reference | |||||||||||||||||||||||||||||||||||||||||||||||||||||||||||||||||||||||||||||||||||||||||||||||
| Column “Genotype” shows compound genotypes encoded by triples of numbers and X and Y letters; these notations are detailed in Table 3 footnote. Column “Direction” shows sign of the effect beta in individual studies in the same order as in Table 3. A gamma general linear model with a log link function was used for all biomarkers except Aβ42 measured in plasma. SE denotes standard error. CSF denotes cerebrospinal fluid. More details with individual-study estimates are given Supplementary Table 6. | |||||||||||||||||||||||||||||||||||||||||||||||||||||||||||||||||||||||||||||||||||||||||||||||||||
We found that excluding carriers of the ε2 alleles did not make a difference (Supplementary Table 7).
Discussion
We performed the analysis of the associations of the APOE ε2 and ε4 alleles and polygenic profiles represented by combinations of variants of the ε4 encoding rs429358, TOMM40 rs2075650, and APOC1 rs12721046 SNPs with CSF and plasma Aβ40, Aβ42, and tau AD biomarkers. Our primary finding is that the ε4-bearing polygenic profiles conferring higher and lower AD risks are differently associated with tau but not Aβ42. The other main results of our work are characterizations of the associations of the APOE ε2 and ε4 alleles with Aβ40, Aβ42, and tau biomarkers in ADNI-1, ADNI-2/GO, ARIC, and three FHS cohorts.
APOE ε2 and ε4 alleles and AD biomarkers
Our analysis confirmed robust associations of the ε4 alleles with both plasma and CSF Aβ42 levels [17] (Table 2). Unlike Aβ42, no significant associations of the ε4 allele with Aβ40 were identified despite a relatively high correlation between these biomarkers. By showing the robust and highly significant associations of the ε4 allele with CSF tau, our analysis supports previous findings on the connections between the ε4 allele and tau aggregation [17, 33, 34]. Meanwhile, we report no significant associations of the ε4 allele with plasma tau (Table 2).
We show that the ε2 allele is associated with CSF Aβ42 at nominal significance in the ADNI sample, which corroborates the results of previous analysis in this sample [35]. Nevertheless, longitudinal analysis using a larger number of CSF Aβ42 measurements from multiple visits did not confirm the significance of this association. However, ADNI sample includes relatively old subjects (Table 1), and longitudinal assessment was done at even older ages (Supplementary Table 1). Because studies showed that the ε2 allele might not be associated with CSF Aβ42 at older ages [36], the addition of Aβ42 measurements at older ages affected the significance of the estimate in our study. The ε2 allele was not significantly associated with plasma Aβ42 and CSF and plasma Aβ40 and tau (Supplementary Table 4).
Polygenic profiles and AD biomarkers
Our prior analysis identified that the ε4-bearing compound genotypes examined in the current study of AD biomarkers exerted 89% (OR [odds ratio] = 1.89, p = 4.69 × 10⁻¹³) higher odds of AD when the ε4 alleles clustered with minor alleles of TOMM40 rs2075650 and APOC1 rs12721046 SNPs than major alleles of these two SNPs, i.e., when the 1XY+2XY compound genotype (carriers of the ε4 alleles who also carry minor alleles of rs2075650 and rs12721046) was contrasted by 100+200 genotype (carriers of the ε4 alleles who do not carry minor alleles of rs2075650 and rs12721046) [32].
In this study, we show no significant difference in the associations of the 1XY+2XY and 100+200 compound genotypes with either plasma or CSF Aβ42. This result implies that the association of the ε4 allele with Aβ42 is likely due to this allele itself because its association is not significantly modulated by minor alleles of rs2075650 and rs12721046. In contrast, a significant difference in the associations of the 1XY+2XY and 100+200 compound genotypes with plasma tau (Table 4) (and, potentially, with CSF tau, Supplementary Table 6) suggests joint roles of the ε4 allele and minor alleles of rs2075650 and rs12721046 in tau aggregation. Because the 1XY+2XY compound genotype entails 89% higher odds of AD than the 100+200 genotype, the 1XY+2XY genotype is tighter linked to neurodegeneration than 100+200. Therefore, the identified difference in the associations of the ε4-bearing polygenic profiles conferring higher and lower AD risks is tied to tau but not Aβ.
Insights on potential APOE-related mechanism of AD
Our results align with prior findings based on the associations of the ε4 alleles with AD biomarkers. Differential associations of the ε4-bearing polygenic profiles with AD biomarkers help clarify connections of the ε4 allele with AD biomarkers and the role of Aβ and tau pathologies in AD pathogenesis. Indeed, studies showed that Aβ42 was tighter linked with the ε4 allele than clinically diagnosed cognitive impairment (AD or MCI), whereas tau and neurodegeneration were stronger associated with cognitive impairment than the ε4 alleles [15] (Figure 1). The CSF Aβ42 appears to be independently associated with AD and the ε4 alleles, as was shown in [16] and corroborated in [37]. PET imaging showed a tighter linkage of neurodegeneration to tau pathology than Aβ pathology [38]. These findings implicate the role of the ε4 alleles in AD via both Aβ and tau pathologies. They emphasize the primary role of the ε4 alleles in Aβ pathology, the reduced role of this allele in tau pathology, and the stronger link of tau with neurodegeneration. These findings support the mechanism that Aβ pathology is pronounced before the emergence of the AD clinical manifestation, whereas AD manifestation develops due to neurodegeneration [12, 15, 39]. Then, our results are aligned with these findings because: (i) the polygenic profile comprising the ε4 allele and minor alleles of rs2075650 and rs12721046 is a proxy for cognitive impairment because it is tied to higher AD risk (ε4-HRP-AD), (ii) this higher-AD-risk profile is differentiated from the lower-AD-risk profile (ε4-LRP-AD) based on the associations with tau, and (iii) this profile is not differentiated based on the associations with Aβ42. These insights indicate that the ε4 allele plays a role in Aβ pathology, whereas its role in tau pathology is modulated by minor alleles of TOMM40 rs2075650 and APOC1 rs12721046 SNPs when they are clustered in the higher-AD-risk profile. Therefore, our findings suggest that modulation of the effect of the ε4 allele by TOMM40 and APOC1 variants indicates a potential genetic mechanism of differential roles of Aβ and tau in AD pathogenesis.
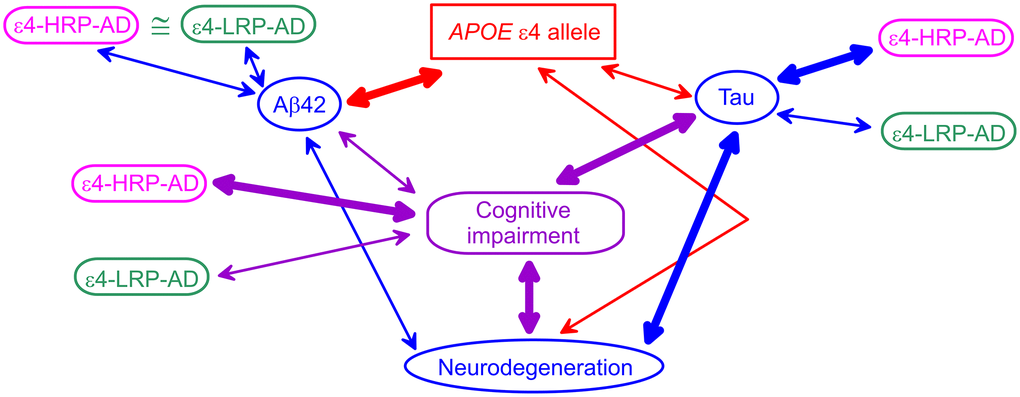
Figure 1. A schematic diagram of potential APOE-related mechanism of Alzheimer’s disease (AD). Blue ovals indicate AD biomarkers. The red rectangle shows the APOE ε4 allele. The purple rounded rectangle indicates cognitive impairment (AD or mild cognitive impairment). Magenta and green rounded rectangles denote the ε4-bearing higher-AD-risk profile (ε4-HRP-AD) and lower-AD-risk profile (ε4-LRP-AD), respectively. The thickness of the arrows denotes tighter (thick lines) and weaker (thin lines) links between genetic variants, AD biomarkers, and cognitive impairment.
Limitations
We acknowledge the limitations of this study. First, the samples used in this analysis were not optimal to examine the roles of compound genotypes comprising minor allele homozygotes of rs429358, rs2075650, and rs12721046 SNPs. Second, we did not explore the potential roles of haplotypes containing these SNPs due to the limited number of minor allele homozygotes. Third, further analyses using larger samples are needed to robustly examine associations of compound genotypes with CSF Aβ and tau. Fourth, we did not look at the potential roles of sex due to the limited sample size, particularly for CSF measurements.
Materials and Methods
Study cohorts
The data for this paper were from the ADNI initial (ADNI-1) and extended (ADNI-2/GO) cohorts [40, 41], the ARIC study [42], and the FHS parental (FHS_C1), offspring (FHS_C2), and grandchildren (FHS_C3) cohorts [43]. The basic characteristics of the available samples are given in Table 1.
AD biomarkers
Alzheimer's disease neuroimaging initiative
Data used in the preparation of this article were obtained from the ADNI database (https://adni.loni.usc.edu/). The ADNI was launched in 2003 as a public-private partnership, led by Principal Investigator Michael W. Weiner, MD. The primary goal of ADNI has been to test whether serial magnetic resonance imaging (MRI), PET, other biological markers, and clinical and neuropsychological assessment can be combined to measure the progression of mild cognitive impairment (MCI) and early AD. For up-to-date information, see https://adni.loni.usc.edu/.
Concentrations of Aβ42 and Aβ40 in plasma were measured using the Luminex xMAP platform and Innogenetics INNO-BIA AlzBio3 immunoassay reagents (Innogenetics NV, Ghent, Belgium). Plasma tau was measured in ADNI-1 and it was analyzed by the Single-Molecule array (Simoa) technique and the Human total tau assay. Concentrations of Aβ42, tau, and p-tau181 (p-tau) in CSF were assessed using an automated Elecsys cobas e 601 tool based on Roche Elecsys immunoassays [44]. CSF samples were collected in ADNI-1 and ADNI-2/GO between 2005 and 2016. In addition, immunoassay-independent measurements of CSF Aβ (Aβ40 and Aβ42) were done using a candidate reference 2D-UPLC/tandem mass spectrometry method.
Atherosclerosis risk in communities study
Plasma Aβ40 and Aβ42 concentrations were measured at the 5th examination. Amyloid was quantified by the Department of Molecular Pharmacology and Experimental Therapeutics at Mayo Clinic (Jacksonville, FL) from August to December 2014 using the INNO- BIA assay (Innogenetics NV, Ghent, Belgium). The Luminex 200 IS Total system was used for detecting fluorescence emitted by beads (xMAP microspheres; conjugate 1A) that were bound to Aβ40 and Aβ42 [45]. The minimal detectable levels for Aβ42 and Aβ40 were 12 pg/ml and 15 pg/ml, respectively [46, 47].
Framingham heart study
Plasma Aβ42 and Aβ40 concentrations were measured at the 23rd examination in FHS_C1, the 7th examination in FHS_C2, and the 2nd examination in FHS_C3 cohorts. Amyloid was quantified by the same Mayo Clinic facility as for ARIC from June to August 2012 and from January to June 2014 using the same Innogenetics NV assays. The minimal detectable levels were 12pg/ml for Aβ40 and 5pg/ml for Aβ42. Plasma tau was measured in blood samples obtained at the 28th examination in FHS_C1, the 8th examination in FHS_C2, and the 2nd examination in FHS_C3. Plasma samples were assayed from February to March 2017. Total tau was measured by Quanterix (Lexington, MA, USA) using a Simoa™ tau 2.0 Kit and a Simoa HD-1 analyzer. This is a molecule enzyme-linked immunosorbent assay (digital ELISA) with a minimum detectable level of 0.019 pg/ml [48].
Genotypes
We examined associations of the APOE ε4 and ε2 alleles encoded by minor alleles of rs429358 (T/c; upper/lower case denotes here major/minor allele) and rs7412 (C/t), respectively, and compound genotypes comprising rs429358, rs2075650 (TOMM40, A/g), and rs12721046 (APOC1, G/a) SNPs. To maximize the sample size, missing genotypes for some subjects in each study were imputed (Michigan Imputation Server, HRC panel). We retained genotypes with high imputation quality (r2 > 0.8).
The ε4 allele was defined in the absence of the ε2 allele, i.e., by ε3/ε4 and ε4/ε4 genotypes. Likewise, the ε2 allele was defined in the absence of the ε4 allele, i.e., by ε2/ε3 and ε2/ε2 genotypes. The triple of rs429358, rs2075650, and rs12721046 SNPs, which are in about the same moderate pair-wise linkage disequilibrium r2 ≈ 0.49, was selected because its minor allele compound genotypes conferred an exceptionally high risk of AD [31, 32]. To streamline notations for triples, we used definitions based on the counts of minor alleles (i.e., 0, 1, 2) in an SNP, as detailed in Table 3 footnotes.
Statistical analysis
The associations of the ε4 or ε2 allele and compound genotypes of interest with AD biomarkers were evaluated using their baseline (Table 1) and longitudinal (Supplementary Table 1) measurements. We used the ε3/ε3 genotype as a reference in the analyses of the ε4 or ε2 allele. References in the analyses of compound genotypes varied and are shown in the corresponding tables. AD biomarkers were used as outcomes. We employed the glm and lm functions from base R, as well as the glmer and lmer functions from the lme4 package [49]. Biomarkers CSF Aβ40, Aβ42, tau, and p-tau, and plasma tau showed gamma-like distributions; therefore, functions glm and glmer were used to run gamma general linear models with a log link function. The regression coefficients beta in these models can be interpreted as a fraction (or percentage) of change of a continuous outcome. All models were adjusted for sex, age, and age squared. If the model had convergence issues, age squared was removed. The analysis using longitudinal measurements was run in ADNI, and required the use of lmer and glmer to account for the correlation between repeated measurements on the individual. In FHS lmer and glmer were used to account for familial correlation. To examine the potential role of the ε2 alleles, we also performed the analysis excluding all subjects with ε2 alleles. No other adjustments were made. Meta-analysis was performed using a fixed-effects model with inverse-variance weighting. We used p < 0.05 as a significance level.
Author Contributions
A.M.K. conceived and designed the experiment and wrote the paper, E.J.W. coded statistical tests and performed statistical analyses, Y.L., E.L., F.F., and I.C. prepared data for the analyses. All co-authors contributed to writing the paper.
Acknowledgments
This article was prepared using a data obtained through dbGaP (accession numbers phs000007.v31 [FHS] and phs000280, v.7 [ARIC]) and ADNI data obtained through the Image and Data Archive (IDA) run by the Laboratory of Neuro Imaging (LONI). See extended acknowledgment in the Supplementary Materials text.
Conflicts of Interest
The authors declare no conflicts of interest related to this study.
Ethical Statement and Consent
This study used existing data received from the data holders. Duke institutional review board approved the analysis of these data. As living subjects were not contacted in this study, informed consent was not required.
Funding
This work was supported by National Institute on Aging (grants R01AG061853, R01AG065477, R01AG070488). The funders had no role in the study design, data collection and analysis, decision to publish, or manuscript preparation. The content is solely the authors’ responsibility and does not necessarily represent the official views of the National Institutes of Health.
References
- 1. Finch CE, Kulminski AM. The Alzheimer's Disease Exposome. Alzheimers Dement. 2019; 15:1123–32. https://doi.org/10.1016/j.jalz.2019.06.3914 [PubMed]
- 2. Gatz M, Reynolds CA, Fratiglioni L, Johansson B, Mortimer JA, Berg S, Fiske A, Pedersen NL. Role of genes and environments for explaining Alzheimer disease. Arch Gen Psychiatry. 2006; 63:168–74. https://doi.org/10.1001/archpsyc.63.2.168 [PubMed]
- 3. Marioni RE, Harris SE, Zhang Q, McRae AF, Hagenaars SP, Hill WD, Davies G, Ritchie CW, Gale CR, Starr JM, Goate AM, Porteous DJ, Yang J, et al. GWAS on family history of Alzheimer's disease. Transl Psychiatry. 2018; 8:99. https://doi.org/10.1038/s41398-018-0150-6 [PubMed]
- 4. Kunkle BW, Grenier-Boley B, Sims R, Bis JC, Damotte V, Naj AC, Boland A, Vronskaya M, van der Lee SJ, Amlie-Wolf A, Bellenguez C, Frizatti A, Chouraki V, et al, and Alzheimer Disease Genetics Consortium (ADGC), and European Alzheimer’s Disease Initiative (EADI), and Cohorts for Heart and Aging Research in Genomic Epidemiology Consortium (CHARGE), and Genetic and Environmental Risk in AD/Defining Genetic, Polygenic and Environmental Risk for Alzheimer’s Disease Consortium (GERAD/PERADES). Genetic meta-analysis of diagnosed Alzheimer's disease identifies new risk loci and implicates Aβ, tau, immunity and lipid processing. Nat Genet. 2019; 51:414–30. https://doi.org/10.1038/s41588-019-0358-2 [PubMed]
- 5. Lambert JC, Ibrahim-Verbaas CA, Harold D, Naj AC, Sims R, Bellenguez C, DeStafano AL, Bis JC, Beecham GW, Grenier-Boley B, Russo G, Thorton-Wells TA, Jones N, et al, and European Alzheimer's Disease Initiative (EADI), and Genetic and Environmental Risk in Alzheimer's Disease, and Alzheimer's Disease Genetic Consortium, and Cohorts for Heart and Aging Research in Genomic Epidemiology. Meta-analysis of 74,046 individuals identifies 11 new susceptibility loci for Alzheimer's disease. Nat Genet. 2013; 45:1452–8. https://doi.org/10.1038/ng.2802 [PubMed]
- 6. Bellenguez C, Küçükali F, Jansen IE, Kleineidam L, Moreno-Grau S, Amin N, Naj AC, Campos-Martin R, Grenier-Boley B, Andrade V, Holmans PA, Boland A, Damotte V, et al, and EADB, and GR@ACE, and DEGESCO, and EADI, and GERAD, and Demgene, and FinnGen, and ADGC, and CHARGE. New insights into the genetic etiology of Alzheimer's disease and related dementias. Nat Genet. 2022; 54:412–36. https://doi.org/10.1038/s41588-022-01024-z [PubMed]
- 7. Genin E, Hannequin D, Wallon D, Sleegers K, Hiltunen M, Combarros O, Bullido MJ, Engelborghs S, De Deyn P, Berr C, Pasquier F, Dubois B, Tognoni G, et al. APOE and Alzheimer disease: a major gene with semi-dominant inheritance. Mol Psychiatry. 2011; 16:903–7. https://doi.org/10.1038/mp.2011.52 [PubMed]
- 8. Belloy ME, Napolioni V, Greicius MD. A Quarter Century of APOE and Alzheimer's Disease: Progress to Date and the Path Forward. Neuron. 2019; 101:820–38. https://doi.org/10.1016/j.neuron.2019.01.056 [PubMed]
- 9. Knopman DS, Haeberlein SB, Carrillo MC, Hendrix JA, Kerchner G, Margolin R, Maruff P, Miller DS, Tong G, Tome MB, Murray ME, Nelson PT, Sano M, et al. The National Institute on Aging and the Alzheimer's Association Research Framework for Alzheimer's disease: Perspectives from the Research Roundtable. Alzheimers Dement. 2018; 14:563–75. https://doi.org/10.1016/j.jalz.2018.03.002 [PubMed]
- 10. Silverberg N, Elliott C, Ryan L, Masliah E, Hodes R. NIA commentary on the NIA-AA Research Framework: Towards a biological definition of Alzheimer's disease. Alzheimers Dement. 2018; 14:576–8. https://doi.org/10.1016/j.jalz.2018.03.004 [PubMed]
- 11. Jack CR
Jr , Bennett DA, Blennow K, Carrillo MC, Dunn B, Haeberlein SB, Holtzman DM, Jagust W, Jessen F, Karlawish J, Liu E, Molinuevo JL, Montine T, et al, and Contributors. NIA-AA Research Framework: Toward a biological definition of Alzheimer's disease. Alzheimers Dement. 2018; 14:535–62. https://doi.org/10.1016/j.jalz.2018.02.018 [PubMed] - 12. Koutsodendris N, Nelson MR, Rao A, Huang Y. Apolipoprotein E and Alzheimer's Disease: Findings, Hypotheses, and Potential Mechanisms. Annu Rev Pathol. 2022; 17:73–99. https://doi.org/10.1146/annurev-pathmechdis-030421-112756 [PubMed]
- 13. Olsson B, Lautner R, Andreasson U, Öhrfelt A, Portelius E, Bjerke M, Hölttä M, Rosén C, Olsson C, Strobel G, Wu E, Dakin K, Petzold M, et al. CSF and blood biomarkers for the diagnosis of Alzheimer's disease: a systematic review and meta-analysis. Lancet Neurol. 2016; 15:673–84. https://doi.org/10.1016/S1474-4422(16)00070-3 [PubMed]
- 14. Li Y, Schindler SE, Bollinger JG, Ovod V, Mawuenyega KG, Weiner MW, Shaw LM, Masters CL, Fowler CJ, Trojanowski JQ, Korecka M, Martins RN, Janelidze S, et al. Validation of Plasma Amyloid-β 42/40 for Detecting Alzheimer Disease Amyloid Plaques. Neurology. 2022; 98:e688–99. https://doi.org/10.1212/WNL.0000000000013211 [PubMed]
- 15. Vemuri P, Wiste HJ, Weigand SD, Knopman DS, Shaw LM, Trojanowski JQ, Aisen PS, Weiner M, Petersen RC, Jack CR
Jr , and Alzheimer's Disease Neuroimaging Initiative. Effect of apolipoprotein E on biomarkers of amyloid load and neuronal pathology in Alzheimer disease. Ann Neurol. 2010; 67:308–16. https://doi.org/10.1002/ana.21953 [PubMed] - 16. Lautner R, Palmqvist S, Mattsson N, Andreasson U, Wallin A, Pålsson E, Jakobsson J, Herukka SK, Owenius R, Olsson B, Hampel H, Rujescu D, Ewers M, et al, and Alzheimer’s Disease Neuroimaging Initiative. Apolipoprotein E genotype and the diagnostic accuracy of cerebrospinal fluid biomarkers for Alzheimer disease. JAMA Psychiatry. 2014; 71:1183–91. https://doi.org/10.1001/jamapsychiatry.2014.1060 [PubMed]
- 17. Benson GS, Bauer C, Hausner L, Couturier S, Lewczuk P, Peters O, Hüll M, Jahn H, Jessen F, Pantel J, Teipel SJ, Wagner M, Schuchhardt J, et al. Don't forget about tau: the effects of ApoE4 genotype on Alzheimer's disease cerebrospinal fluid biomarkers in subjects with mild cognitive impairment-data from the Dementia Competence Network. J Neural Transm (Vienna). 2022; 129:477–86. https://doi.org/10.1007/s00702-022-02461-0 [PubMed]
- 18. Morris JC, Roe CM, Xiong C, Fagan AM, Goate AM, Holtzman DM, Mintun MA. APOE predicts amyloid-beta but not tau Alzheimer pathology in cognitively normal aging. Ann Neurol. 2010; 67:122–31. https://doi.org/10.1002/ana.21843 [PubMed]
- 19. Chong JX, Buckingham KJ, Jhangiani SN, Boehm C, Sobreira N, Smith JD, Harrell TM, McMillin MJ, Wiszniewski W, Gambin T, Coban Akdemir ZH, Doheny K, Scott AF, et al, and Centers for Mendelian Genomics. The Genetic Basis of Mendelian Phenotypes: Discoveries, Challenges, and Opportunities. Am J Hum Genet. 2015; 97:199–215. https://doi.org/10.1016/j.ajhg.2015.06.009 [PubMed]
- 20. Sherrington R, Rogaev EI, Liang Y, Rogaeva EA, Levesque G, Ikeda M, Chi H, Lin C, Li G, Holman K, Tsuda T, Mar L, Foncin JF, et al. Cloning of a gene bearing missense mutations in early-onset familial Alzheimer's disease. Nature. 1995; 375:754–60. https://doi.org/10.1038/375754a0 [PubMed]
- 21. Levy-Lahad E, Wasco W, Poorkaj P, Romano DM, Oshima J, Pettingell WH, Yu CE, Jondro PD, Schmidt SD, Wang K. Candidate gene for the chromosome 1 familial Alzheimer's disease locus. Science. 1995; 269:973–7. https://doi.org/10.1126/science.7638622 [PubMed]
- 22. Rogaev EI, Sherrington R, Rogaeva EA, Levesque G, Ikeda M, Liang Y, Chi H, Lin C, Holman K, Tsuda T. Familial Alzheimer's disease in kindreds with missense mutations in a gene on chromosome 1 related to the Alzheimer's disease type 3 gene. Nature. 1995; 376:775–8. https://doi.org/10.1038/376775a0 [PubMed]
- 23. Lanoiselée HM, Nicolas G, Wallon D, Rovelet-Lecrux A, Lacour M, Rousseau S, Richard AC, Pasquier F, Rollin-Sillaire A, Martinaud O, Quillard-Muraine M, de la Sayette V, Boutoleau-Bretonniere C, et al, and collaborators of the CNR-MAJ project. APP, PSEN1, and PSEN2 mutations in early-onset Alzheimer disease: A genetic screening study of familial and sporadic cases. PLoS Med. 2017; 14:e1002270. https://doi.org/10.1371/journal.pmed.1002270 [PubMed]
- 24. Lescai F, Chiamenti AM, Codemo A, Pirazzini C, D'Agostino G, Ruaro C, Ghidoni R, Benussi L, Galimberti D, Esposito F, Marchegiani F, Cardelli M, Olivieri F, et al. An APOE haplotype associated with decreased ε4 expression increases the risk of late onset Alzheimer's disease. J Alzheimers Dis. 2011; 24:235–45. https://doi.org/10.3233/JAD-2011-101764 [PubMed]
- 25. Zhou X, Chen Y, Mok KY, Kwok TCY, Mok VCT, Guo Q, Ip FC, Chen Y, Mullapudi N, Giusti-Rodríguez P, Sullivan PF, Hardy J, Fu AKY, et al, and Alzheimer’s Disease Neuroimaging Initiative. Non-coding variability at the APOE locus contributes to the Alzheimer's risk. Nat Commun. 2019; 10:3310. https://doi.org/10.1038/s41467-019-10945-z [PubMed]
- 26. Babenko VN, Afonnikov DA, Ignatieva EV, Klimov AV, Gusev FE, Rogaev EI. Haplotype analysis of APOE intragenic SNPs. BMC Neurosci. 2018; 19:16. https://doi.org/10.1186/s12868-018-0413-4 [PubMed]
- 27. Lutz MW, Crenshaw D, Welsh-Bohmer KA, Burns DK, Roses AD. New Genetic Approaches to AD: Lessons from APOE-TOMM40 Phylogenetics. Curr Neurol Neurosci Rep. 2016; 16:48. https://doi.org/10.1007/s11910-016-0643-8 [PubMed]
- 28. Le Guen Y, Belloy ME, Grenier-Boley B, de Rojas I, Castillo-Morales A, Jansen I, Nicolas A, Bellenguez C, Dalmasso C, Küçükali F, Eger SJ, Rasmussen KL, Thomassen JQ, et al, and Members of the EADB, GR@ACE, DEGESCO, DemGene, GERAD, and EADI Groups. Association of Rare APOE Missense Variants V236E and R251G With Risk of Alzheimer Disease. JAMA Neurol. 2022; 79:652–63. https://doi.org/10.1001/jamaneurol.2022.1166 [PubMed]
- 29. Lutz MW, Sundseth SS, Burns DK, Saunders AM, Hayden KM, Burke JR, Welsh-Bohmer KA, Roses AD. A Genetics-based Biomarker Risk Algorithm for Predicting Risk of Alzheimer's Disease. Alzheimers Dement (N Y). 2016; 2:30–44. https://doi.org/10.1016/j.trci.2015.12.002 [PubMed]
- 30. Zaykin DV, Meng Z, Ehm MG. Contrasting linkage-disequilibrium patterns between cases and controls as a novel association-mapping method. Am J Hum Genet. 2006; 78:737–46. https://doi.org/10.1086/503710 [PubMed]
- 31. Kulminski AM, Philipp I, Loika Y, He L, Culminskaya I. Haplotype architecture of the Alzheimer's risk in the APOE region via co-skewness. Alzheimers Dement (Amst). 2020; 12:e12129. https://doi.org/10.1002/dad2.12129 [PubMed]
- 32. Kulminski AM, Philipp I, Shu L, Culminskaya I. Definitive roles of TOMM40-APOE-APOC1 variants in the Alzheimer's risk. Neurobiol Aging. 2022; 110:122–31. https://doi.org/10.1016/j.neurobiolaging.2021.09.009 [PubMed]
- 33. Therriault J, Benedet AL, Pascoal TA, Mathotaarachchi S, Chamoun M, Savard M, Thomas E, Kang MS, Lussier F, Tissot C, Parsons M, Qureshi MNI, Vitali P, et al. Association of Apolipoprotein E ε4 With Medial Temporal Tau Independent of Amyloid-β. JAMA Neurol. 2020; 77:470–9. https://doi.org/10.1001/jamaneurol.2019.4421 [PubMed]
- 34. Risacher SL, Kim S, Shen L, Nho K, Foroud T, Green RC, Petersen RC, Jack CR
Jr , Aisen PS, Koeppe RA, Jagust WJ, Shaw LM, Trojanowski JQ, et al, and Alzheimer's Disease Neuroimaging Initiative (ADNI)†. The role of apolipoprotein E (APOE) genotype in early mild cognitive impairment (E-MCI). Front Aging Neurosci. 2013; 5:11. https://doi.org/10.3389/fnagi.2013.00011 [PubMed] - 35. Grothe MJ, Villeneuve S, Dyrba M, Bartrés-Faz D, Wirth M, and Alzheimer's Disease Neuroimaging Initiative. Multimodal characterization of older APOE2 carriers reveals selective reduction of amyloid load. Neurology. 2017; 88:569–76. https://doi.org/10.1212/WNL.0000000000003585 [PubMed]
- 36. Toledo JB, Zetterberg H, van Harten AC, Glodzik L, Martinez-Lage P, Bocchio-Chiavetto L, Rami L, Hansson O, Sperling R, Engelborghs S, Osorio RS, Vanderstichele H, Vandijck M, et al, and Alzheimer’s Disease Neuroimaging Initiative. Alzheimer's disease cerebrospinal fluid biomarker in cognitively normal subjects. Brain. 2015; 138:2701–15. https://doi.org/10.1093/brain/awv199 [PubMed]
- 37. Baek MS, Cho H, Lee HS, Lee JH, Ryu YH, Lyoo CH. Effect of APOE ε4 genotype on amyloid-β and tau accumulation in Alzheimer's disease. Alzheimers Res Ther. 2020; 12:140. https://doi.org/10.1186/s13195-020-00710-6 [PubMed]
- 38. Ossenkoppele R, Schonhaut DR, Schöll M, Lockhart SN, Ayakta N, Baker SL, O'Neil JP, Janabi M, Lazaris A, Cantwell A, Vogel J, Santos M, Miller ZA, et al. Tau PET patterns mirror clinical and neuroanatomical variability in Alzheimer's disease. Brain. 2016; 139:1551–67. https://doi.org/10.1093/brain/aww027 [PubMed]
- 39. Jack CR
Jr , Lowe VJ, Weigand SD, Wiste HJ, Senjem ML, Knopman DS, Shiung MM, Gunter JL, Boeve BF, Kemp BJ, Weiner M, Petersen RC, and Alzheimer's Disease Neuroimaging Initiative. Serial PIB and MRI in normal, mild cognitive impairment and Alzheimer's disease: implications for sequence of pathological events in Alzheimer's disease. Brain. 2009; 132:1355–65. https://doi.org/10.1093/brain/awp062 [PubMed] - 40. Weiner MW, Aisen PS, Jack CR
Jr , Jagust WJ, Trojanowski JQ, Shaw L, Saykin AJ, Morris JC, Cairns N, Beckett LA, Toga A, Green R, Walter S, et al, and Alzheimer's Disease Neuroimaging Initiative. The Alzheimer's disease neuroimaging initiative: progress report and future plans. Alzheimers Dement. 2010; 6:202–11.e7. https://doi.org/10.1016/j.jalz.2010.03.007 [PubMed] - 41. Mueller SG, Weiner MW, Thal LJ, Petersen RC, Jack C, Jagust W, Trojanowski JQ, Toga AW, Beckett L. The Alzheimer's disease neuroimaging initiative. Neuroimaging Clin N Am. 2005; 15:869–77. https://doi.org/10.1016/j.nic.2005.09.008 [PubMed]
- 42. Sharrett AR. The Atherosclerosis Risk in Communities (ARIC) Study. Introduction and objectives of the hemostasis component. Ann Epidemiol. 1992; 2:467–9. https://doi.org/10.1016/1047-2797(92)90096-9 [PubMed]
- 43. Cupples LA, Heard-Costa N, Lee M, Atwood LD, and Framingham Heart Study Investigators. Genetics Analysis Workshop 16 Problem 2: the Framingham Heart Study data. BMC Proc. 2009 (Suppl 7); 3:S3. https://doi.org/10.1186/1753-6561-3-s7-s3 [PubMed]
- 44. Bittner T, Zetterberg H, Teunissen CE, Ostlund RE
Jr , Militello M, Andreasson U, Hubeek I, Gibson D, Chu DC, Eichenlaub U, Heiss P, Kobold U, Leinenbach A, et al. Technical performance of a novel, fully automated electrochemiluminescence immunoassay for the quantitation of β-amyloid (1-42) in human cerebrospinal fluid. Alzheimers Dement. 2016; 12:517–26. https://doi.org/10.1016/j.jalz.2015.09.009 [PubMed] - 45. Blennow K, De Meyer G, Hansson O, Minthon L, Wallin A, Zetterberg H, Lewczuk P, Vanderstichele H, Vanmechelen E, Kornhuber J, Wiltfang J, Heuser I, Maier W, et al, and KND-Study Group. Evolution of Abeta42 and Abeta40 levels and Abeta42/Abeta40 ratio in plasma during progression of Alzheimer's disease: a multicenter assessment. J Nutr Health Aging. 2009; 13:205–8. https://doi.org/10.1007/s12603-009-0059-0 [PubMed]
- 46. Simino J, Wang Z, Bressler J, Chouraki V, Yang Q, Younkin SG, Seshadri S, Fornage M, Boerwinkle E, Mosley TH
Jr . Whole exome sequence-based association analyses of plasma amyloid-β in African and European Americans; the Atherosclerosis Risk in Communities-Neurocognitive Study. PLoS One. 2017; 12:e0180046. https://doi.org/10.1371/journal.pone.0180046 [PubMed] - 47. Damotte V, van der Lee SJ, Chouraki V, Grenier-Boley B, Simino J, Adams H, Tosto G, White C, Terzikhan N, Cruchaga C, Knol MJ, Li S, Schraen S, et al, and Alzheimer's Disease Neuroimaging Initiative. Plasma amyloid β levels are driven by genetic variants near APOE, BACE1, APP, PSEN2: A genome-wide association study in over 12,000 non-demented participants. Alzheimers Dement. 2021; 17:1663–74. https://doi.org/10.1002/alz.12333 [PubMed]
- 48. Pase MP, Beiser AS, Himali JJ, Satizabal CL, Aparicio HJ, DeCarli C, Chêne G, Dufouil C, Seshadri S. Assessment of Plasma Total Tau Level as a Predictive Biomarker for Dementia and Related Endophenotypes. JAMA Neurol. 2019; 76:598–606. https://doi.org/10.1001/jamaneurol.2018.4666 [PubMed]
- 49. Bates D, Mächler M, Bolker B, Walker S. Fitting Linear Mixed-Effects Models Using lme4. J Stat Softw. 2015; 67:1–48. https://doi.org/10.18637/jss.v067.i01