


Introduction
FOXM1 belonging to the conserved forkhead box (FOX) transcription factor family, significantly contributes to cancer development and progression [1]. In addition to regulating cell proliferation and migration, FOXM1 also affects angiogenesis, inflammation, chemotherapy drug resistance and radiation resistance in human cancers [2, 3]. Recent research has demonstrated that FOXM1 is overexpressed in most cancers, such as bladder cancer and cholangiocarcinoma, and related to poor prognosis [4–6]. Nevertheless, there is little research on FOXM1 in pan-cancer.
The tumor microenvironment is a complicated component composed of diversified cells and extracellular matrix, and is essential for tumorigenesis and development. If the immune cells in the tumor microenvironment cannot eliminate the preneoplastic cells in time, cancer can develop and progress [7–9]. Moreover, there is increasing evidence that tumor-infiltrating immune cells significantly contribute to outcome prediction and therapeutic effectiveness [10–12]. Recently, immunotherapies, especially treatments targeting immune checkpoint inhibitors, has revolutionized cancer treatment and significantly extended overall survival of advanced cancers. Unfortunately, the benefit population is limited [13–15]. Hence, there is an urgent need to investigate tumor-immune interactions and discover potential cancer immunotherapy targets.
Here, a pan-cancer analysis of FOXM1 was conducted by the TCGA database and FOXM1 expression was verified in lung adenocarcinoma (LUAD). We also analyzed the related cell functions of FOXM1 in lung cancer cells. Furthermore, the association of FOXM1 expression with prognosis, clinical features, tumor-infiltrating immune cells, TMB, MSI, and immune checkpoint was investigated.
Results
FOXM1 gene expression in human cancers
According to our findings, FOXM1 expression was significantly upregulated in 22 types of solid tumors from the TCGA database (Figure 1A). Further investigation of FOXM1 protein expression was undertaken in the HPA cohort. FOXM1 protein expression in BRCA, CESC, LUAD, STAD and THCA tumor tissues was significantly higher (Figure 1B). Next, our study validated FOXM1 mRNA expression in 7 matched LUAD normal and tissues by quantitative real-time PCR (qRT-PCR). LUAD tissues showed significantly increased FOXM1 expression levels compared with normal tissues (Figure 1C). Immunohistochemistry was further used to assess FOXM1 protein expression levels, demonstrating that LUAD had higher levels of FOXM1 protein expression than normal tissues (Figure 1D).
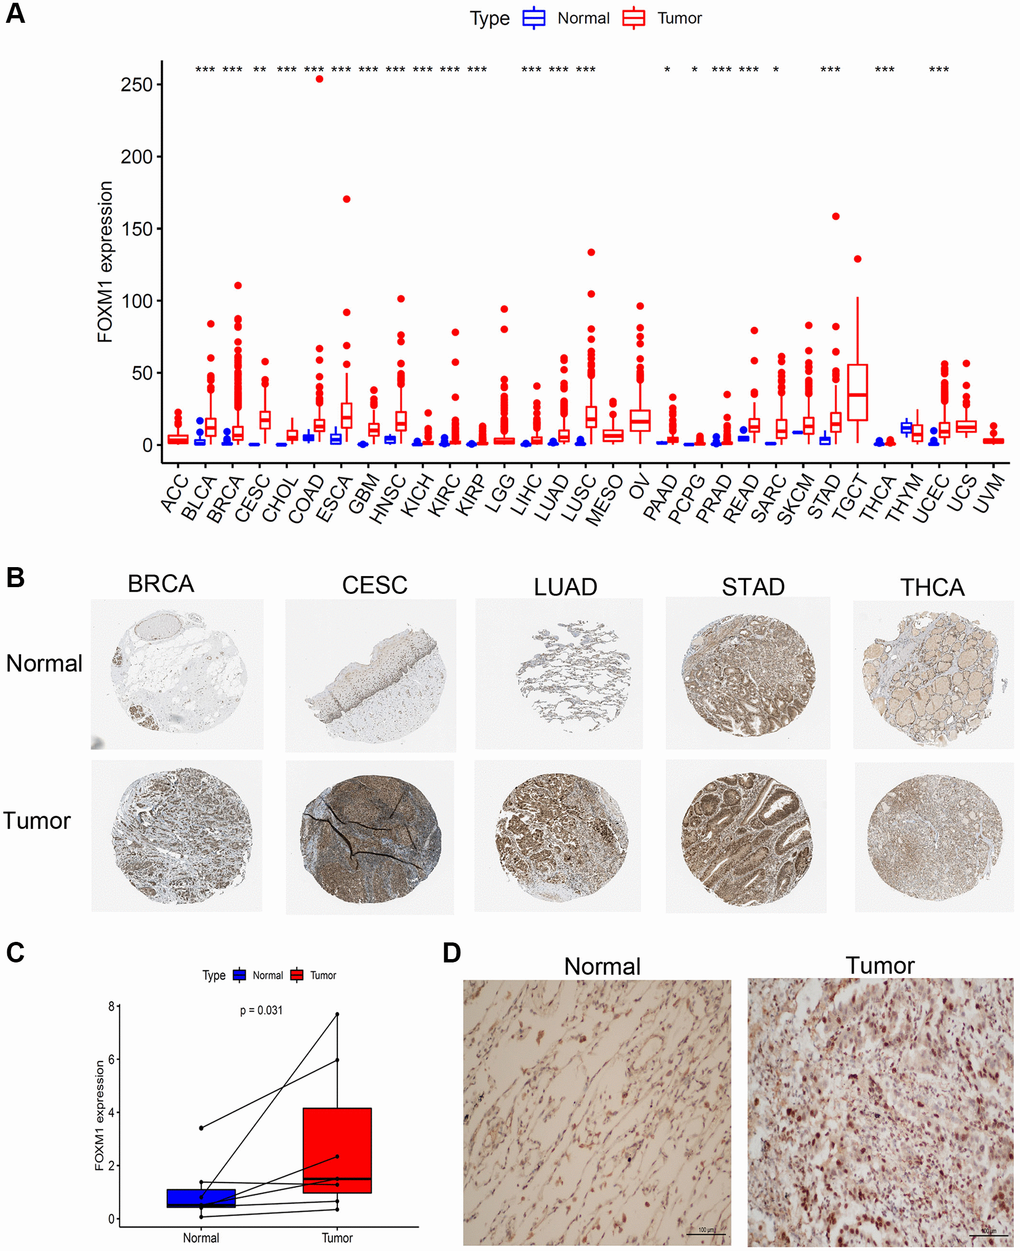
Figure 1. Expression levels of FOXM1 in pan-cancer. (A) Boxplot of the mRNA expression of FOXM1 in 31 types of solid tumor and normal tissues from TCGA database. (B) Representative IHC staining of FOXM1 in BRCA, CESC, LUAD, STAD and THCA normal and tumor tissues in HPA. (C) Expression of FOXM1 in tumor group were upregulated than that in normal group. (D) IHC analysis of FOXM1 in LUAD tissues. Representative images are shown. *p < 0.05, **p < 0.01, ***p < 0.001.
We next evaluated FOXM1 expression according to tumor stage, gender and age. Higher FOXM1 expression was dramatically related to advanced tumor stage in ACC, BRCA, ESCA, KICH, KIRC, KIRP, LIHC, LUAD, LUSC, TGCT (Figure 2). Interestingly, ACC, ESCA, KICH, KIRC, KIRP, LUAD patients with stage IV tumors expressed more FOXM1 than patients with stage I tumors. A comparison of FOXM1 expression in tumors according to gender and age is shown in Supplementary Figure 1.
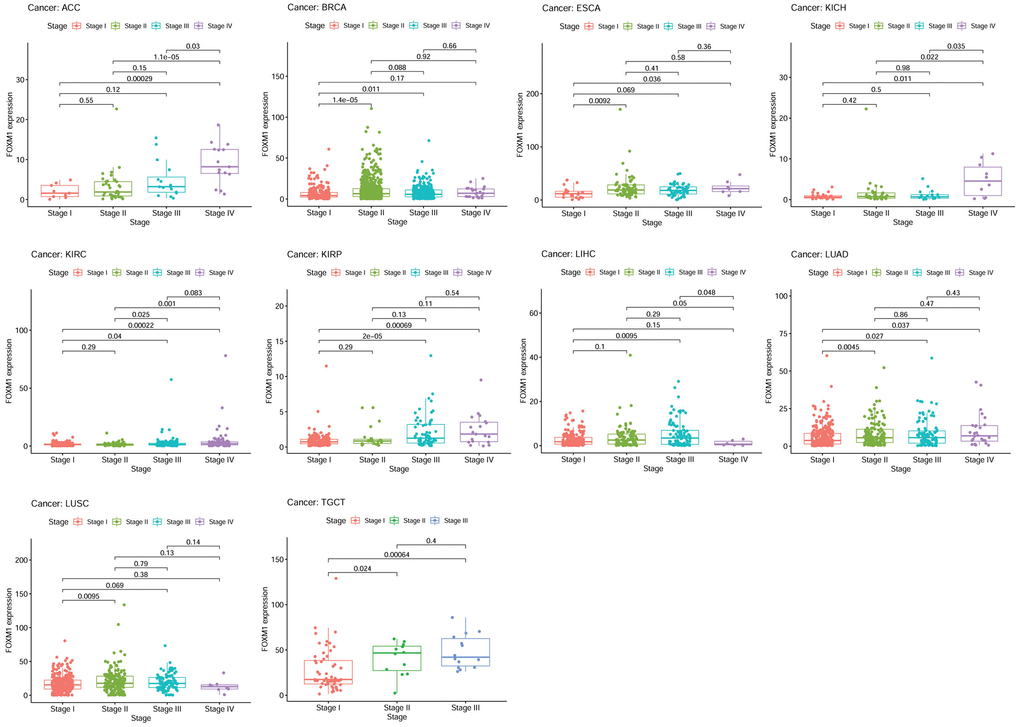
Figure 2. The association of FOXM1 expression with the pathological stages of cancers. p < 0.05 was considered significant.
Pan-cancer prognostic value of FOXM1
To investigate how FOXM1 expression relates to prognosis, survival analyses were performed by the TCGA cohort. Patients with higher FOXM1 expression had poor overall survival (OS) in ACC, KICH, KIRC, KIRP, LGG, LIHC, LUAD, MESO, PAAD, SARC, SKCM, UVM based on Kaplan-Meier analysis. Conversely, patients with higher FOXM1 expression had better OS in THYM. In order to avoid the bias resulting from non-tumor related death, the relationship of FOXM1 expression with a poor disease-specific survival (DSS) was further evaluated. The results, much like that of the OS analysis, demonstrated that higher FOXM1 expression significantly predicted a poor DSS. There was a negative correlation between disease-free interval (DFI) and FOXM1 expression in KIRP, LUAD, PAAD, SARC, and THCA. Our study finally analyzed the association between FOXM1 expression and progression-free interval (PFI). Patients with higher FOXM1 expression had poor PFI in ACC, KIRC, KIRP, LGG, LIHC, LUAD, MESO, PAAD, PRAD, SARC, SKCM, THCA, UVM (Figure 3).
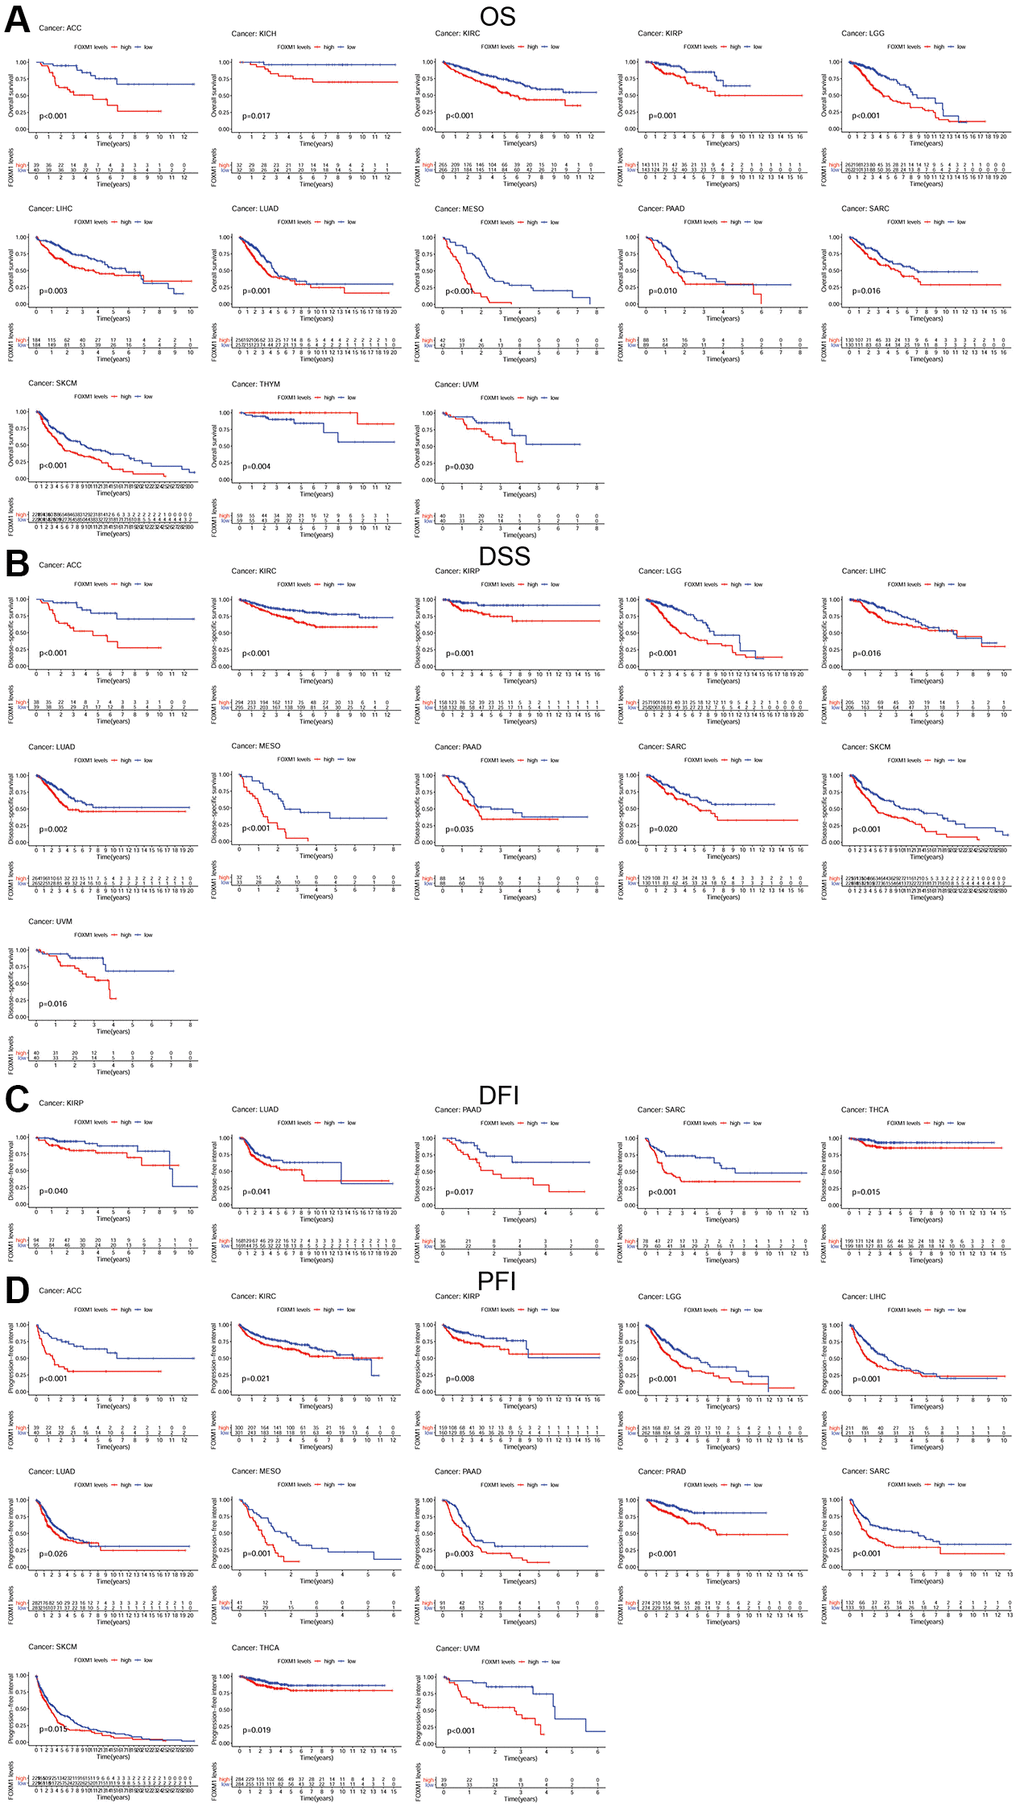
Figure 3. Kaplan-Meier survival curves comparing the expression of FOXM1 in pan-cancer. (A) Kaplan–Meier OS curves for the low expression group and high expression group of FOXM1 in 13 types of cancers; (B) Kaplan–Meier DSS curves for the low expression group and high expression group of FOXM1 in 11 types of cancers; (C) Kaplan–Meier DFI curves for the low expression group and high expression group of FOXM1 in 5 types of cancers; (D) Kaplan–Meier PFI curves for the low expression group and high expression group of FOXM1 in 13 types of cancers. p < 0.05 was considered significant.
According to the forest plots, FOXM1 could significantly affect the OS of 13 types of solid tumors. The expression of FOXM1 represented a high-risk indicator in ACC, BLCA, COAD, KICH, KIRC, KIRP, LGG, LIHC, LUAD, MESO, SKCM, UCEC, UVM, but a low-risk indicator in THYM. For DSS, similar results were observed. Regarding FOXM1 and DFI, Cox regression analysis revealed that FOXM1 expression impacted the DFI of KIRP, LUAD, LUSC, PRAD, SARC, THCA. In terms of PFS, forest plot revealed that the hazard ratios for FOXM1 were significant for 18 cancer types (Figure 4).
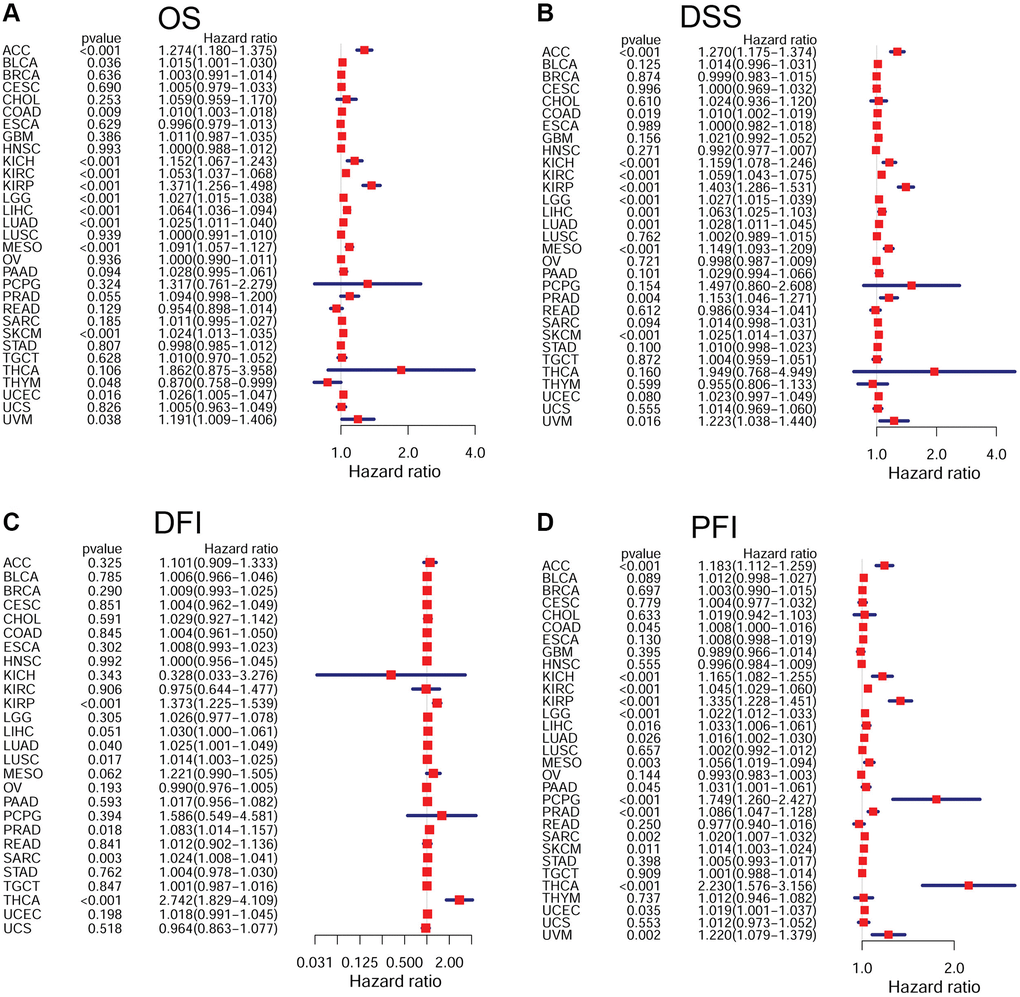
Figure 4. Forest plots of Cox regression analyses in pan-cancer. (A) Association of FOXM1 expression with OS; (B) Association of FOXM1 expression with DSS; (C) Association of FOXM1 expression with DFI; (D) Association of FOXM1 expression with PFI. p < 0.05 was considered significant.
Association of FOXM1 with tumor immune microenvironment
In order to understand how FOXM1 expression correlates with immune infiltration, we used the Estimating Relative Subsets of RNA Transcripts (CIBERSORT) method. Different subpopulations of invasive macrophages showed a correlation with FOXM1 expression. There was a positive association of FOXM1 expression with macrophage M1 in 9 types of cancers. BRCA, KIRC, LUAD, and STAD revealed a positive association of FOXM1 expression with macrophage M0, whereas KIRP and THYM showed a negative correlation. A positive correlation was found between FOXM1 expression and macrophage M2 infiltration in TGCT and THYM, but a negative correlation was found in KIRP, LIHC, and THCA (Figure 5). Moreover, there was a correlation between FOXM1 expression and infiltration levels of CD4+T cells, B cells, CD8+T cells, mast cells, dendritic cells, T cells follicular helper, NK cells and Tregs (Supplementary Figure 2).
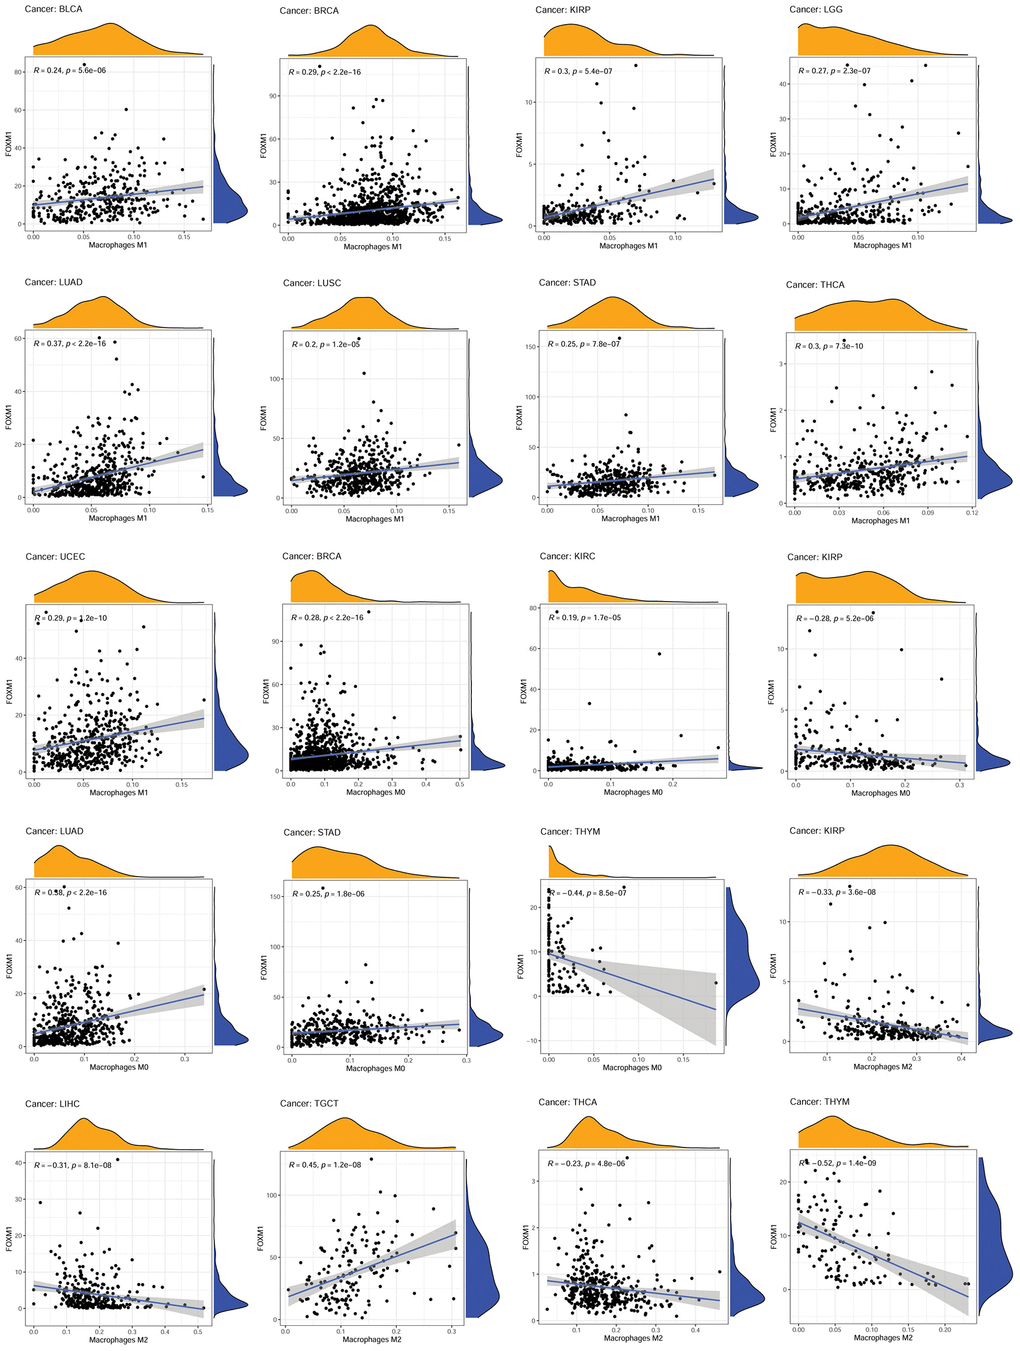
Figure 5. Association of FOXM1 expression with macrophages. p < 0.0001 was considered significant.
Next, it was explored whether the expression of FOXM1 and immune scores correlated using the ESTIMATE algorithm. FOXM1 expression was positively associated with immune and stromal scores of KIRC and THCA, but negatively associated with GBM, LUAD, LUSC, PAAD, SKCM, STAD, and UCEC. Additionally, a negative relationship was found between FOXM1 expression and the ESCA and TGCT immune scores, and a negative relationship was found between FOXM1 expression and the BRCA, COAD, LIHC, and SARC stromal scores (Figure 6).
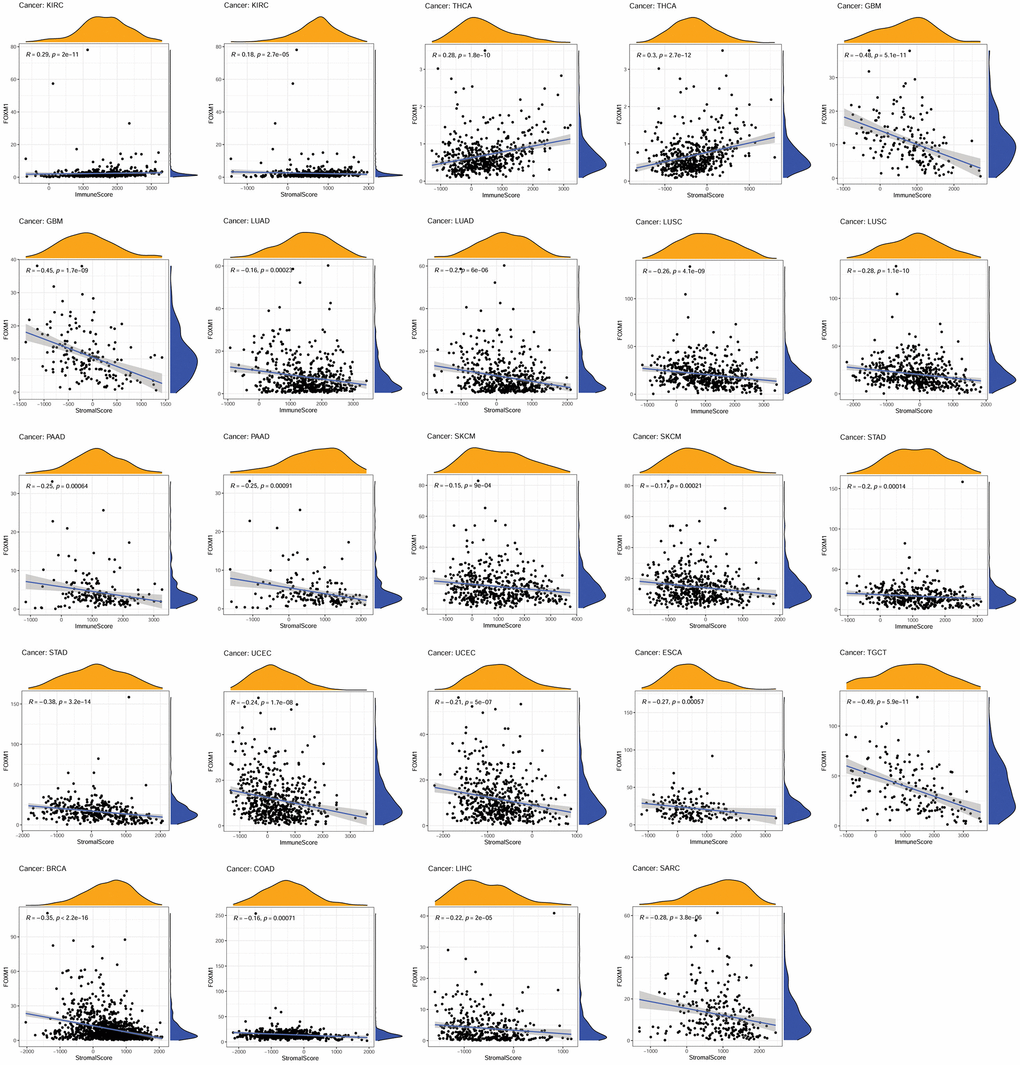
Figure 6. Association of FOXM1 expression with the immune score and stomal score. p < 0.05 was considered significant. p < 0.001 was considered significant.
Association of FOXM1 expression with TMB and MSI
We further explored the association of TMB and MSI with FOXM1 expression. A positive correlation was found between FOXM1 and TMB in 19 cancer types. While in ESCA and THYM, negative relationships were found (Figure 7A). Additionally, FOXM1 and MSI had a positive correlation in 13 cancer types, including ACC, CESC, CHOL, COAD, GBM, LIHC, LUSC, OV, PAAD, SARC, STAD, TGCT, UCEC, UVM (Figure 7B).
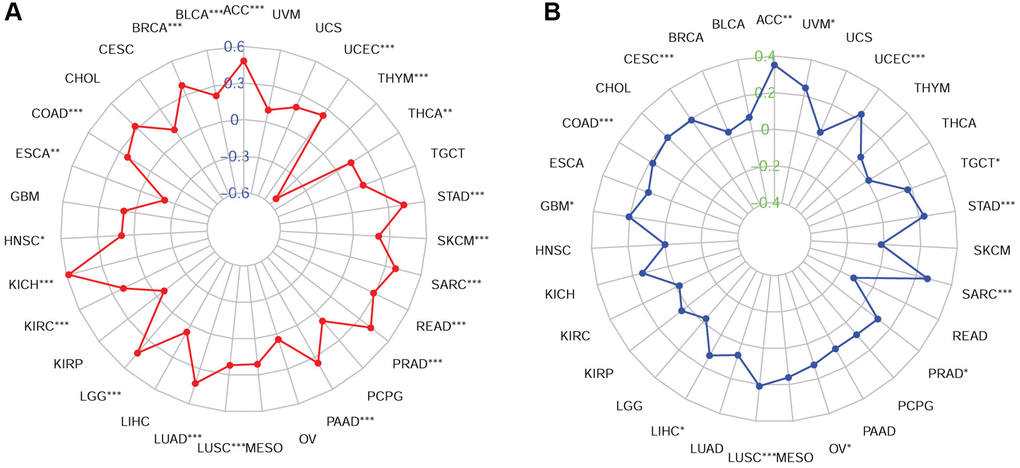
Figure 7. Associations of FOXM1 expression with TMB and MSI in cancers. (A) Radar map of association of FOXM1 expression with TMB, (B) Radar map of association of FOXM1 expression with MSI. *p < 0.05, **p < 0.01, ***p < 0.001.
Correlations of FOXM1 with immune checkpoint-associated genes
A gene coexpression analysis was conducted to investigate how FOXM1 is related to immune checkpoint genes. More than 40 immune checkpoint genes were assessed. In LIHC, SKCM, and THCA, FOXM1 expression correlated significantly with the major checkpoint genes. Interestingly, CD276 was positively associated with FOXM1 expression in most cancers, with the exception of CESC, CHOL, COAD, GBM, READ, SARC and UCS. Forty-one immune checkpoint markers had significant associations with FOXM1 expression in TGCT. Furthermore, CESC, CHOL, COAD, READ, USC, and UVM showed relatively small correlations (Figure 8).
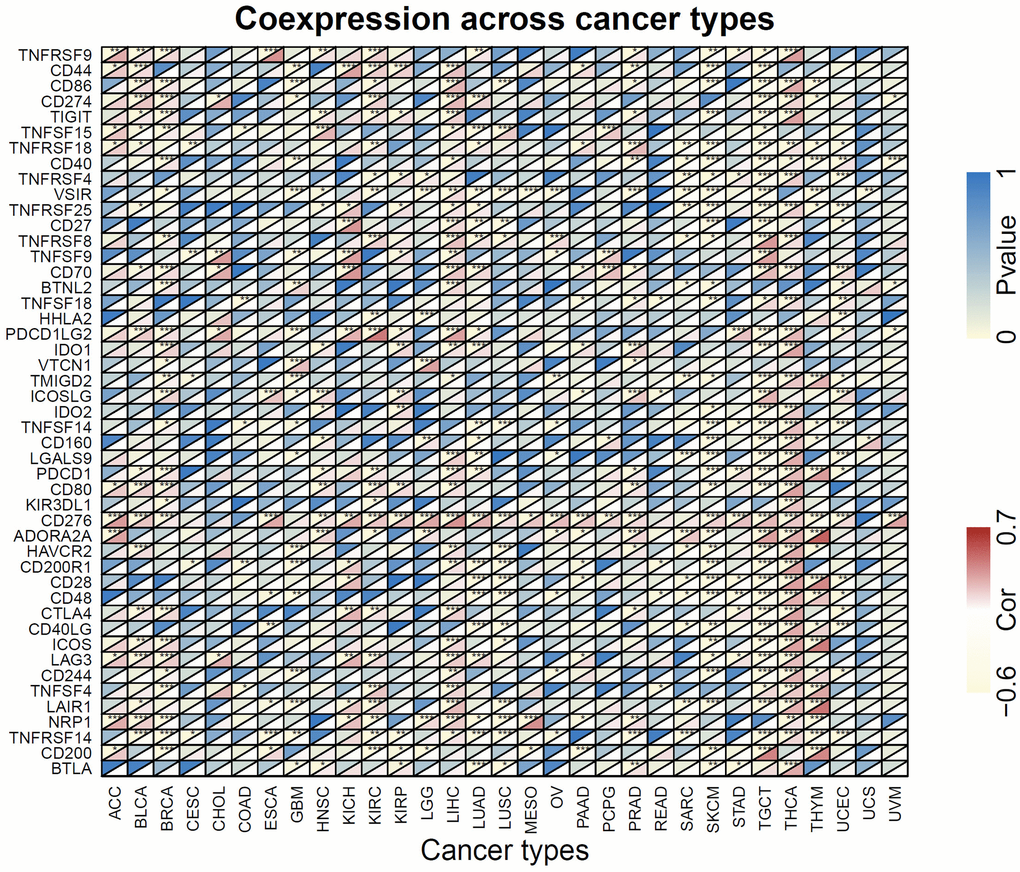
Figure 8. Heatmap of the association of FOXM1 expression with 47 common immune checkpoints gene levels in 31 types of cancers. For each pair, the top left triangle represents the P-value, and the bottom right triangle represents the correlation coefficient. *p < 0.05, **p < 0.01, ***p < 0.001.
Immunotherapeutic response prediction value of FOXM1
As FOXM1 was closely related with tumor immune microenvironment, we sought to confirm whether it could predict response to immune checkpoint inhibitor treatment based on IMvigor 210 cohort. In patients with high FOXM1 levels, OS was significantly longer than in those with low levels (Figure 9A). Furthermore, higher FOXM1 was tested in responders than that in non-responders (Figure 9B). Anti-PD-L1 therapy was significantly more effective when FOXM1 levels were higher. (Figure 9C).
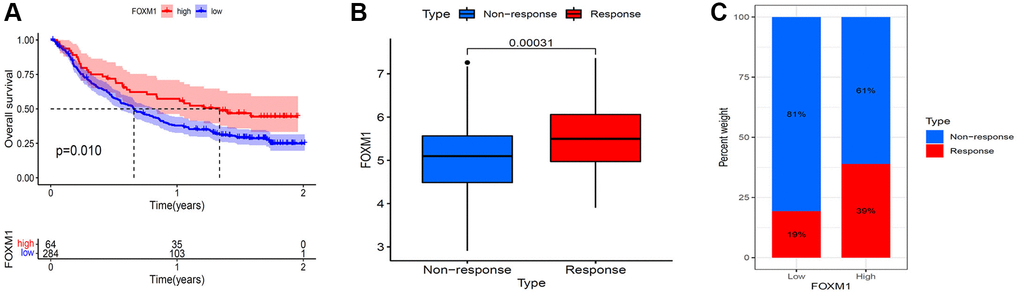
Figure 9. Validation of the immunotherapeutic predictive value of FOXM1. (A) Kaplan–Meier OS curves for patients with FOXM1 high and low expression subgroups in IMvigor 210 cohort. (B) FOXM1 expression was higher in responders than that in non-responders. (C) The proportion of patients with response to anti- PD-L1 therapy in FOXM1 high and low expression groups. p < 0.05 was considered significant.
Gene set enrichment analysis
Kyoto Encyclopedia of Genes and Genomes (KEGG) and Gene Ontology (GO) pathways enrichment was analyzed to investigate the biological significance of FOXM1 expression in various cancers (Supplementary Figures 3 and 4). In KEGG analysis, FOXM1 was related to “cell cycle” and “DNA replication” pathways in multiple tumors. Besides, FOXM1 could modulate some pathways, such as “cytokine receptor interactio”, “complement and coagulation cascades”. In GO analysis, FOXM1 could modulate some pathways, such as “antigen binding”, “B cell mediated immunity”, “T cell receptor complex” in CHOL; “adaptive immune response based on somatic recombination”, “immunoglobulin production” in KIRC; “antigen binding”, “Fc receptor mediated stimulatory”, “humoral immune response circulating immunoglobulin”, “negative regulation of immune response”, “positive T cell selection” in TGCT; “antigen binding”, “humoral immune response”, “immunoglobulin complex” in UCS. FOXM1 also regulated many other pathways associated with “cell cycle” and “chromosome segregation”. These results demonstrated that FOXM1 widely regulated cell proliferation and immunity signaling pathways.
Functional analysis of FOXM1 in lung cancer cells
We additionally selected a lung cancer cell line A549 as an example and performed functional experiments to further verify our bioinformatics findings. We designed and transfected siRNA of FOXM1 to knock down endogenous FOXM1 expression. The results of CCK8 assays identified that knockdown of FOXM1 with siRNA resulted in the decrease of the proliferation ability of A549 cells (Figure 10A). According to wound healing test, FOXM1 downregulation markedly diminished cell migration of A549 cells (Figure 10B). Similarly, transwell migration analysis confirmed that FOXM1 downregulation could inhibit A549 cells migration. Transwell invasion analysis also showed that after knockdown of FOXM1, A549 cells revealed a decrease in invasion capacity (Figure 10C).
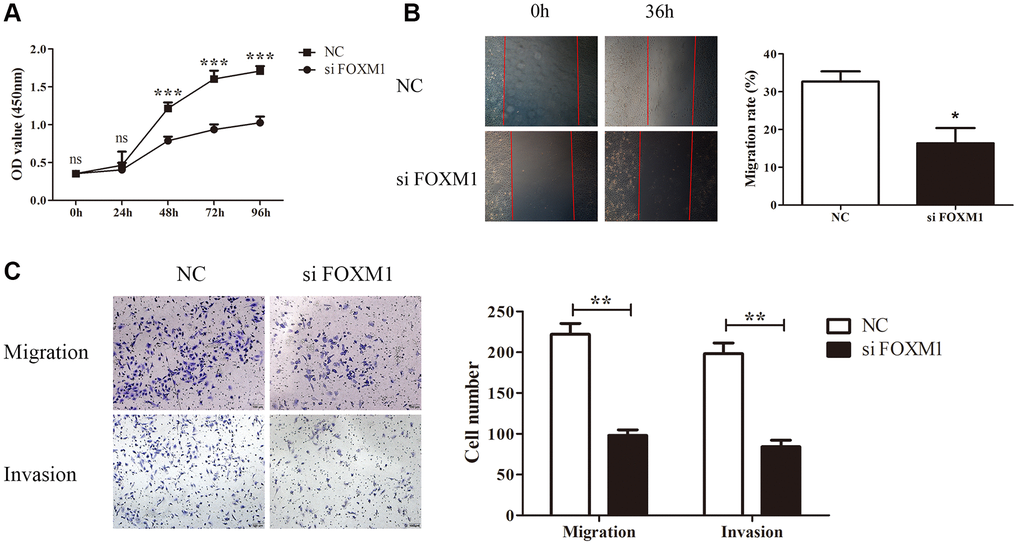
Figure 10. FOXM1 knockdown inhibits lung cancer cell proliferation, migration and invasion. (A) The proliferation curves of A549 cells transfected with si-NC and si- FOXM1. (B) The wound healing assay results for A549 cells transfected with si-NC and si-FOXM1 at 0, 36 h, respectively. (C) The transwell migration and invasion assay for A549 cells transfected with si-NC and si-FOXM1. *p < 0.05, **p < 0.01, ***p < 0.001.
Discussion
The oncogene FOXM1 plays a crucial role in a wide range of malignancies in humans [2, 3]. In addition, FOXM1 can predict poor prognosis in some cancers [4–6]. More studies focus on pan-cancer analyses of oncogenes, such as HILPDA [16], LCN2 [17], and SND1 [18] etc. These studies were performed on the basis of the publicly funded TCGA project or the accessible GEO database, which provided us with a convenience to carry out pan-cancer analysis. Our study examined FOXM1 expression profiles and prognostic significance across 31 solid tumors. In addition, FOXM1’s potential role in tumor immunology was investigated in different cancers.
We observed that, compared with normal tissues, FOXM1 was abnormally overexpressed in most tumors. Besides, FOXM1 expression significantly correlated with clinical stage, age and gender. In stage I and IV tumors, FOXM1 expression differed significantly. FOXM1 has proven to be an effective prognostic biomarker for most cancers. Furthermore, FOXM1 expression in LUAD was validated using qRT- PCR and immunohistochemistry. In line with bioinformatic analysis, in tumor tissues, significantly higher levels of FOXM1 mRNA and protein were detected.
Cox regression and Kaplan-Meier analyses revealed that most tumor types had poor prognosis when FOXM1 expression increased, especially KIRP and LUAD. These discoveries consisted with previous studies that reported FOXM1 as a negative prognostic biomarker [4–6]. However, our study was the first to demonstrate that FOXM1 upregulation was related to better OS in THYM, though the limited sample size might have contributed to this finding. Due to the consistent results in mRNA and protein expression analysis and the coincident effect of FOXM1 on clinical outcomes, we selected LUAD as an example to verify our bioinformatics findings in the manuscript. In addition, we performed functional studies on LUAD cell A549 to preliminarily evaluate the role of FOXM1 in lung cancer. The knockdown of FOXM1 effectively inhibited A549 cells proliferation, migration, and invasion. Our results were in line with the bioinformatics analysis and expression analysis of FOXM1 in LUAD tissue, thus demonstrating the reliability of our study.
Therapy targeting immune checkpoint genes has been widely proven to be a successful strategy for most advanced cancers. However, some cancer types respond well to treatment only in a limited proportion of patients [19]. Thus, in order to predict the outcome of immune checkpoint inhibitor therapy, reliable biomarkers must be identified.
TMB represents the cumulative number of somatic non-synonymous mutations per Mb in the genomic sequence. High TMB can produce more neoantigens and make the tumor more immunogenic, thus, enhancing T cell response and anti-tumor response [20–22]. TMB has been well known to act as a biomarker of immune checkpoint inhibitor response. Recent studies have reported that patients with high TMB tend to benefit from immunotherapy and have better response and OS [23, 24].
MSI-H reflects the change in microsatellite length between normal and tumor cells caused by repeated unit insertions or deletions. MSI-H was shown to be caused by mismatch-repair deficiencies (dMMR) and was an important predictor of tumor development [25]. Both MSI-H and dMMR were associated with high mutation load, which was more likely to benefit from immunotherapy. Recent reports have also indicated that anti-PD-1 immunotherapy is greatly effective against MSI-H solid tumors [26–30]. Pembrolizumab has received FDA approval for treating MSI-H/dMMR solid tumors [31]. In our study, FOXM1 expression was found to have an impact on TMB and MSI, thereby affecting immunotherapy response.
Tumor infiltrating lymphocytes are crucial for tumor immunity in inhibiting or promoting tumor progression [32]. A recent finding indicated that the status of sentinel lymph nodes and the survival of patients could be predicted independently using tumor infiltrating lymphocytes [33]. Tumor-infiltrating lymphocytes could also affect the clinical efficacy of immunotherapy [34, 35]. PD-1/PD-L1 inhibitor therapy might be more effective for various types of cancer when CD8+ T cells were more abundant in the tumor core as well as at the invasive margin [36, 37]. In melanoma tumors that responded to anti-CTLA-4, increased numbers of several subsets of CD4+Th1 cells have been observed [38]. The role of B cells in immune checkpoint inhibitors has also been demonstrated in recent studies [39, 40]. Moreover, tumor-associated macrophages (TAMs) influenced immune checkpoint inhibitors response in addition to contributing to tumor progression. For instance, in NSCLC, there was an increase in M2 macrophage infiltration in patients with hyperprogression under PD-1/PD-L1 inhibitor therapy [41]. The infiltration of CD68+CD16+ classically activated M1 macrophages was higher in melanoma tumors that responded to anti-CTLA-4 [42]. In this study, the expression of FOXM1 and multiple immune cell subtypes infiltration correlated significantly. Moreover, FOXM1 expression and immune checkpoint gene correlated significantly. The analysis of immunotherapy cohort (IMvigor 210) showed that patients with higher FOXM1 expression responded better to anti-PD-L1 treatment, and had a longer OS. Our findings suggested that FOXM1 played a vital role in tumor immunology.
In conclusion, our study demonstrated that multiple tumors that overexpressed FOXM1 had poor prognoses. Furthermore, immune cell infiltration, immune checkpoint genes, TMB, and MSI were associated with aberrant FOXM1 expression. However, this study mainly focused on bioinformatics and public databases. In order to fully understand how FOXM1 affects tumor progression and immunity, further mechanistic studies are needed. Therefore, there is potential for FOXM1 to be used as a biomarker for cancer prognosis and immunotherapy.
Methods
Data collection
RNA sequencing datasets, clinicopathological information and survival information for 31 solid tumors were acquired from the TCGA database (https://portal.gdc.cancer.gov/) on March 20, 2021. Table 1 provides a general overview of pan-cancer. Patient transcriptomic and clinical data for BLCA receiving anti-PD-L1 therapy (atezolizumab) were obtained from the IMvigor 210 trial data [43]. R version 3.6.3 was used for all data analysis.
Table 1. Pan-cancer data acquired from TCGA.
| Cancer type | Full name | Tumor samples | Normal samples |
| ACC | Adrenocortical carcinoma | 79 | 0 |
| BLCA | Bladder urothelial carcinoma | 414 | 19 |
| BRCA | Breast invasive carcinoma | 1109 | 120 |
| CESC | Cervical squamous cell carcinoma and endocervical adenocarcinoma | 306 | 3 |
| CHOL | Cholangiocarcinoma | 36 | 9 |
| COAD | Colon adenocarcinoma | 480 | 41 |
| ESCA | Esophageal carcinoma | 162 | 11 |
| GBM | Glioblastoma multiforme | 169 | 5 |
| HNSC | Head and neck squamous cell carcinoma | 502 | 44 |
| KICH | Kidney chromophobe | 65 | 24 |
| KIRC | Kidney renal clear cell carcinoma | 539 | 72 |
| KIRP | Kidney renal papillary cell carcinoma | 289 | 32 |
| LGG | Brain lower grade glioma | 529 | 0 |
| LIHC | Liver hepatocellular carcinoma | 374 | 50 |
| LUAD | Lung adenocarcinoma | 535 | 59 |
| LUSC | Lung squamous cell carcinoma | 502 | 49 |
| MESO | Mesothelioma | 86 | 0 |
| OV | Ovarian serous cystadenocarcinoma | 379 | 0 |
| PAAD | Pancreatic adenocarcinoma | 178 | 4 |
| PCPG | Pheochromocytoma and paraganglioma | 183 | 3 |
| PRAD | Prostate adenocarcinoma | 499 | 52 |
| READ | Rectum adenocarcinoma | 167 | 10 |
| SARC | Sarcoma | 263 | 2 |
| SKCM | Skin cutaneous melanoma | 471 | 1 |
| STAD | Stomach adenocarcinoma | 375 | 32 |
| TGCT | Testicular germ cell tumors | 156 | 0 |
| THCA | Thyroid carcinoma | 510 | 58 |
| THYM | Thymoma | 119 | 2 |
| UCEC | Uterine corpus endometrial carcinoma | 552 | 35 |
| UCS | Uterine carcinosarcoma | 56 | 0 |
| UVM | Uveal melanoma | 80 | 0 |
FOXM1 expression analysis
Using the Wilcoxon test, we compared FOXM1 expression levels in tumor and normal tissue. Then, a box plot was displayed by the ‘ggpubr’ R package. From the HPA database, immunohistochemistry images of the FOXM1 protein were obtained for both normal and cancerous tissues. We also explored differences in FOXM1 expression across different stages, genders and ages using chi-square or Fisher’s exact tests. It is statistically significant if p < 0.05.
Isolation of RNA and qRT-PCR analysis
The First Affiliated Hospital of Nanjing Medical University provided the LUAD tissue. TRIzol reagent (Invitrogen, USA) was applied to extract total RNA, and PrimeScript RT reagent Kit (Takara Bio) was used to reversely transcribe into cDNA. For the detection of FOXM1 mRNA expression levels, qRT-PCR was conducted with an ABI StepOnePlus system (Applied Biosystems) and Sybrgreen-based qRT-PCR assays. GAPDH was used for normalizing the samples. Using 2−ΔΔCt method, relative expression levels of mRNA were determined and each sample was performed in triplicate. The primers: FOXM1 (forward: 5′-TCTGCCAATGGCAAGGTCTCCT-3′ and reverse: 5′-CTGGATTCGGTCGTTTCTGCTG-3′).
Immunohistochemistry
The First Affiliated Hospital of Nanjing Medical University provided Archival formalin fixed paraffin-embedded (FFPE) specimens of LUAD tissues and corresponding para-tumor tissues. All of the tumor samples were again independently confirmed by two pathologists. Thin sections (5 mm) were cut from FFPE biopsy specimens. Following deparaffinization, the sample was rehydrated with gradient alcohol. The antigens were repaired by microwaving with citrate buffer followed by incubation with 3% H2O2. A primary antibody for FOXM1 (catalog no., bs-21487R; 1:200 dilution; USA) was incubated overnight at 4°C, followed by a secondary antibody at 32°C for 30 minutes. Afterwards, diaminobenzidine chromogen was used to stain. In the final step, hematoxylin counterstaining was followed by dehydration and cover-slipping with permanent media.
Survival analysis
Survival data from the TCGA was downloaded to evaluate the prognostic value of FOXM1. Based on the median FOXM1 expression, we divided each tumor sample into two groups. A Kaplan-Meier method was performed by the R packages ‘survival’ and ‘survminer’ to determine the correlation of FOXM1 with survival. Hazard ratios with 95% confidence intervals were collected by Cox proportional hazard regression analysis in 31 cancer types.
Immune correlation analysis
CIBERSORT helps distinguish 22 tumor infiltrating immune cells from other cells in tissues [44]. The associations of FOXM1 expression with 22 immune cell subtypes were estimated by the CIBERSORT algorithm.
ESTIMATE is a tool that predicts tumor purity [45]. Stromal and immune scores were obtained using R packages ‘estimate’ and ‘limma’. The correlation between FOXM1 and these scores was determined using Spearman correlation analysis.
TMB and MSI have been found to have close links with the immune response in recent studies [20, 25]. The association of TMB/MSI with FOXM1 expression was evaluated using Spearman correlation analysis. The results were shown by the R ‘fmsb’ package in radar chart. The association of FOXM1 expression with common immune checkpoint genes was further evaluated using Pearson’s correlation analysis. The results were shown by ‘Reshape 2’ and ‘R Color Brewer’ packages in heatmaps.
Gene set enrichment analysis
GSEA was conducted with ‘cluster-Profiler’ R package to explore the relevant signaling pathways between FOXM1 high and low expression groups in GO and KEGG. The enrichment significance criteria were |NES|>1, NOM p < 0.05, together with FDR q < 0.25.
Cell culture and siRNA transfection
The National Institute of Cells (Shanghai, China) provided lung cancer cell line A549 for this study. RPMI1640 medium with 10% fetal calf serum (Gibco) was used to culture the cells, which were maintained at 37°C with 5% CO2 in a humidified atmosphere. The siRNA targeting FOXM1 were acquired from ShanghaGenePharma Co., Ltd., (Shanghai, China): Sense, 5′-GCCAAUCGUUCUCUGACAGAATT-3′ and antisense, 5′-UUCUGUCAGAGAACGAUUGGCTT-3′. A negative control siRNA (si-NC) was also obtained: Sense, 5′-UUCUCCGAACGUGUCACGUTT-3′ and antisense, 5′-ACGUGACACGUUCGGAGAATT-3′. FOXM1 siRNA or si-NC was transfected into A549 cells with Invitrogen™ Lipofectamine 2000 (Thermo Fisher Scientific, Inc., USA) as directed by the manufacturer.
Cell proliferation assay
The proliferation of A549 cells was examined by the CCK8 assay kit, as instructed by the manufacturer. In 96-well plates, transfected A549 cells were planted at a density of 2000 cells/well. Absorbance value of each well at 450 nm was detected.
Wound healing assay
We cultured transfected cells in a monolayer until confluence was achieved. A 200 μl pipette tip was applied to make an incision-like gap. The wound area was acquired with a microscope at 0 and 36 h after wounding. Analyzing the cell migration data was done with Image-Pro Plus 7.0 software.
Transwell migration and invasion assay
Using a transwell chamber system, migration and invasion were assessed. For the migration assay, 24 hours after transfection, 10,000 cells containing medium supplemented with 2% serum were planted onto the upper chamber. For the invasion assay, a ratio of 1:4 was used for mixing matrigel and serum-free medium, followed by seeding the mixture into an upper chamber. Next, 10,000 cells were placed in the upper chamber. Each chamber was placed into a complete medium in both assays. When 24 hours had passed, using 95% ethanol, we fixed the invaded cells on the lower chamber surface for 30 minutes. Next, crystal violet at a concentration of 0.1% was applied to stain the cells for about 15 minutes. Under a microscope, three random fields of stained cells were observed and counted.
Statistical analysis
Statistical analysis of the in vitro A549 cell assays was conducted by SPSS 20.0 software. The mean ± standard deviation (SD) of at least three experiments were presented. We defined statistically significant differences as two-sided p < 0.05 for Student’s t-tests.
Supplementary Materials
Author Contributions
HL, MXZ and XZ conceived and designed this study. GHW, XY and HZL obtained the data. XZ, GHW, XY and HZL analyzed the data. LZ and YW helped discuss the results. GHW drafted the manuscript. HL, MXZ, GHW and XZ performed experiments mentioned in the study. All authors contributed to the article and approved the submitted version.
Conflicts of Interest
The authors declare no conflicts of interest related to this study.
Ethical Statement and Consent
This study was approved by the Ethics Committee of the hospital and each participant had signed informed consent (Ethics Approval No. 2017-SRFA-104).
Funding
This work was supported by the National Natural Science Foundation of China [Grant number: 81702364] and the Natural Science Foundation of Jiangsu Province [Grant number: BK20171085].
References
- 1. Hanahan D, Weinberg RA. Hallmarks of cancer: the next generation. Cell. 2011; 144:646–74. https://doi.org/10.1016/j.cell.2011.02.013 [PubMed]
- 2. Halasi M, Gartel AL. Targeting FOXM1 in cancer. Biochem Pharmacol. 2013; 85:644–52. https://doi.org/10.1016/j.bcp.2012.10.013 [PubMed]
- 3. Liao GB, Li XZ, Zeng S, Liu C, Yang SM, Yang L, Hu CJ, Bai JY. Regulation of the master regulator FOXM1 in cancer. Cell Commun Signal. 2018; 16:57. https://doi.org/10.1186/s12964-018-0266-6 [PubMed]
- 4. Borhani S, Gartel AL. FOXM1: a potential therapeutic target in human solid cancers. Expert Opin Ther Targets. 2020; 24:205–17. https://doi.org/10.1080/14728222.2020.1727888 [PubMed]
- 5. Barger CJ, Branick C, Chee L, Karpf AR. Pan-Cancer Analyses Reveal Genomic Features of FOXM1 Overexpression in Cancer. Cancers (Basel). 2019; 11:251. https://doi.org/10.3390/cancers11020251 [PubMed]
- 6. Kalathil D, John S, Nair AS. FOXM1 and Cancer: Faulty Cellular Signaling Derails Homeostasis. Front Oncol. 2021; 10:626836. https://doi.org/10.3389/fonc.2020.626836 [PubMed]
- 7. Quail DF, Joyce JA. Microenvironmental regulation of tumor progression and metastasis. Nat Med. 2013; 19:1423–37. https://doi.org/10.1038/nm.3394 [PubMed]
- 8. Chen F, Zhuang X, Lin L, Yu P, Wang Y, Shi Y, Hu G, Sun Y. New horizons in tumor microenvironment biology: challenges and opportunities. BMC Med. 2015; 13:45. https://doi.org/10.1186/s12916-015-0278-7 [PubMed]
- 9. Greten FR, Grivennikov SI. Inflammation and Cancer: Triggers, Mechanisms, and Consequences. Immunity. 2019; 51:27–41. https://doi.org/10.1016/j.immuni.2019.06.025 [PubMed]
- 10. Petitprez F, Meylan M, de Reyniès A, Sautès-Fridman C, Fridman WH. The Tumor Microenvironment in the Response to Immune Checkpoint Blockade Therapies. Front Immunol. 2020; 11:784. https://doi.org/10.3389/fimmu.2020.00784 [PubMed]
- 11. Zhang Y, Zhang Z. The history and advances in cancer immunotherapy: understanding the characteristics of tumor-infiltrating immune cells and their therapeutic implications. Cell Mol Immunol. 2020; 17:807–21. https://doi.org/10.1038/s41423-020-0488-6 [PubMed]
- 12. Kumagai S, Togashi Y, Kamada T, Sugiyama E, Nishinakamura H, Takeuchi Y, Vitaly K, Itahashi K, Maeda Y, Matsui S, Shibahara T, Yamashita Y, Irie T, et al. The PD-1 expression balance between effector and regulatory T cells predicts the clinical efficacy of PD-1 blockade therapies. Nat Immunol. 2020; 21:1346–58. https://doi.org/10.1038/s41590-020-0769-3 [PubMed]
- 13. Bagchi S, Yuan R, Engleman EG. Immune Checkpoint Inhibitors for the Treatment of Cancer: Clinical Impact and Mechanisms of Response and Resistance. Annu Rev Pathol. 2021; 16:223–49. https://doi.org/10.1146/annurev-pathol-042020-042741 [PubMed]
- 14. Keenan TE, Burke KP, Van Allen EM. Genomic correlates of response to immune checkpoint blockade. Nat Med. 2019; 25:389–402. https://doi.org/10.1038/s41591-019-0382-x [PubMed]
- 15. Tinsley N, Zhou C, Tan G, Rack S, Lorigan P, Blackhall F, Krebs M, Carter L, Thistlethwaite F, Graham D, Cook N. Cumulative Antibiotic Use Significantly Decreases Efficacy of Checkpoint Inhibitors in Patients with Advanced Cancer. Oncologist. 2020; 25:55–63. https://doi.org/10.1634/theoncologist.2019-0160 [PubMed]
- 16. Liu C, Zhou X, Zeng H, Wu D, Liu L. HILPDA Is a Prognostic Biomarker and Correlates With Macrophage Infiltration in Pan-Cancer. Front Oncol. 2021; 11:597860. https://doi.org/10.3389/fonc.2021.597860 [PubMed]
- 17. Xu WX, Zhang J, Hua YT, Yang SJ, Wang DD, Tang JH. An Integrative Pan-Cancer Analysis Revealing LCN2 as an Oncogenic Immune Protein in Tumor Microenvironment. Front Oncol. 2020; 10:605097. https://doi.org/10.3389/fonc.2020.605097 [PubMed]
- 18. Cui X, Zhang X, Liu M, Zhao C, Zhang N, Ren Y, Su C, Zhang W, Sun X, He J, Gao X, Yang J. A pan-cancer analysis of the oncogenic role of staphylococcal nuclease domain-containing protein 1 (SND1) in human tumors. Genomics. 2020; 112:3958–67. https://doi.org/10.1016/j.ygeno.2020.06.044 [PubMed]
- 19. de Miguel M, Calvo E. Clinical Challenges of Immune Checkpoint Inhibitors. Cancer Cell. 2020; 38:326–33. https://doi.org/10.1016/j.ccell.2020.07.004 [PubMed]
- 20. Schumacher TN, Schreiber RD. Neoantigens in cancer immunotherapy. Science. 2015; 348:69–74. https://doi.org/10.1126/science.aaa4971 [PubMed]
- 21. Liontos M, Anastasiou I, Bamias A, Dimopoulos MA. DNA damage, tumor mutational load and their impact on immune responses against cancer. Ann Transl Med. 2016; 4:264. https://doi.org/10.21037/atm.2016.07.11 [PubMed]
- 22. Giannakis M, Mu XJ, Shukla SA, Qian ZR, Cohen O, Nishihara R, Bahl S, Cao Y, Amin-Mansour A, Yamauchi M, Sukawa Y, Stewart C, Rosenberg M, et al. Genomic Correlates of Immune-Cell Infiltrates in Colorectal Carcinoma. Cell Rep. 2016; 15:857–65. https://doi.org/10.1016/j.celrep.2016.03.075 [PubMed]
- 23. Samstein RM, Lee CH, Shoushtari AN, Hellmann MD, Shen R, Janjigian YY, Barron DA, Zehir A, Jordan EJ, Omuro A, Kaley TJ, Kendall SM, Motzer RJ, et al. Tumor mutational load predicts survival after immunotherapy across multiple cancer types. Nat Genet. 2019; 51:202–6. https://doi.org/10.1038/s41588-018-0312-8 [PubMed]
- 24. Singal G, Miller PG, Agarwala V, Li G, Kaushik G, Backenroth D, Gossai A, Frampton GM, Torres AZ, Lehnert EM, Bourque D, O'Connell C, Bowser B, et al. Association of Patient Characteristics and Tumor Genomics With Clinical Outcomes Among Patients With Non-Small Cell Lung Cancer Using a Clinicogenomic Database. JAMA. 2019; 321:1391–9. https://doi.org/10.1001/jama.2019.3241 [PubMed]
- 25. Le DT, Uram JN, Wang H, Bartlett BR, Kemberling H, Eyring AD, Skora AD, Luber BS, Azad NS, Laheru D, Biedrzycki B, Donehower RC, Zaheer A, et al. PD-1 Blockade in Tumors with Mismatch-Repair Deficiency. N Engl J Med. 2015; 372:2509–20. https://doi.org/10.1056/NEJMoa1500596 [PubMed]
- 26. Le DT, Durham JN, Smith KN, Wang H, Bartlett BR, Aulakh LK, Lu S, Kemberling H, Wilt C, Luber BS, Wong F, Azad NS, Rucki AA, et al. Mismatch repair deficiency predicts response of solid tumors to PD-1 blockade. Science. 2017; 357:409–13. https://doi.org/10.1126/science.aan6733 [PubMed]
- 27. Yu Y. Molecular classification and precision therapy of cancer: immune checkpoint inhibitors. Front Med. 2018; 12:229–35. https://doi.org/10.1007/s11684-017-0581-0 [PubMed]
- 28. Ganesh K, Stadler ZK, Cercek A, Mendelsohn RB, Shia J, Segal NH, Diaz LA
Jr . Immunotherapy in colorectal cancer: rationale, challenges and potential. Nat Rev Gastroenterol Hepatol. 2019; 16:361–75. https://doi.org/10.1038/s41575-019-0126-x [PubMed] - 29. Duffy MJ, Crown J. Biomarkers for Predicting Response to Immunotherapy with Immune Checkpoint Inhibitors in Cancer Patients. Clin Chem. 2019; 65:1228–38. https://doi.org/10.1373/clinchem.2019.303644 [PubMed]
- 30. Killock D. Immunotherapy: dMMR presents opportunities to enhance immunotherapy. Nat Rev Clin Oncol. 2018; 15:66–7. https://doi.org/10.1038/nrclinonc.2017.203 [PubMed]
- 31. Marcus L, Lemery SJ, Keegan P, Pazdur R. FDA Approval Summary: Pembrolizumab for the Treatment of Microsatellite Instability-High Solid Tumors. Clin Cancer Res. 2019; 25:3753–8. https://doi.org/10.1158/1078-0432.CCR-18-4070 [PubMed]
- 32. Junttila MR, de Sauvage FJ. Influence of tumour micro-environment heterogeneity on therapeutic response. Nature. 2013; 501:346–54. https://doi.org/10.1038/nature12626 [PubMed]
- 33. Azimi F, Scolyer RA, Rumcheva P, Moncrieff M, Murali R, McCarthy SW, Saw RP, Thompson JF. Tumor-infiltrating lymphocyte grade is an independent predictor of sentinel lymph node status and survival in patients with cutaneous melanoma. J Clin Oncol. 2012; 30:2678–83. https://doi.org/10.1200/JCO.2011.37.8539 [PubMed]
- 34. Sade-Feldman M, Yizhak K, Bjorgaard SL, Ray JP, de Boer CG, Jenkins RW, Lieb DJ, Chen JH, Frederick DT, Barzily-Rokni M, Freeman SS, Reuben A, Hoover PJ, et al. Defining T Cell States Associated with Response to Checkpoint Immunotherapy in Melanoma. Cell. 2018; 175:998–1013.e20. https://doi.org/10.1016/j.cell.2018.10.038 [PubMed]
- 35. Ascierto PA, Lewis KD, Di Giacomo AM, Demidov L, Mandalà M, Bondarenko I, Herbert C, Mackiewicz A, Rutkowski P, Guminski A, Simmons B, Ye C, Hooper G, et al. Prognostic impact of baseline tumour immune infiltrate on disease-free survival in patients with completely resected, BRAFv600 mutation-positive melanoma receiving adjuvant vemurafenib. Ann Oncol. 2020; 31:153–9. https://doi.org/10.1016/j.annonc.2019.10.002 [PubMed]
- 36. Tumeh PC, Harview CL, Yearley JH, Shintaku IP, Taylor EJ, Robert L, Chmielowski B, Spasic M, Henry G, Ciobanu V, West AN, Carmona M, Kivork C, et al. PD-1 blockade induces responses by inhibiting adaptive immune resistance. Nature. 2014; 515:568–71. https://doi.org/10.1038/nature13954 [PubMed]
- 37. Herbst RS, Soria JC, Kowanetz M, Fine GD, Hamid O, Gordon MS, Sosman JA, McDermott DF, Powderly JD, Gettinger SN, Kohrt HE, Horn L, Lawrence DP, et al. Predictive correlates of response to the anti-PD-L1 antibody MPDL3280A in cancer patients. Nature. 2014; 515:563–7. https://doi.org/10.1038/nature14011 [PubMed]
- 38. Wei SC, Levine JH, Cogdill AP, Zhao Y, Anang NAS, Andrews MC, Sharma P, Wang J, Wargo JA, Pe'er D, Allison JP. Distinct Cellular Mechanisms Underlie Anti-CTLA-4 and Anti-PD-1 Checkpoint Blockade. Cell. 2017; 170:1120–33.e17. https://doi.org/10.1016/j.cell.2017.07.024 [PubMed]
- 39. Griss J, Bauer W, Wagner C, Simon M, Chen M, Grabmeier-Pfistershammer K, Maurer-Granofszky M, Roka F, Penz T, Bock C, Zhang G, Herlyn M, Glatz K, et al. B cells sustain inflammation and predict response to immune checkpoint blockade in human melanoma. Nat Commun. 2019; 10:4186. https://doi.org/10.1038/s41467-019-12160-2 [PubMed]
- 40. Helmink BA, Reddy SM, Gao J, Zhang S, Basar R, Thakur R, Yizhak K, Sade-Feldman M, Blando J, Han G, Gopalakrishnan V, Xi Y, Zhao H, et al. B cells and tertiary lymphoid structures promote immunotherapy response. Nature. 2020; 577:549–55. https://doi.org/10.1038/s41586-019-1922-8 [PubMed]
- 41. Lo Russo G, Moro M, Sommariva M, Cancila V, Boeri M, Centonze G, Ferro S, Ganzinelli M, Gasparini P, Huber V, Milione M, Porcu L, Proto C, et al. Antibody-Fc/FcR Interaction on Macrophages as a Mechanism for Hyperprogressive Disease in Non-small Cell Lung Cancer Subsequent to PD-1/PD-L1 Blockade. Clin Cancer Res. 2019; 25:989–99. https://doi.org/10.1158/1078-0432.CCR-18-1390 [PubMed]
- 42. Romano E, Kusio-Kobialka M, Foukas PG, Baumgaertner P, Meyer C, Ballabeni P, Michielin O, Weide B, Romero P, Speiser DE. Ipilimumab-dependent cell-mediated cytotoxicity of regulatory T cells ex vivo by nonclassical monocytes in melanoma patients. Proc Natl Acad Sci U S A. 2015; 112:6140–5. https://doi.org/10.1073/pnas.1417320112 [PubMed]
- 43. Mariathasan S, Turley SJ, Nickles D, Castiglioni A, Yuen K, Wang Y, Kadel EE
III , Koeppen H, Astarita JL, Cubas R, Jhunjhunwala S, Banchereau R, Yang Y, et al. TGFβ attenuates tumour response to PD-L1 blockade by contributing to exclusion of T cells. Nature. 2018; 554:544–8. https://doi.org/10.1038/nature25501 [PubMed] - 44. Newman AM, Liu CL, Green MR, Gentles AJ, Feng W, Xu Y, Hoang CD, Diehn M, Alizadeh AA. Robust enumeration of cell subsets from tissue expression profiles. Nat Methods. 2015; 12:453–7. https://doi.org/10.1038/nmeth.3337 [PubMed]
- 45. Yoshihara K, Shahmoradgoli M, Martínez E, Vegesna R, Kim H, Torres-Garcia W, Treviño V, Shen H, Laird PW, Levine DA, Carter SL, Getz G, Stemke-Hale K, et al. Inferring tumour purity and stromal and immune cell admixture from expression data. Nat Commun. 2013; 4:2612. https://doi.org/10.1038/ncomms3612 [PubMed]