Compound screening
Here, our goal was to identify key compounds that effectively inhibit the anchorage-independent growth and propagation of cancer stem cells (CSCs), using MCF7 cells as a model system. Briefly, these compounds can be classified within 5 sub-categories: 1) dietary supplements; 2) FDA-approved drugs; 3) natural products; 4) flavours; and 5) vitamins. See Table 1.
Table 1. Compounds tested for inhibition of MCF7 cancer stem cells (CSC) propagation.
| Compounds | ~IC-50 |
| Dietary Supplements | |
| Quercetin | 20-40 μM |
| Glucosamine | 5 mM (4X more potent than 2-DG) |
| FDA-approved Drugs | |
| Carvedilol (beta-blocker) | 25 μM |
| Ciprofloxacin (antibiotic) | 100 μM |
| Natural Products | |
| Aloe Emodin | 10-15 μM |
| Aloin | < 50 μM |
| Tannic Acid | 25 μM |
| Chlorophyllin Sodium Copper Salt | 50-100 μM |
| Azelaic Acid | 5-10 mM |
| Adipic Acid | 5-10 mM |
| Flavours | |
| Citral | 10-50 μM |
| Limonene | > 50 μM |
| Vitamins | |
| Nicotinamide (precursor of NADH) | Increases Stemness (10-20 μM) |
| Nicotinic Acid (Niacin; Vit B3) | No effect |
| List of compounds and relative IC50. Screening was based on their effects on CSCs propagation, using the mammosphere formation assay. Compounds are divided in five categories: dietary supplements, FDA-approved drugs, natural products, flavours and vitamins. |
To assess their potential effect(s) on cancer stem cell activity, we cultured MCF7 cells under low-attachment conditions, in the presence or absence of a given compound. We evaluated CSC activity after five days of culture, by counting the number of mammospheres formed.
We first analysed CSC propagation after treatment with two dietary supplements: quercetin and glucosamine. Quercetin is a flavonoid present in vegetables, fruits and beverages. It has been extensively studied as a chemo-prevention agent in several cancer models [21–23]. It has anti-oxidant, anti-inflammatory and anti-cancer activities [24–30]. Glucosamine is a monosaccharide, precursor used for the glycosylation of proteins and lipids. It is naturally present, for example, in animal bones, bone marrow and the shells of shellfish.
We tested the quercetin at concentrations of 10, 20 and 40 μM. Figure 1A shows that at the concentration of 40 μM, quercetin was effective in halting CSC propagation by over 60%, and its IC50 fell in the range between 20 and 40 μM. In Figure 1B, results with glucosamine are shown, over the range of 5 to 20 mM. Note that the lowest concentration tested is already effective as an inhibitor of CSC propagation. Interestingly, glucosamine (2-amino-2-deoxy-D-glucose) is structurally related to another well-established metabolic inhibitor, namely 2-DG (2-deoxy-D-glucose). Based on our previous studies using 2-DG in the same MCF7 CSC assay [14, 31], glucosamine appears to be approximately 4 times as potent.
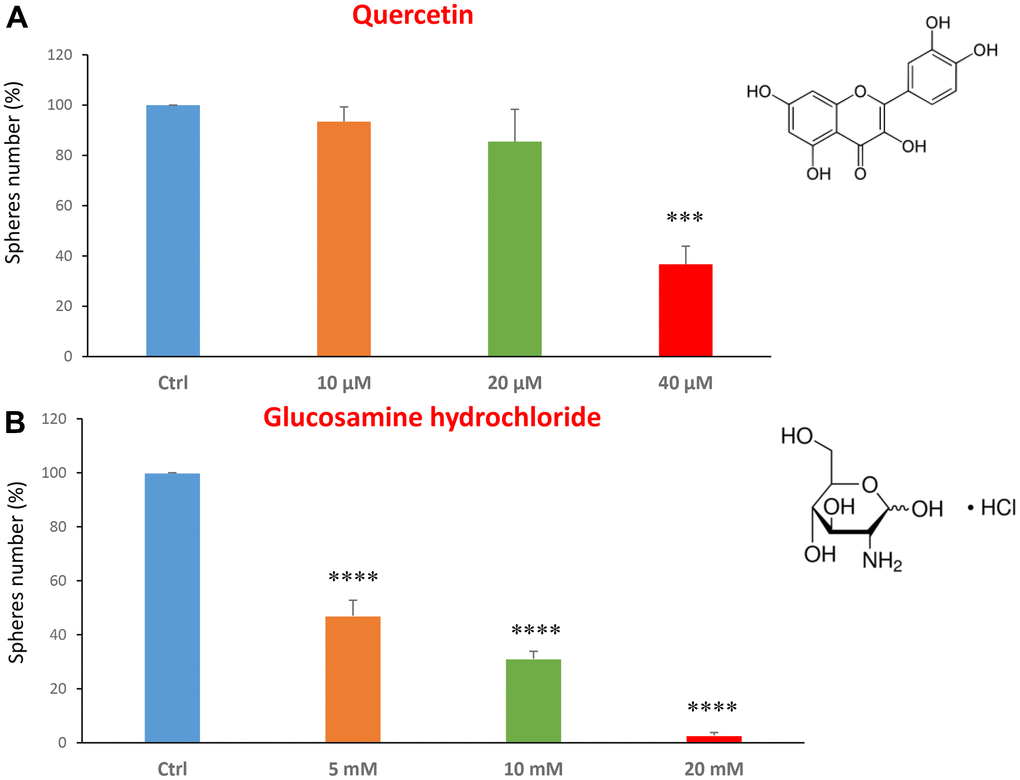
Figure 1. Dietary supplements decrease CSC propagation. The effects of two dietary supplements, quercetin and glucosamine hydrochloride, are shown. (A) Note that quercetin is effective in inhibiting CSC propagation, at a concentration of 40 μM and its IC50 falls in the range of 20 and 40 μM concentration. (B) Note that glucosamine significantly decreases mammosphere number, at concentrations of 5, 10 and 20 mM. Bar graphs are shown as the mean ± SEM; t-test, two-tailed test. ***p < 0.001, ****p < 0.0001. Chemical formulae are indicated.
Next, we investigated the effects of two FDA-approved drugs: the beta-blocker carvedilol and the antibiotic ciprofloxacin. Carvedilol, brand name Coreg, is a beta-blocker and is used to treat mild to severe congestive heart failure [32, 33].
We tested carvedilol at the concentrations of 10, 25 and 50 μM. The IC50 was 25 μM and the highest dose was so potent as to completely block the mammosphere formation (Figure 2A). However, ciprofloxacin was less potent, with an IC50 of approximately 100 μM (Figure 2B).
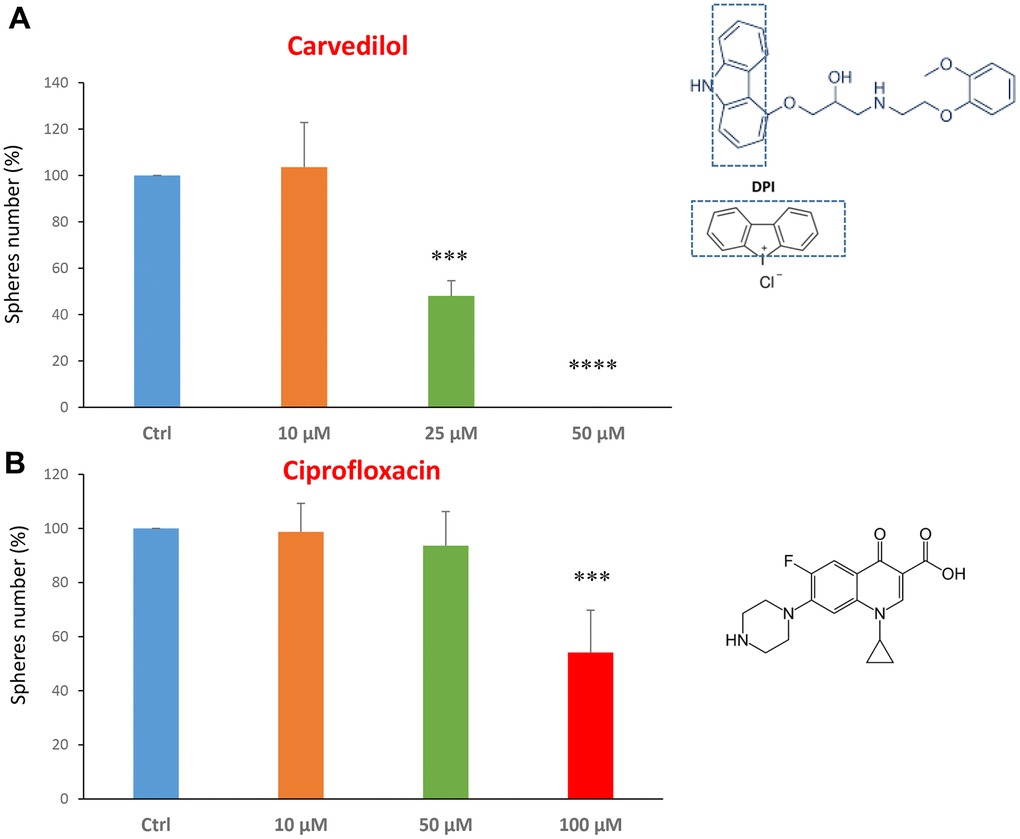
Figure 2. FDA-approved drugs decrease mammosphere formation. The effects of two FDA-approved drugs, carvedilol and ciprofloxacin, are shown. (A) Note that carvedilol is effective in inhibiting CSC propagation, at a concentration of 25 μM, its IC50, and 50 μM completely inhibits mammosphere formation. (B) Ciprofloxacin significantly decreases mammosphere number, at the concentrations of 100 μM, its IC50. Bar graphs are shown as the mean ± SEM; t-test, two-tailed test. ***p < 0.001, ****p < 0.0001. Chemical formulae are indicated.
Using this approach, we also focused on compounds that are found naturally in plants, or in vegetables and as additive in certain foods. Firstly, we tested two compounds related to each other, aloin emodin and the aloin. These are distinguished only by the fact that aloin emodin lacks a sugar compared to aloin.
Aloin (or barbaloin) is a natural anthraquinone extracted from the plant aloe latex and together with aloe emodin, that lacks a sugar group compared to the first, is widely used as an anti-inflammatory and shows anti-cancer activity [34]. Figure 3A shows that aloin emodin at the concentration of 15 μM was effective in reducing CSC propagation by over 70%. Aloin was also effective at all three concentrations tested of 50, 100 and 200 μM (Figure 3B).
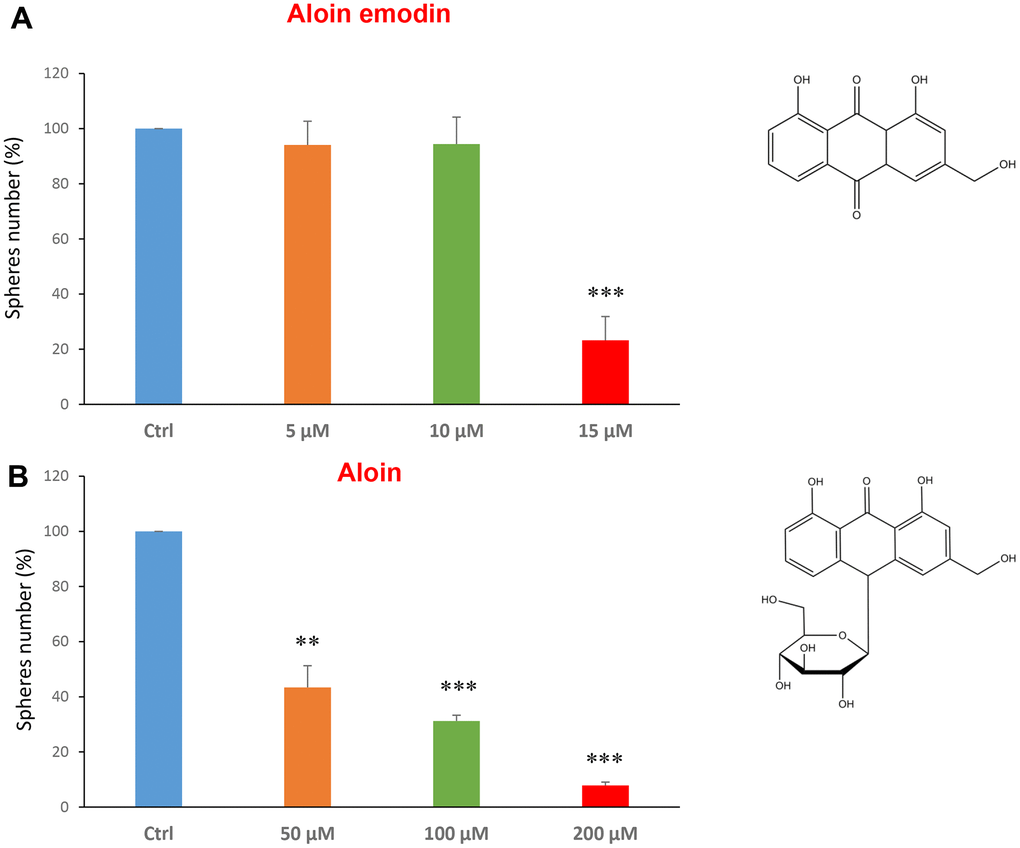
Figure 3. Natural products derived from plant aloe latex decrease mammosphere formation. The effects of two natural products, aloe emodin and aloin, are shown. (A) Aloe emodin is a compound, with similar biological characteristics of aloin, but lacking a sugar moiety. Note that aloe emodin is effective in inhibiting CSC propagation, by >75% at a concentration of 15 μM. Its IC50 is between 10-25 μM. (B) Aloin or barbaloin significantly decreases mammosphere number at a concentration of 50 μM, its IC50. At 200 μM, it reduces the sphere formation by > 90%. Bar graphs are shown as the mean ± SEM; t-test, two-tailed test. **p < 0.01, ***p < 0.001. Chemical formulae are indicated.
Tannic acid is a polyphenol, a specific form of tannin, naturally found in the nutgalls made by insects on twigs of oak trees. It has been also used as embalming material of mummies in ancient Egypt [35, 36]. Tannic acid is a potent anti-oxidant with anti-proliferative effects on diverse types of cancer [37]. Tannic acid was tested at the concentrations of 10, 25 and 50 μM, revealing an IC50 of approximately 25 μM (Figure 4A).
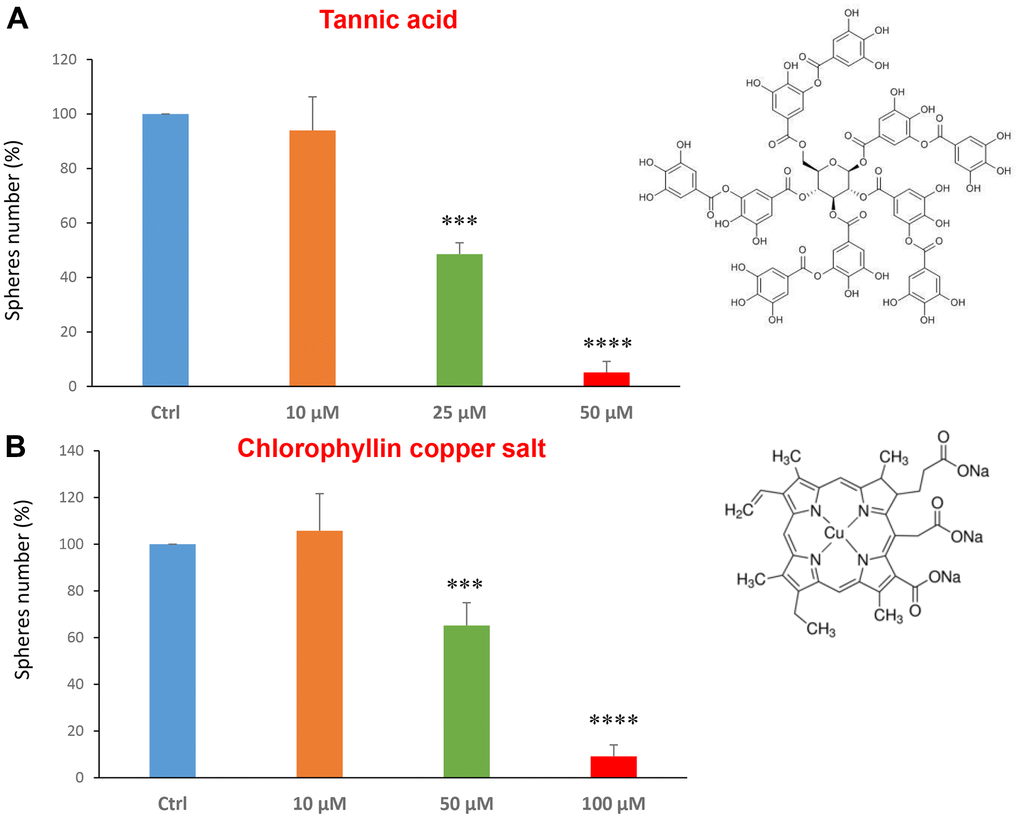
Figure 4. Natural products, tannic acid and chlorophyllin, were able to decrease mammosphere formation. We tested the effects of more natural compounds, such as tannic acid and chlorophyllin copper salt. (A) Tannic acid is a type of polyphenol. Interestingly, it is effective in inhibiting CSC propagation, at concentrations >10 μM; its IC50 is 25 μM. (B) Chlorophyllin is a derivative of chlorophyll which significantly decreases the mammosphere number starting at a concentration of 50 μM and reduces propagation by > 90% at a concentration of 100 μM. Bar graphs are shown as the mean ± SEM; t-test, two-tailed test. ***p < 0.001, ****p < 0.0001. Chemical formulae are indicated.
Chlorophyll is present in green leaves of vegetables as spinach and is a food colouring agent. It has been shown exhibit anti-oxidant and anti-apoptotic effects [38, 39]. Figure 4B shows the results obtained with chlorophyllin, which has its IC50 in the range between 50 and 100 μM.
The last two compounds in this category were azelaic acid and adipic acid (Figure 5A, 5B). Azelaic acid is found in wheat, rye and barley. It inhibits mitochondrial enzymes of the respiratory chain and enzymes involved in DNA synthesis showing antiproliferative and cytotoxic effects in melanoma, bladder and breast cancers, and leukaemia [40–42]. Adipic acid is used mainly in the production of nylon and is also used as a food additive [43, 44]. Azelaic acid displayed effectiveness starting at a concentration of 2.5 mM, with an IC50 between 5 and 10 mM; note that at 10 mM the propagation of CSCs was completely halted. Similarly, adipic acid also showed promising inhibitory effects.
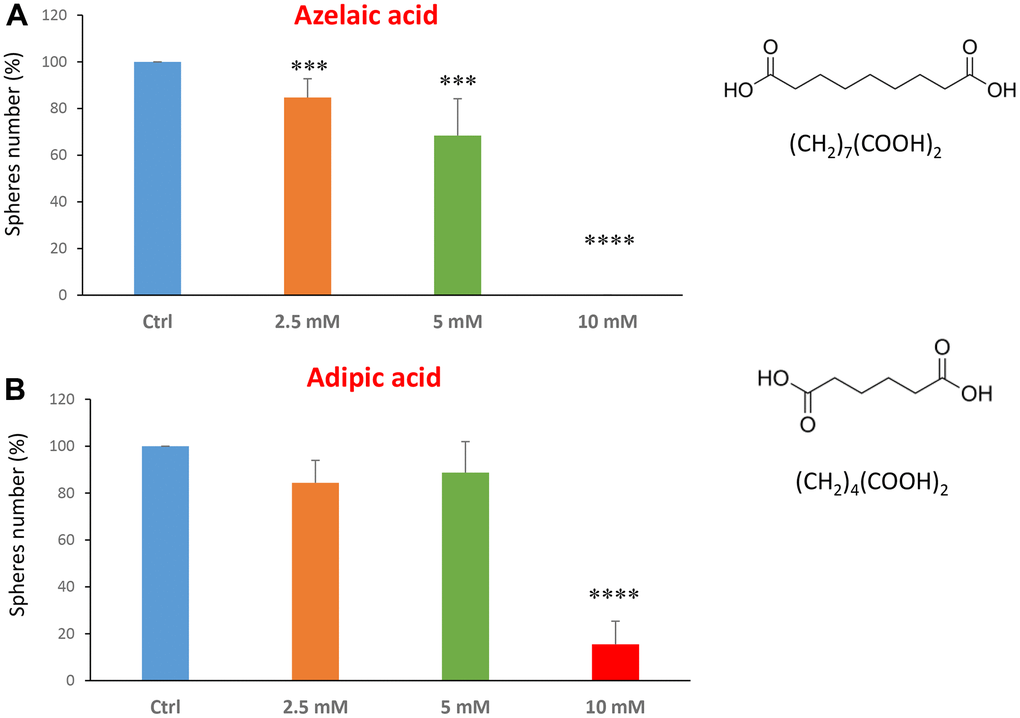
Figure 5. Natural products, azelaic and adipic acids, decrease mammosphere formation. Finally, we tested the effects of two more natural compounds, such as azelaic acid and adipic acid. (A) Azelaic acid is a saturated dicarboxylic acid and it is effective in inhibiting CSC propagation, starting at a concentration of 2.5 mM, with complete inhibition at a concentration of 10 mM. (B) Adipic acid is another dicarboxylic acid that significantly blocks CSC propagation, with near complete inhibition at 10 mM, similarly to azelaic acid. Bar graphs are shown as the mean ± SEM; t-test, two-tailed test. ***p < 0.001, ****p < 0.0001. Chemical formulae are indicated.
We next investigated flavour-related compounds, such as citral and limonene (Figure 6A, 6B). Citral (or lemonal) is naturally present in lemons, oranges and limes. Limonene is used as a flavouring in foods, beverages and chewing gum. Citral had an IC50 between 10-50 μM and limonene greater than 50 μM.
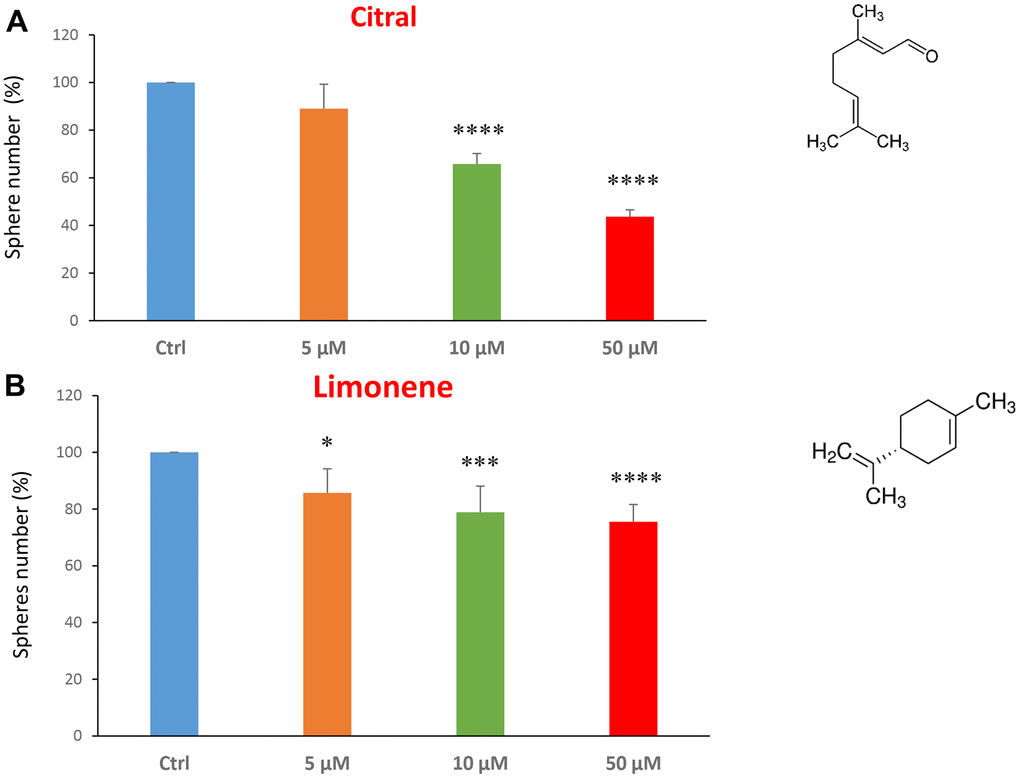
Figure 6. Flavours, citral and limonene, decrease mammosphere formation. Next, we tested the effects of two flavours, such as citral and limonene. (A) Citral or lemonal is effective in inhibiting CSC propagation, starting at the concentration of 10 μM, with an IC50 near 50 μM. (B) Limonene is a flavouring that significantly decreases the mammosphere formation, but was less effective than the closely related molecule, Citral. Bar graphs are shown as the mean ± SEM; t-test, two-tailed test. *p < 0.05, ***p < 0.001, ****p < 0.0001. Chemical formulae are indicated.
Finally, we assessed the effects of two common vitamins on CSCs proliferation: nicotinamide, which is the active form of vitamin B3, and nicotinic acid (a.k.a, niacin). Nicotinamide is an amide form of vitamin B3, and is found in foods like fish, poultry, eggs and is used as a dietary supplement/medication, to prevent and treat pellagra [45]. Nicotinic acid or niacin is the vitamin B3 and is used to reduce elevated levels of cholesterol [46]. Importantly, nicotinamide and nicotinic acid are both precursors of the co-enzymes nicotinamide adenine dinucleotide (NADH) and nicotinamide adenine dinucleotide phosphate (NADPH) [14]. Interestingly, treatment with nicotinamide significantly increased the CSC propagation, at concentrations of 10 and 20 μM. However, nicotinic acid did not show any significant effects at the doses tested (5, 10, or 20 μM) (Figure 7A, 7B).
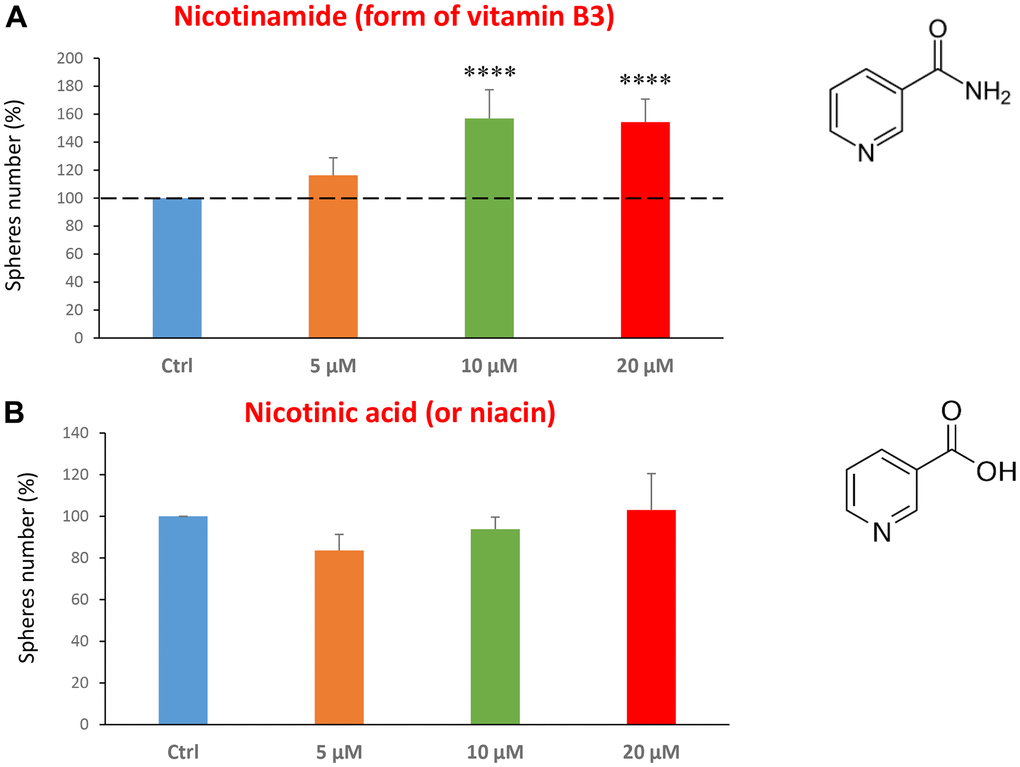
Figure 7. Testing the efficacy of two forms of vitamin B3 on CSC propagation. (A) Nicotinamide, also known as niacinamide, significantly increases CSC propagation by >1.5-fold, at concentrations of 10 and 20 μM. (B) However, Nicotinic acid (or niacin) does not have any effect on mammosphere formation. Bar graphs are shown as the mean ± SEM; t-test, two-tailed test. ****p < 0.0001. Chemical formulae are indicated.
Metabolic validation via seahorse analysis
In the literature, it is well documented that propagation of CSCs depends on several factors including an increased mitochondrial metabolism and biogenesis [7, 47, 48]. In this regard, to address an effect of quercetin, glucosamine and carvedilol on cellular metabolic features, we performed analysis with the Seahorse XF Analyzer after a 48-hours treatment with the compound. We measured oxygen consumption rate (OCR) and extracellular acidification rate (ECAR). Interestingly, quercetin significantly increased the glycolysis at the concentration of 20 μM and reduced the glycolytic reserve and glycolytic reserve capacity (maximal capacity of the cells to respond to a higher ATP demand) at the concentration of 40 μM as compare to the untreated control cells (Figure 8A). Moreover, all the OCR parameters were significantly decreased: basal respiration, proton leak, ATP production, maximal respiration and spare respiratory capacity (Figure 8B). Next, we investigated the effect of glucosamine finding that it was able to significantly increase glycolysis at the concentration of 5 mM and decrease the glycolytic reserve capacity (Figure 9A). Importantly, at 20 mM all OCR parameters were significantly decreased but the spare respiratory capacity which was already negatively affected at the dose of 10 mM (Figure 9B). Lastly, we examined carvedilol to see if it could affect cellular metabolism. We treated MCF7 cells with 25 and 50 μM of carvedilol. Results in Figure 10A show that this drug dramatically negatively affected all ECAR parameters, at the maximal concentration of 50 μM. At the dose of 25 μM only glycolytic reserve and glycolytic reserve capacity were significantly decreased. On the contrary, glycolysis was increased more than three times perhaps as an attempt to compensate for the dramatic decrease in all the parameters related to the oxygen consumption rate. Indeed, OCR analysis highlighted that carvedilol had a powerful capability in decreasing the mitochondrial respiration (Figure 10B).
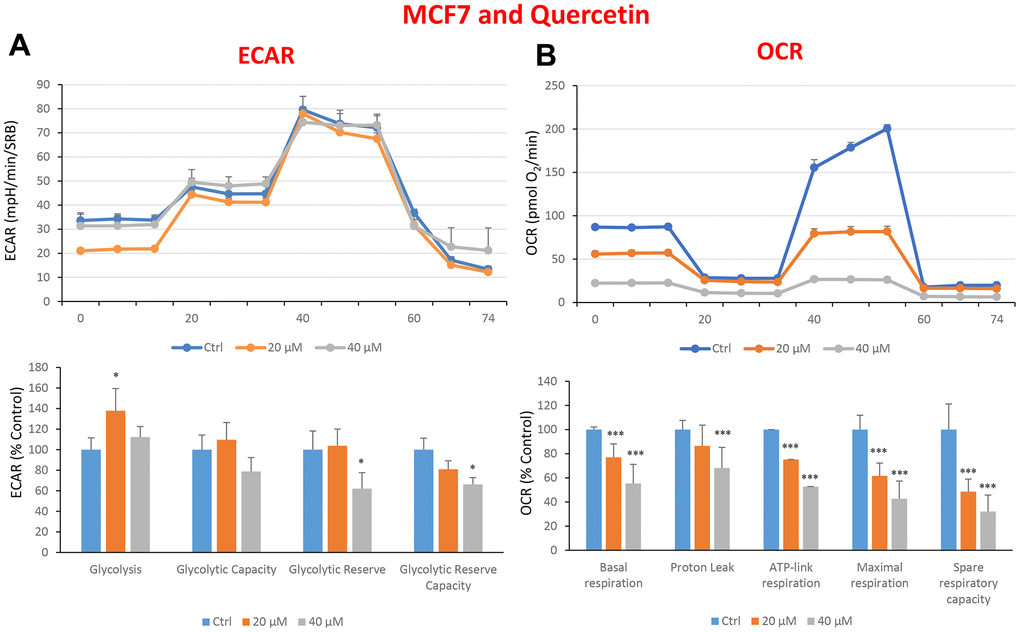
Figure 8. Treatment with quercetin preferentially reduces mitochondrial oxygen consumption rates in MCF7 cells. Cells were seeded and treated with quercetin, as described above. Briefly, cells were seeded at a density of fifteen thousand in a 96-well format. (A) Extracellular consumption rate (ECAR) was assessed by Seahorse metabolic flux analysis. A representative trace is shown in the top panel. Importantly, quercetin treatment only had minor effects on glycolysis. (B) Oxygen consumption rate (OCR) was measured by Seahorse metabolic flux analysis. A representative trace, in the top panel, shows decreased OCR in samples treated with quercetin (20 and 40 μM), versus the vehicle alone control cells. The bar graph (lower panel) shows that quercetin treatment significantly decreases the basal respiration, ATP production, maximal and spare respiration, as compared to the control cells. In panels A and B, experiments were performed three times independently, with six repeats for each replicate. Bar graphs are shown as the mean ± SEM, t-test, two-tailed test. *p < 0.05, ***p < 0.001.
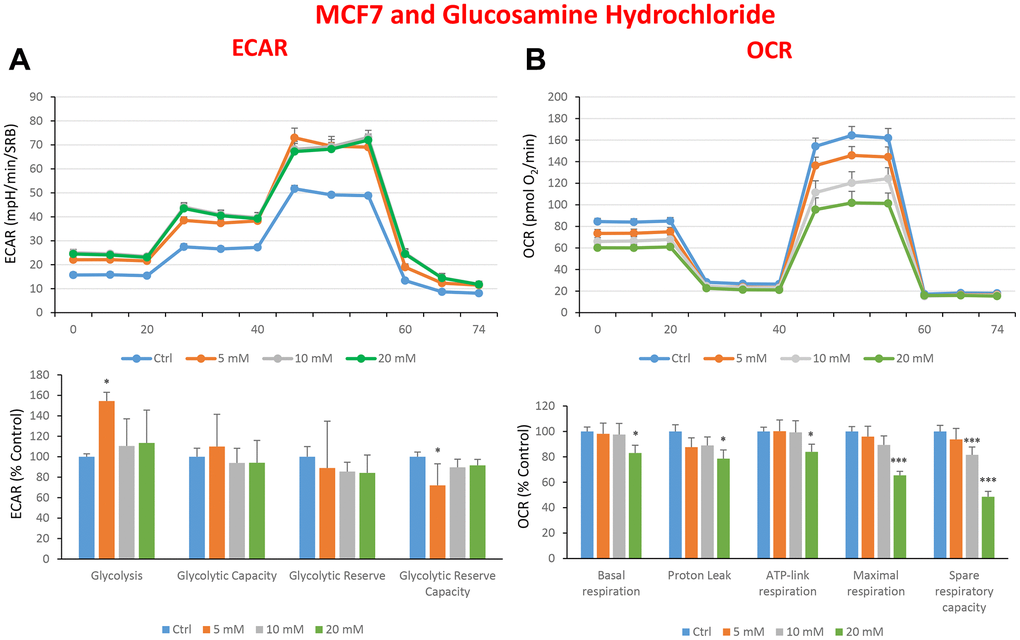
Figure 9. Treatment with glucosamine hydrochloride reduces mitochondrial oxygen consumption rates in MCF7 cells. Cells were seeded and treated with glucosamine, as described above. Briefly, cells were seeded at a density of fifteen thousand in a 96-well format. (A) Extracellular consumption rate (ECAR) was assessed by Seahorse metabolic flux analysis. A representative trace is shown in the top panel. Importantly, glucosamine treatment only had minor effects on glycolysis. (B) Oxygen consumption rate (OCR) was measured by Seahorse metabolic flux analysis. A representative trace, in the top panel, shows decreased OCR in samples treated with glucosamine (20 mM), versus the vehicle alone control cells. The bar graph (lower panel) shows that glucosamine treatment significantly decreases the basal respiration, ATP production, maximal and spare respiration, as compared to the control cells. In panels A and B, experiments were performed three times independently, with six repeats for each replicate. Bar graphs are shown as the mean ± SEM, t-test, two-tailed test. *p < 0.05, ***p < 0.001.
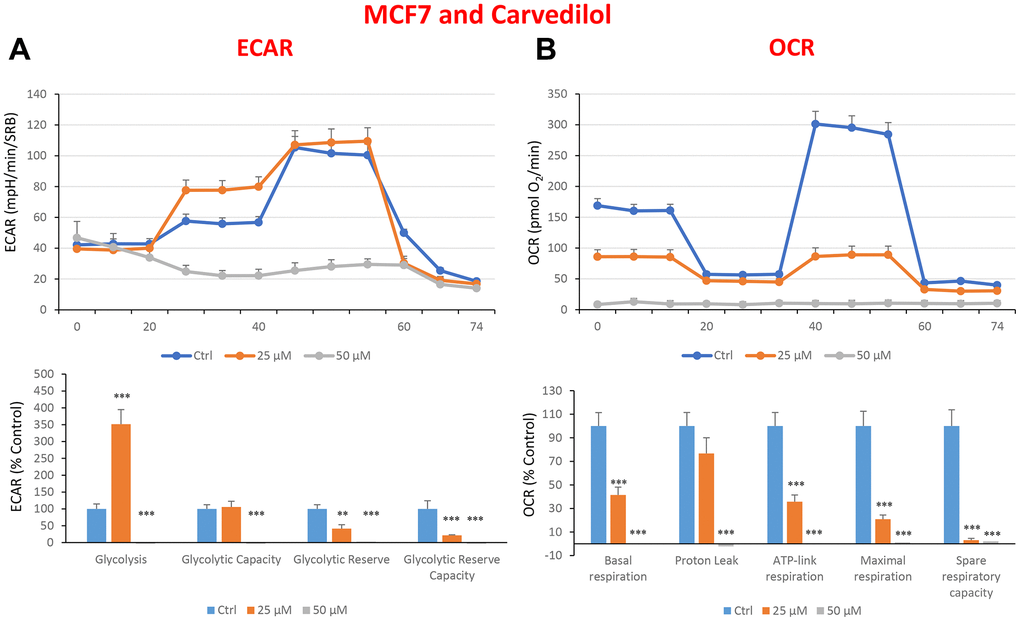
Figure 10. Treatment with carvedilol differentially affects both glycolysis and oxygen consumption rates in MCF7 cells, in a concentration-dependent manner. Cells were seeded and treated with carvedilol, as described above. Briefly, cells were seeded at a density of fifteen thousand in a 96-well format. (A) Extracellular consumption rate (ECAR) was assessed by Seahorse metabolic flux analysis. A representative trace is shown in the top panel. Importantly, carvedilol treatment induced glycolysis by >3.5-fold at 25 μM, but showed dramatic inhibition of glycolysis at 50 μM. (B) Oxygen consumption rate (OCR) was measured by Seahorse metabolic flux analysis. A representative trace, in the top panel, shows progressive decreases in OCR in samples treated with carvedilol (25 and 50 μM), versus the vehicle alone control cells. The bar graph (lower panel) shows that carvedilol treatment significantly decreases the basal respiration, ATP production, maximal and spare respiration, as compared to the control cells. In summary, at 25 μM, carvedilol enhanced glycolysis, but inhibited mitochondrial oxygen consumption. In contrast, at 50 μM, carvedilol inhibited both glycolysis and mitochondrial oxygen consumption. In panels A and B, experiments were performed three times independently, with six repeats for each replicate. Bar graphs are shown as the mean ± SEM, t-test, two-tailed test. *p < 0.05, ***p < 0.001.
Interestingly, in the end what stands out from this more detailed analysis conducted on quercetin, glucosamine and carvedilol, is that what these three compounds have in common is their effects on mitochondrial respiration, and that they are effective in inhibiting the propagation of MCF7 cancer stem-like cells (Figure 11).
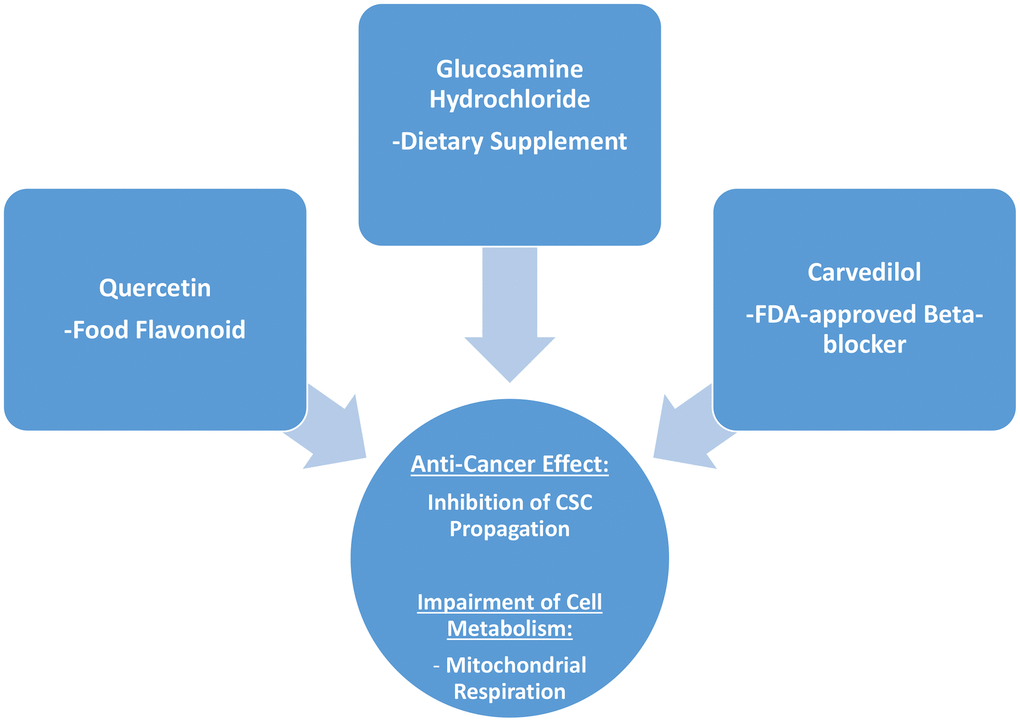
Figure 11. Summary: Identification of natural products and FDA-approved drugs for targeting cancer stem cell (CSC) propagation. This scheme summarizes our current results related to quercetin, glucosamine hydrochloride and carvedilol compounds and their effects on i) CSC propagation and ii) energy metabolism in MCF7 cells. Quercetin is flavonoid found in many foods, glucosamine is a dietary supplement, and carvedilol is an FDA-approved beta-blocker. Intriguingly, although these three compounds are so different in their chemical structure, they share the ability to interfere with mitochondrial metabolism and block the propagation of CSCs.