


Introduction
Prostate cancer has been newly demonstrated to have the third highest incidence of new cases among 36 cancers, behind breast cancer and lung cancer [1]. As the second most common cancer in old males around the world, therapeutic strategies remain fixed, such as radical prostatectomy and radiotherapy for localized prostate cancer and androgen deprivation treatment for advanced and metastatic forms of prostate cancer [2]. Though immunotherapy and targeted therapies have been applied in tumor treatment, the prognostic improvement for advanced prostate cancer is still slight. The pathogenesis of prostate cancer, especially progressing to metastatic castration-resistant prostate cancer (mCRPC), is a sophisticated process. Due to a boom in the field of genetics and bioinformatics, several large-scale genomic studies indicated the existence of mutations, rearrangements, gene fusion, and DNA copy number changes in primary and advanced prostate cancer [3, 4]. Therefore, there is an urgent need to link genetic abnormalities with strategies administered in personalized treatment for prostate cancer patients.
Shugoshin 2 (SGO2, also known as SGOL2), which is tightly involved in the cell cycle process, has been reported to protect cohesion, sustain the linkage of chromosomes and regulate kinetochore-microtubule attachment in meiosis and mitosis [5–10]. Additionally, SGOL2 modulates the function of the subtelomere and improves HSP70 expression during heat shock to support cell survival and protein homeostasis [11, 12]. A growing body of evidence indicates that SGOL2 is a novel molecule with profound significance in cancer and related fields. Up to now, what is clear is that SGOL2 has been reported as a differentially expressed gene in various types of cancer, including glioma, hepatocellular cancer, and endometrial cancer [13–15]. Previous studies had demonstrated that SGOL2 had a protein-protein interaction with BRCA1, whose variants were regarded as biomarkers to predict the survival prognosis of prostate cancer patients [16, 17]. However, the role of SGOL2 in prostate cancer development and progression remains incompletely understood.
Ubiquitin is an 8.5-kDa, 76 amino acid polypeptide, which was first described in the structure of chromosomal conjugate-protein A24 as a post-translational modifier [18, 19]. The process of ubiquitination is a sequential enzymatic cascade, including three enzymatic steps: a ubiquitin-activating enzyme (E1), a ubiquitin-conjugating enzyme (E2), and a ubiquitin ligase (E3) [20]. Ubiquitination is a dynamically multifaceted post-translational modification involved in many physiological activities, such as cell cycle, autography, tumorigenesis, etc. A lot of ubiquitination modifications were responsible for the development and progression of prostate cancer. Previous studies indicated that E3 ligase MDM2, STUB1, and DCAF11 were involved in androgen receptor degradation and induced androgen receptor targeted therapy resistance [21–23]. TRAF4, an E3 ubiquitin ligase, could mediate TrkA ubiquitination to active TrkA signaling pathway and thus modulate prostate cancer progression with the presence of NGF [24]. All in all, exploration of ubiquitination modifications in prostate cancer is of great significance to develop efficient therapeutic targets.
In our study, SGOL2 was highly expressed in prostate cancer compared to adjacent tissue and confirmed as a pro-tumor regulator. Further exploration of the downstream mechanism elucidated that SGOL2 positively regulated RAB1A expression, a member of the GTPase family, by inhibiting its ubiquitination modification. Finally, based on our bioinformatic findings, we conjectured that SGOL2 and RAB1A both contributed to tumor microenvironment (TME) modulation in prostate cancer.
Results
SGOL2 was overexpressed in prostate cancer and strongly associated with cancer development
Considering the potential role of SGOL2 in tumorigenesis and cancer development, we first detected SGOL2 expression in prostate cancer in UALCAN [25], which revealed a significantly higher SGOL2 expression in prostate cancer tissues than in adjacent normal tissues. Moreover, SGOL2 expression tightly correlated with clinical stage and lymphatic metastasis (P<0.001) (Figure 1A–1C). We performed immunohistochemistry (IHC) to detect SGOL2 expression among 91 prostate cancer patients, which indicated that higher-grade prostate cancer expressed higher SGOL2 expression (Figure 1D). Furthermore, we evaluated the potential correlation between SGOL2 protein expression and clinicopathological characteristics and found that SGOL2 expression positively correlated with Gleason Score (r=0.213, P=0.043), pathological grade (r=0.285, P=0.007), lymphatic metastasis (r=0.341, P<0.001) and clinical stage (r=0.409, P<0.001). It demonstrated that the level of SGOL2 had no significant effect on age (P=0.180) and primary tumor volume (P=0.268) (Table 1 and Supplementary Table 2).
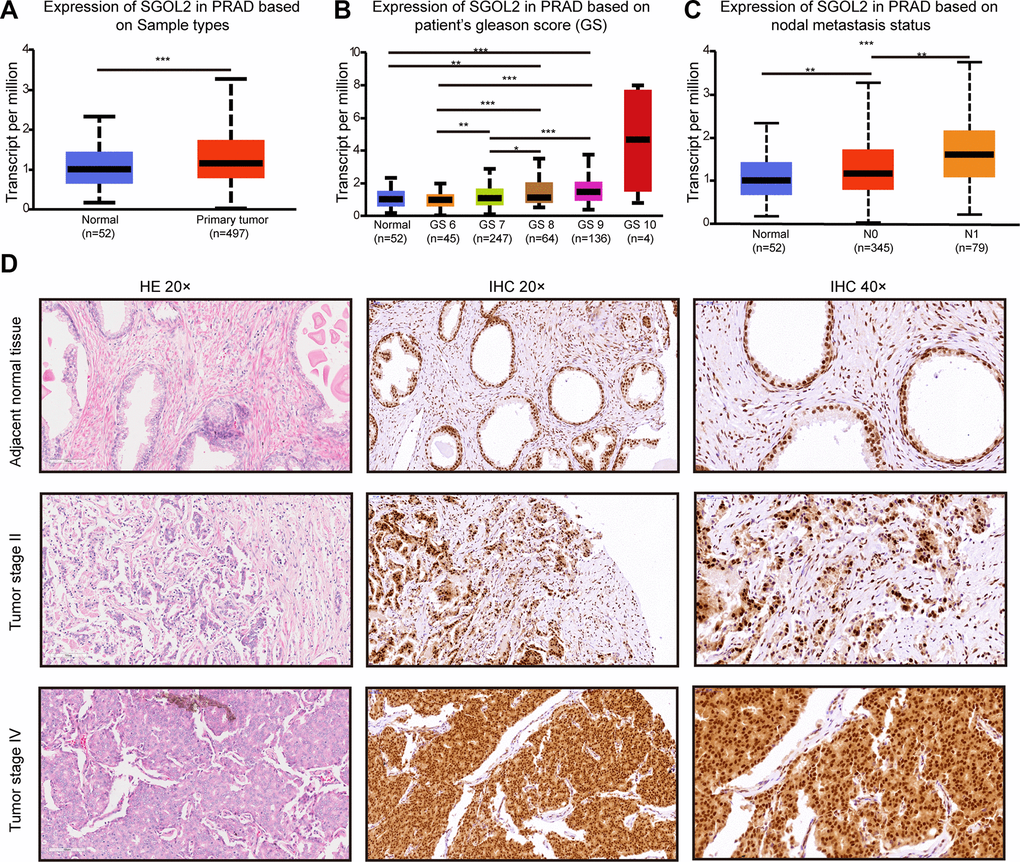
Figure 1. The levels of SGOL2 expression upregulated in prostate cancer. (A) TCGA analysis showed SGOL2 expression in prostate cancer tissue and adjacent normal tissue. (B) The relationship between SGOL2 expression and the Gleason score of patients. (C) Correlation between SGOL2 expression and nodal metastasis status. (D) Representative IHC images for SGOL2 expression level in prostate cancer tissue microarrays. *, P<0.05; **, P<0.01; ***, P<0.001.
Table 1. Relationship between SGOL2 expression and tumor characteristics in patients with prostate cancer.
| Features | Number of patients | SGOL2 expression | p value | ||||||||||||||||||||||||||||||||||||||||||||||||||||||||||||||||||||||||||||||||||||||||||||||||
| Low | High | ||||||||||||||||||||||||||||||||||||||||||||||||||||||||||||||||||||||||||||||||||||||||||||||||||
| All patients | 91 | 44 | 47 | ||||||||||||||||||||||||||||||||||||||||||||||||||||||||||||||||||||||||||||||||||||||||||||||||
| Age (years) | 0.180 | ||||||||||||||||||||||||||||||||||||||||||||||||||||||||||||||||||||||||||||||||||||||||||||||||||
| ≤71 | 43 | 24 | 19 | ||||||||||||||||||||||||||||||||||||||||||||||||||||||||||||||||||||||||||||||||||||||||||||||||
| >71 | 48 | 20 | 28 | ||||||||||||||||||||||||||||||||||||||||||||||||||||||||||||||||||||||||||||||||||||||||||||||||
| Gleason Score | 0.043* | ||||||||||||||||||||||||||||||||||||||||||||||||||||||||||||||||||||||||||||||||||||||||||||||||||
| ≤7 | 50 | 29 | 21 | ||||||||||||||||||||||||||||||||||||||||||||||||||||||||||||||||||||||||||||||||||||||||||||||||
| >7 | 41 | 15 | 26 | ||||||||||||||||||||||||||||||||||||||||||||||||||||||||||||||||||||||||||||||||||||||||||||||||
| Grade | 0.007** | ||||||||||||||||||||||||||||||||||||||||||||||||||||||||||||||||||||||||||||||||||||||||||||||||||
| 1 | 6 | 5 | 1 | ||||||||||||||||||||||||||||||||||||||||||||||||||||||||||||||||||||||||||||||||||||||||||||||||
| 2 | 24 | 17 | 7 | ||||||||||||||||||||||||||||||||||||||||||||||||||||||||||||||||||||||||||||||||||||||||||||||||
| 3 | 20 | 7 | 13 | ||||||||||||||||||||||||||||||||||||||||||||||||||||||||||||||||||||||||||||||||||||||||||||||||
| 4 | 18 | 6 | 12 | ||||||||||||||||||||||||||||||||||||||||||||||||||||||||||||||||||||||||||||||||||||||||||||||||
| 5 | 23 | 9 | 4 | ||||||||||||||||||||||||||||||||||||||||||||||||||||||||||||||||||||||||||||||||||||||||||||||||
| T Infiltrate | 0.268 | ||||||||||||||||||||||||||||||||||||||||||||||||||||||||||||||||||||||||||||||||||||||||||||||||||
| T2 | 12 | 10 | 2 | ||||||||||||||||||||||||||||||||||||||||||||||||||||||||||||||||||||||||||||||||||||||||||||||||
| T3 | 57 | 25 | 32 | ||||||||||||||||||||||||||||||||||||||||||||||||||||||||||||||||||||||||||||||||||||||||||||||||
| T4 | 16 | 9 | 7 | ||||||||||||||||||||||||||||||||||||||||||||||||||||||||||||||||||||||||||||||||||||||||||||||||
| Lymphatic metastasis (N) | 0.001** | ||||||||||||||||||||||||||||||||||||||||||||||||||||||||||||||||||||||||||||||||||||||||||||||||||
| N0 | 69 | 40 | 29 | ||||||||||||||||||||||||||||||||||||||||||||||||||||||||||||||||||||||||||||||||||||||||||||||||
| N1 | 22 | 4 | 18 | ||||||||||||||||||||||||||||||||||||||||||||||||||||||||||||||||||||||||||||||||||||||||||||||||
| Stage | 0.000*** | ||||||||||||||||||||||||||||||||||||||||||||||||||||||||||||||||||||||||||||||||||||||||||||||||||
| 2 | 10 | 9 | 1 | ||||||||||||||||||||||||||||||||||||||||||||||||||||||||||||||||||||||||||||||||||||||||||||||||
| 3 | 59 | 31 | 28 | ||||||||||||||||||||||||||||||||||||||||||||||||||||||||||||||||||||||||||||||||||||||||||||||||
| 4 | 22 | 4 | 18 | ||||||||||||||||||||||||||||||||||||||||||||||||||||||||||||||||||||||||||||||||||||||||||||||||
| *, P<0.05; **, P<0.01; ***, P<0.001. | |||||||||||||||||||||||||||||||||||||||||||||||||||||||||||||||||||||||||||||||||||||||||||||||||||
The shSGOL2 model was constructed and evaluated in prostate cancer cell lines
To select appropriate cell lines, we detected the SGOL2 expression through quantitative real-time PCR (qRT-PCR) in LNCaP, DU145, PC-3, C4-2, 22RV1 prostate cancer cell lines compared to RWPE-1 and WPMY. We also detected SGOL2 expression through Western blot (WB) in LNCaP, DU145, PC-3, C4-2, and RWPE-1. We found higher SGOL2 expression in prostate cancer cell lines at both the mRNA and protein dimensions (Figure 2A, 2B). And thus, LNCaP and DU145 were used as cell models to carry out a subsequent series of assays to assess proliferative and migratory abilities of prostate cancer cells. We downregulated SGOL2 expression of DU145 and LNCaP using shSGOL2 lentivirus, evaluated the transfection efficiency by WB, and chose shSGOL2-1 and shSGOL2-3 to construct appropriate prostate cell lines for further analysis (Figure 2C, 2D).
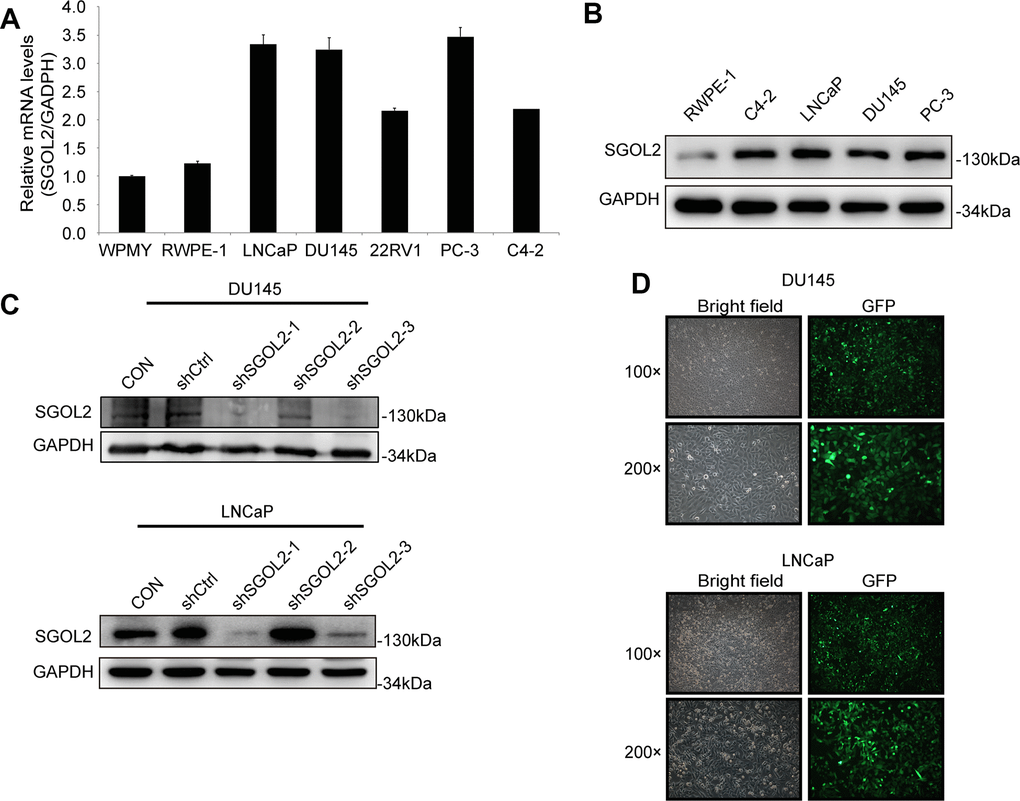
Figure 2. The construction of the shSGOL2 model was evaluated in prostate cancer cell lines. (A) Expression level of SGOL2 was detected in normal prostate cell lines and prostate cancer cell lines by qRT-PCR. (B) Efficiency of SGOL2 knockdown was accessed by WB in different cell lines. (C) Efficiency of SGOL2 knockdown was examined by WB in DU145 and LNCaP. (D) The fluorescence intensity and morphology of infected cells were observed in DU145 and LNCaP.
SGOL2 knockdown inhibited prostate cancer proliferation and migration in vitro
Then, we next assessed and examined the proliferation and migration in vitro by depleting SGOL2 expression. After infection, the CCK8 assays revealed that SGOL2 knockdown slowed down cell proliferation (P<0.001) (Figure 3A). Comparable to primary tumor cell lines, SGOL2 depletion in vitro led to a decrease in the rate of cell survival (P<0.001) (Figure 3B). The results of the wound-healing assay indicated a significant reduction in migration of prostate cancer cell lines by SGOL2 knockdown (Figure 3C). Consistently, ectopic suppression of SGOL2 arrested prostate cancer cells in the S phase (P<0.001) and may delay the cell cycle process (Figure 3D). Transwell assays presented that the cell migration was inhibited when SGOL2 was knocked down (P<0.001) (Figure 3E). In summary, these loss-of-function results illustrated that SGOL2 promoted tumor proliferation and metastasis in vitro.
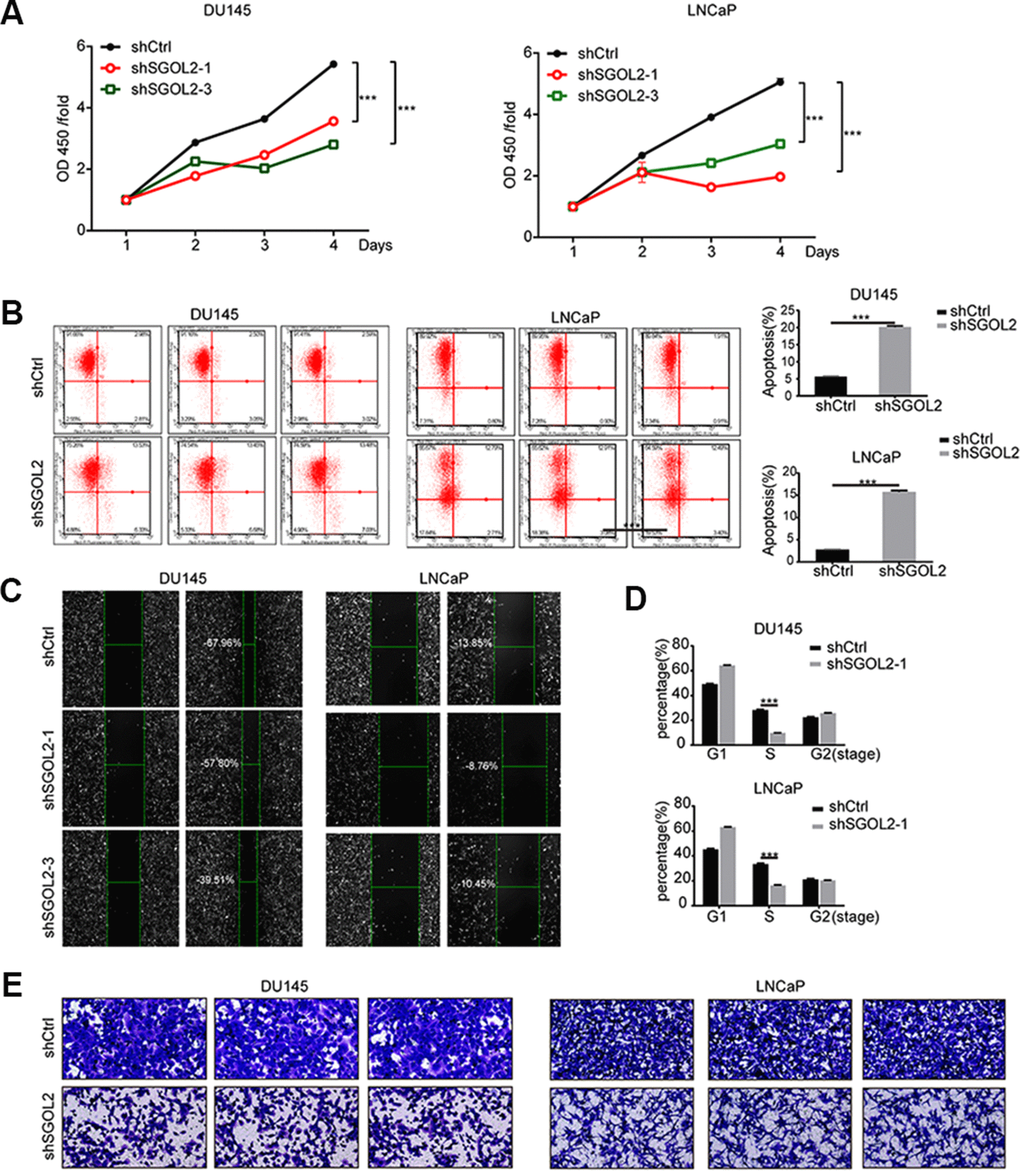
Figure 3. SGOL2 deletion inhibited prostate cancer proliferation and migration. (A) Cell proliferation was measured by CCK8 assay at 24h, 48h, 72h, and 96h after transfecting with shSGOL2-1, shSGOL2-3 and the control group for 48h. (B) Apoptosis of prostate cancer was performed after knocking down SGOL2 (shRNA-3) for 48h. (C) Wound-healing assay presented the metastatic ability in shSGOL2-3 and shCtrl groups. (D) Cell cycle assay revealed the proportion of cells in different cell phases after transfection. (E) Transwell assay presented the migratory cells between shSGOL2-3 and the control group. *, P<0.05; **, P<001; ***, P<0.001.
SGOL2 stabilized RAB1A expression through decreasing RAB1A ubiquitination
We next set out to address the potential factors by which SGOL2 regulated the growth of prostate cancer in vitro by performing mass spectrometry (Figure 4A and Supplementary Figure 1A) to indicate the differentially expressed proteins upon SGOL2 knockdown. GEPIA 2.0 represented a moderate correlation between SGOL2 and RAB1A in prostate cancer, consistent with mass spectrometry prediction (Supplementary Figure 1C). Moreover, WB analysis following co-immunoprecipitation (Co-IP) also identified the relationship between the two proteins in DU145 and LNCaP (Figure 4B and Supplementary Figure 1B). In accordance with evidence from these existing results, we speculated that SGOL2 might regulate the expression of RAB1A. Subsequently, SGOL2 knockdown with RAB1A downregulation invoked the possibility that SGOL2 could contribute to RAB1A expression (Figure 4C). We further explored the underlying mechanism involved in the regulation of RAB1A. It has been widely recognized that ubiquitination, which acts as a widespread posttranslational modification, could modulate many intracellular events by regulating the activity of functional proteins in spatial and temporal dimensions [26]. The prior addition of cycloheximide (CHX) in vitro inhibits protein synthesis for various periods of time. Reduction in RAB1A expression in shSGOL2 models compared to the control group (Figure 4D). An IP assay in vitro also showed that SGOL2 contributed to the stabilization of RAB1A by ubiquitination decrease (Figure 4D, 4E). Proteins that modified by ubiquitin are degraded generally through the proteasomal pathway. As the main pathway to mediate protein degradation, we tried to confirm whether SGOL2 delayed the degradation of RAB1A through inhibiting proteasome activities. Cell lines were both treated with proteasome inhibitor MG132. As shown in Figure 4F, SGOL2 mediated RAB1A stabilization partly in the proteasome-dependent pathway (Figure 4F). Thus, these results indicated that RAB1A expression regulated by SGOL2 was subject to inhibit proteasomal degradation.
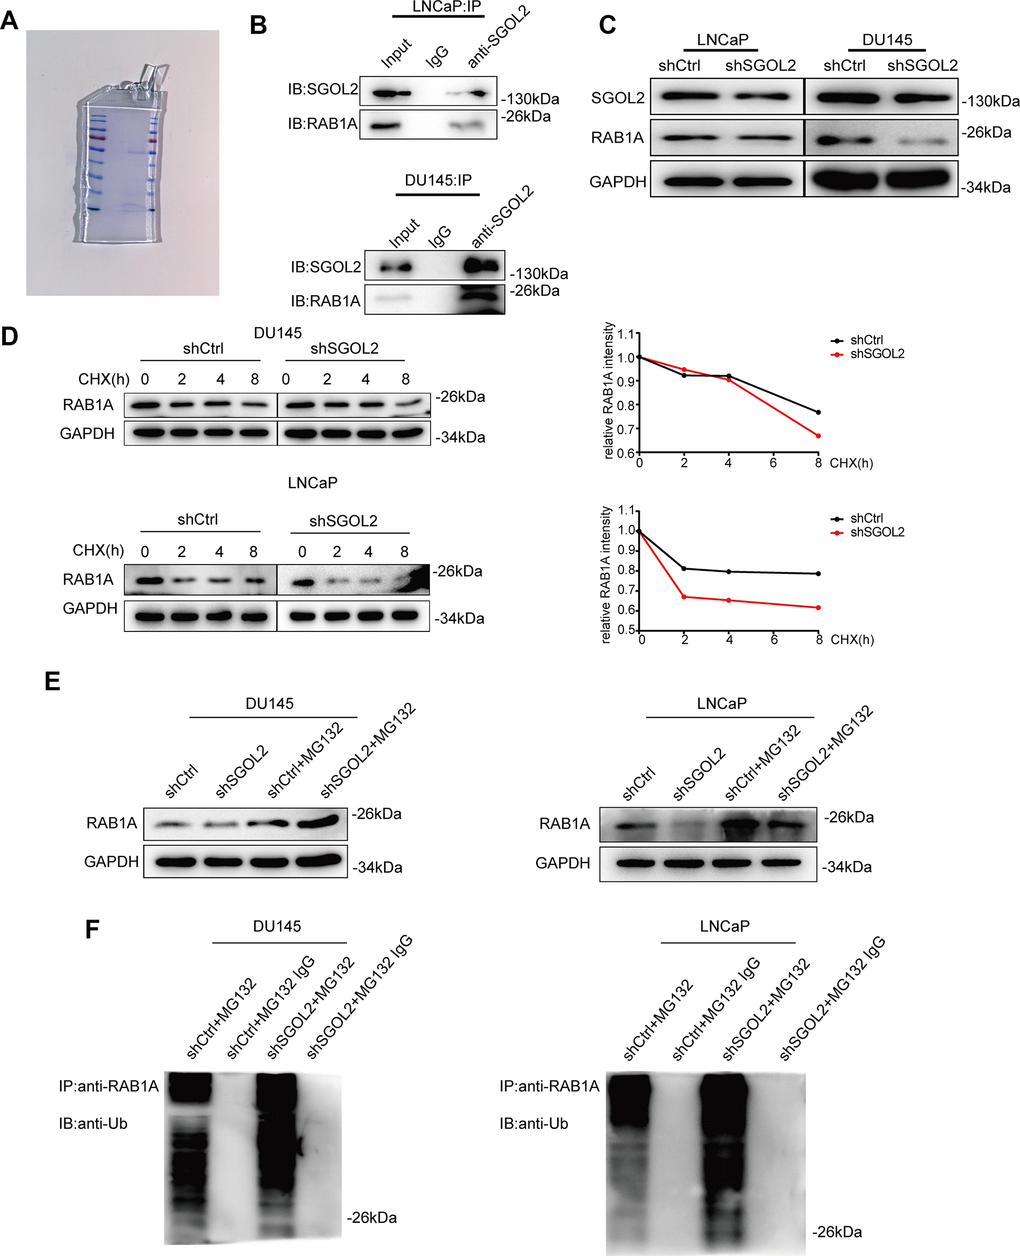
Figure 4. SGOL2 stabilized RAB1A via a ubiquitination-dependent pathway. (A) SDS-PAGE of the control group (left) and shSGOL2 group (right) was stained by Coomassie Blue Staining Solution. (B) Cell lysates were subjected to Co-IP with specific antibodies to examine the interaction between SGOL2 and RAB1A. (C) Detect RAB1A expression as in A in DU145 and LNCaP. (D) At 48h post-infection, WB analysis of RAB1A expression in shSGOL2 cell lines treated with CHX for 0, 2, 4, 8h compared to the control group. (E) Treated with protease inhibitor MG132 for 8h, cells were lysed and subjected to WB for RAB1A expression. (F) WB analysis for IPs performed with anti-ubiquitin antibody to detect SGOL2-mediated RAB1A ubiquitination.
SGOL2 knockdown inhibited RAB1A expression to suppress prostate cancer progression
In order to confirm the role of SGOL2/RAB1A regulatory axis in prostate cancer, we constructed four cell models using SGOL2 knockdown lentivirus and RAB1A overexpression (OE) lentivirus (control group, shSGOL2 + RAB1A-OE group, shSGOL2 group, RAB1A-OE group). RAB1A overexpression promoted prostate cancer cell proliferation (Supplementary Figure 1E). The combination of shSGOL2 with RAB1A overexpression had similar inhibitory effects on tumor growth and reversed the shSGOL2 effects on proliferation ability (Figure 5A, 5B). Transwell migration assay revealed that RAB1A overexpression enhanced metastasis in vitro (Figure 5C, 5D). Taken together, SGOL2 was a novel regulator of RAB1A to regulate prostate cancer development in vitro.
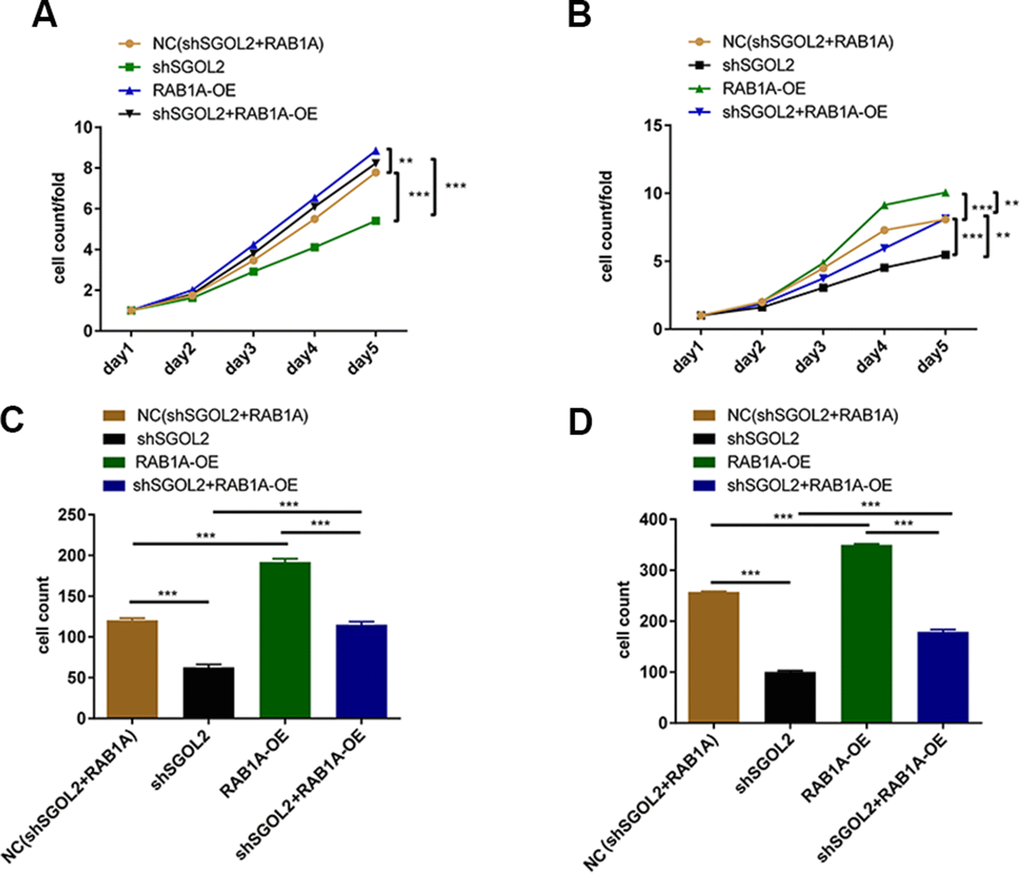
Figure 5. Control group, shSGOL2 + RAB1A-OE group, shSGOL2 group, RAB1A-OE group after transfecting with corresponding plasmids were subjected to the proliferation by Celigo cell counting assay in DU145 (A) and LNCaP (B), cell migration by transwell assay in DU145 (C) and LNCaP (D).
SGOL2 and RAB1A influenced TME of prostate cancer
To figure out whether SGOL2 and RAB1A influence TME in prostate cancer, we downloaded the dataset of prostate cancer patients (n=450) from the TCGA database. Correlational analysis of immune infiltration was calculated and visualized by corrplot package. Results showed that the immune microenvironment of the SGOL2-high group included more primary B cells and M1 macrophages, fewer CD8+ T cells, and resting mast cells compared to the SGOL2-low group (Figure 6A). Additionally, high RAB1A expression may induce activated CD4+T cells and M1 macrophages, in addition, inhibit Treg cells production (Figure 6B). Results presented that SGOL2 and RAB1A may regulate the TME in prostate cancer.
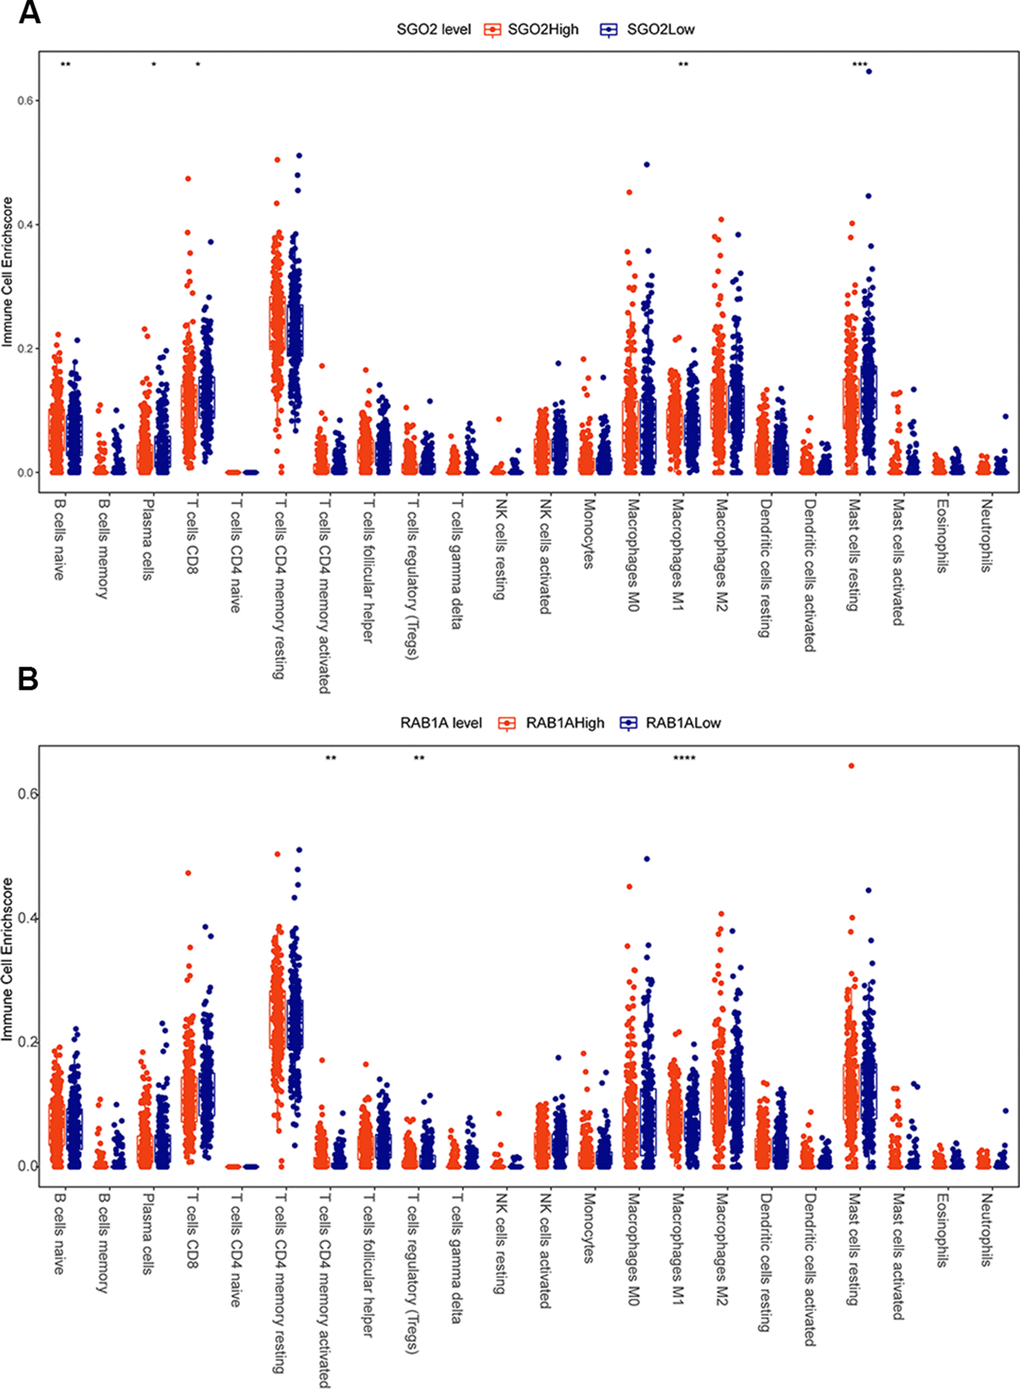
Figure 6. SGOL2 and RAB1A may regulate the microenvironment of prostate cancer. TCGA analysis displayed the relationship between SGOL2 (A), RAB1A (B) expression and immune cell enrichment.
Discussion
Progression of prostate cancer is a complex multi-step process accompanied with genetic mutations and TME modulation [27]. In recent years, molecular characteristics of localized, metastatic, and recurrent prostate cancer patients have contributed to formulate therapeutic strategies. Given the current situation, an increasing body of studies focus on exploring underlying molecular mechanisms related to prostate cancer progression [28–30]. Herein, our findings showed that SGOL2, which expressed differently between prostate cancer tissue and para-cancer tissue, was positively associated with clinical stage, histopathological grade, lymphatic metastasis, and survival prognosis. In vitro, SGOL2 deletion inhibited proliferation and migration, increased cell apoptosis, along with the arrest of cell cycle S/G2. To explore the potential mechanism of how SGOL2 influenced tumor progression, we focused on the expression of its downstream proteins. Mass spectrometry, correlation analysis, and Co-IP jointly confirmed that SGOL2 played a critical role in RAB1A regulation in prostate cancer. Our findings revealed the oncogenic role of SGOL2 in the progression of prostate cancer, highlighting the tremendous possibility of SGOL2 being a promising biomarker for prostate cancer.
RAB GTPases, as part of the largest family of small GTPases, are involved in multiple diseases in many species, especially in humans [31]. RAB1A not only functions as a crucial regulator of vesicular transportation from endoplasmic reticulum to Golgi but also influences material metabolism [32, 33]. Moreover, RAB1A has been reported to activated mTORC1, Wnt, IL-4R/JAK1/STAT6 signaling pathways [34–36]. Additionally, a dynamic balance of ubiquitination and deubiquitination is a key mechanism controlling cellular RAB1A levels. For instance, USP2a, a deubiquitinating enzyme, stabilized RAB1A to promote cancer progression and metastasis in hepatocellular carcinoma [37]. E3 ubiquitin ligase RNF115 catalyzed RAB1A ubiquitination to interrupt TLRs transportation and TLRs-mediated immune response [38]. In the data reported herein, SGOL2 was for the first time found to inhibit the RAB1A ubiquitination process in a protease-dependent pathway. These reports, together with our findings, indicated that SGOL2 might play pivotal roles in prostate cancer development by upregulating RAB1A level.
Ubiquitin modification draws support from E1, E2, and E3 enzymes to complete the ubiquitination process and positively participates in cancer development. E3 ubiquitin ligases, as the most important components in the ubiquitination process, have the substrate specificity to target specific proteins [39]. However, there is no report revealing that SGOL2 acts as an E3 ubiquitin ligase or contains a specific domain or motif such as HECT, RING, and F-box [40–42]. Therefore, we conjectured that there existed one E3 ligase in the process of SGOL2-mediated RAB1A ubiquitination, which should be subsequently confirmed by a series of assays to figure out the involved E3 ubiquitin ligase. In this study, SGOL2 knockdown not only inhibited the degradation of RAB1A but also downregulated RAB1A mRNA expression (Supplementary Figure 1D). We confirmed that ubiquitination modification got involved in RAB1A regulation. As to transcriptional regulation, further studies are required to characterize this regulated manner.
Recent progress in immunotherapy based on checkpoint blockade has made no inspiring outcome in mCRPC. Chronic inflammation in the adult prostate is regarded as a risk factor contributing to tumorigenesis. Additionally, inflammation probably occurs in genomic mutations and rearrangements [43, 44]. RAB1A activated TLR4-dependent NF-KB signaling through transporting TLR4 to the membrane and promoted IL-1β and IL-18 generation and maturation [45]. To explore the underlying mechanism by which SGOL2 and RAB1A regulate TME in prostate cancer, SGOL2 and RAB1A both were predicted to regulate immune cell infiltration of prostate cancer, including lymphocytes and myeloid cells. Our findings indicated that SGOL2 probably stabilized RAB1A to regulate TME and this result contributed to our understanding of prostate cancer.
In summary, our study convincingly indicated that, as a new tumor promotor, the overexpression of SGOL2 was associated with increased proliferative and metastatic properties in prostate cancer. Further study revealed that SGOL2 inhibited RAB1A ubiquitination in a proteasome-dependent method. At last, we speculated both SGOL2 and RAB1A were involved in modulating TME, which provided a direction to develop the efficiency of prostate cancer treatment. Generally, our data demonstrated that SGOL2 and RAB1A might be used to detect cancer progression and act as potential therapeutic targets in prostate cancer.
Materials and Methods
Immunohistochemistry (IHC) analysis
Tissue Microarray (HProA150CS01-M-018, OUTDO BIOTECH) was deparaffinized with xylene, rehydrated using ethanol and running water. Then 1×EDTA buffer was used for antigen retrieval at 100° C for 30 minutes and cooled to room temperature. TMA blocked with goat serum was incubated with SGOL2 antibody overnight at 4° C, then incubated with secondary anti-rabbit antibody. Incubated TMA was visualized by diaminobenzidine (AIDISHENG, ADS053W0) and counterstained with hematoxylin for 10-15 seconds. After washing with running water and dehydrating by ethanol, the coverslip was glued onto slides with neutral balsam. Immunoreactivity was scored by the percentage of the stained cells (0, no staining; 1, 0-25%; 2, 25-50%; 3, 50-75%; 4, ≥75%) and the intensity of staining in cellular plasma, membrane and nuclear (0, no color; 1, slight yellow; 2, yellow brown; 3, brown). Finally, multiply the two values and estimate the purpose of the TMA (0, negative; 1-4, positive +; 5-8, positive ++; 9-12, positive +++). According to the expression of SGOL2, we halved and analyzed the relationship between SGOL2 expression levels and clinical characteristics [46].
Cell culture
Human prostate cancer cell lines 22RV1 and C4-2 were obtained from Bena Technology (Hangzhou, Zhejiang, China). DU145, PC-3, and LNCaP were respectively purchased from Research R&S (Shanghai, China), Genechem (Shanghai, China), and Fenghui Biotechnology (Changsha, Hunan, China). Normal prostate epithelial cell line WPMY was obtained from the Center for Excellence in Molecular Cell Science (Shanghai, China). 22RV1, PC-3, C4-2, LNCaP, and DU145 were cultured in RPMI 1640 (Viva Cell, C3010-0500) and 10% fetal bovine serum (FBS, Gibco,10091-148). RWPE-1 was cultured in Defined K-SFM (Gibco, 10744019) with 10% FBS. WPMY was cultured in DMEM (Meilunbio, MA0212) containing 10% FBS. All cell lines were cultured in a humidified incubator with 5% CO2 at 37° C.
Primers
Primers in RT-qPCR: GAPDH, forward 5’-TGACTTCAACAGCGACACCCA-3’ and reverse 5’-CACCCTGTTGCTGTAGCCAAA-3’; SGOL2, forward 5’-TGAGATGAGAAACGCCCAGTC-3’ and reverse 5’-TTCCCAAGATGACCCACGCT-3’.
RNA extraction and qRT-PCR
Total RNA was extracted from the cultured cells with TriQuick Reagent (Solarbio, R1100-500ml) following a standard protocol. The quality was assessed by Nanodrop 2000/2000C spectrophotometer (Thermo, Waltham, MA, USA). cDNA was acquired via reverse transcription on Hiscript QRT supermix for PCR (+gDNA WIPER) (Vazyme, R123-01) instruction manual. The relative quantitative analysis of gene expression was calculated by the 2-ΔΔCt method compared to the control group.
Western blotting (WB)
Total protein was extracted from the cultured cells with lysis buffer (Beyotime, P0013) and protein concentration was measured by BCA Protein Assay Kit (Beyotime, P0009). Protein was separated by 10% SDS-PAGE and transferred to the PVDF membranes. The membranes were blocked with TBST containing 5% no-fat milk for 1 hour and incubated with primary antibodies at 4° C overnight. After washing the membrane three times with 1×TBST, the membranes were incubated with specified secondary antibodies for 1 hour. Then these membranes were illuminated by using an immobilon Western Chemiluminescent HRP Substrate kit (Millipore) after washing with 1×TBST [46]. All the samples were washed twice in phosphate-buffered saline (PBS) before isolating the proteins.
Co-immunoprecipitation (Co-IP) and IP assay
Cultured cells were lysed in lysis buffer (Beyotime, P0013) with a protease inhibitor and the concentration of protein was measured by BCA Protein Assay Kit (Beyotime, P0009). For Co-IP, SGOL2 and RABIA antibodies mixed with magnetic beads were incubated with protein samples overnight at 4° C. Separate proteins from magnetic beads and detect protein by WB as mentioned above. For IP, a ubiquitin antibody was used to detect the ubiquitination of proteins. Antibodies were arranged in Supplementary Table 1.
Mass spectrometry (MS)
Cells with SGOL2 deletion and controlled cells were lysed. Then proteins were extracted from cells and measured concentration. 10% SDS-PAGE were stained with Coomassie Blue Staining Solution for 1 hour or more. After Stained SDS-PAGE was decolorized, selected appropriate parts to detect protein via MS technology.
CCK8 assay, wound-healing assay, transwell assay
The viability of cells was evaluated by a CCK8 assay following the manufacturer’s instructions. Cells infected for 48h were trypsinized and seeded 3000 cells per well in a 96-well plate. After that, cells were cultured in 100ul complete medium and added 10ul CCK8 (Meilunbio, MA0218) per well. After incubating for 3 hours at 37° C, the absorbance at 450nm was detected at 24h, 48h, 72h, 96h and 120h.
Wound-healing assay was used to detect migratory ability. Cells were seeded in a 96-well plate of 50000 cells/well and cultured in 100ul complete medium. Wound healing assay was prepared by drawing a vertical line in the center of the well, changing the medium with no FBS, and detecting the weight of lines to assess the migratory ability.
Transwell assay was performed via Boyden chamber with 8.0μm pore size (Corning, CLS3422) where 50000 cells were incubated at 37° C. Add 100ul RPMI 1640 in the upper chamber and 600ul RPMI 1640 with 30% FBS in the lower chamber. After 20 hours of incubation at 37° C with 5% CO2, metastatic cells were dyed with 0.1% Crystal Violet Stain solution (Solarbio, G1063) for 3 min.
Apoptosis assay and cell cycle assay
Cells were trypsinized and washed with Annexin V Binding Buffer (10 ×, diluted with PBS) (Invitrogen, 2094083). And add 10ul Annexin V-APC (Elascience, E-CK-A117) in a concentration of 7-8×10⁵ cells/ml, then incubated for 15 minutes in the dark to detect the percentage of apoptosis. Cell cycle assay was detected on the manufacturer’s instructions.
Celigo cell counting assay
Cells infected for 48h were trypsinized and seeded 3000 cells per well in a 96-well plate. After that, cells were cultured in 100ul complete medium at 37° C with 5% CO2 for 5 days. Celigo image cytometer (Nexcelon Bioscience, Lawrence, MA, USA) counted cell number every day.
Ubiquitination assays
Cells infected by lentivirus were cultured in 6-well plates or 10 cm plates for 5 days. DU145 and LNCaP cells were treated with 10mmol/ml cycloheximide (CHX) (Selleckchem, S741802) in 1.5ml complete medium at several time points. Proteasome inhibitor MG132 (10mmol/ml) (Mechem Express, HY-13259) was mixed with 1.5ml complete medium per cell in 6-well plates and 7.5ml complete medium in 10cm dishes for 8h. Cells were respectively subjected to WB and IP.
Samples and data preprocessing
A total of 450 cases of prostate cancer were downloaded from The Cancer Genome Atlas (TCGA, https://portal.gdc.cancer.gov/) and further assessed the infiltration of the immune cell using the Cibersort algorithm and ssGSEA algorithm of the GSVA package [48]. The expression data of 450 samples was divided into SGOL2-high group and SGOL2-low group based on median expression of SGOL2, and so did RAB1A. Correlation analysis of immune infiltration was calculated and visualized by corrplot package. Data analysis mentioned above was processed via R 4.0.3.
Statistical analysis
Continuous variables were shown as the mean ± SD, P values, and standard deviation using Student’s t-test, in which P<0.05 was considered statistically significant, and one-way ANOVA was used to compare multiple separate groups. All statistical analysis was performed using SPSS 17.0 (IBM, SPSS, Chicago, IL, USA) and Graphpad Prism 6.01 (Graphpad Software, La Jolla, CA, USA). Apply Mann-Whitney U analysis and Spearman analysis to evaluate the correlation between the two groups. *, P < 0.05; **, P < 0.01; and ***, P < 0.001.
Abbreviations
CRPC: castration-resistant prostate cancer; mCRPC: metastatic castration-resistant prostate cancer; PPI: protein-protein interaction; MS: mass spectrum; TME: tumor microenvironment; IHC: immunohistochemistry; FBS: fetal bovine serum; RNAi: RNA interference; WB: western blotting; Co-IP: co-immunoprecipitation; MS: mass spectrometry; CHX: cycloheximide.
Author Contributions
Zhiyu Wang was responsible for designing experiments, supervising and validating in the process of experiment. Tingting Lv carried out the experiment and wrote the original manuscript. Dongwei He, Xiaojin Guo and Zijie Li helped with the review and editing of the draft. Aili Zhang and Bo Fan contributed to samples collection.
Acknowledgments
We acknowledge TCGA database for providing their platforms and contributors for uploading their meaningful datasets.
Conflicts of Interest
The authors declare no conflicts of interest.
Funding
This research was funded by National Natural Science Foundation of China (No. 81872101) and Natural Science Foundation of Hebei Province (No. H2020206572).
References
- 1. Shackleton EG, Ali HY, Khan M, Pockley GA, McArdle SE. Novel Combinatorial Approaches to Tackle the Immunosuppressive Microenvironment of Prostate Cancer. Cancers (Basel). 2021; 13:1145. https://doi.org/10.3390/cancers13051145 [PubMed]
- 2. Beretta GL, Zaffaroni N. Necroptosis and Prostate Cancer: Molecular Mechanisms and Therapeutic Potential. Cells. 2022; 11:1221. https://doi.org/10.3390/cells11071221 [PubMed]
- 3. Chen S, Zhu G, Yang Y, Wang F, Xiao YT, Zhang N, Bian X, Zhu Y, Yu Y, Liu F, Dong K, Mariscal J, Liu Y, et al. Single-cell analysis reveals transcriptomic remodellings in distinct cell types that contribute to human prostate cancer progression. Nat Cell Biol. 2021; 23:87–98. https://doi.org/10.1038/s41556-020-00613-6 [PubMed]
- 4. Wang G, Zhao D, Spring DJ, DePinho RA. Genetics and biology of prostate cancer. Genes Dev. 2018; 32:1105–40. https://doi.org/10.1101/gad.315739.118 [PubMed]
- 5. Clift D, Marston AL. The role of shugoshin in meiotic chromosome segregation. Cytogenet Genome Res. 2011; 133:234–42. https://doi.org/10.1159/000323793 [PubMed]
- 6. El Yakoubi W, Buffin E, Cladière D, Gryaznova Y, Berenguer I, Touati SA, Gómez R, Suja JA, van Deursen JM, Wassmann K. Mps1 kinase-dependent Sgo2 centromere localisation mediates cohesin protection in mouse oocyte meiosis I. Nat Commun. 2017; 8:694. https://doi.org/10.1038/s41467-017-00774-3 [PubMed]
- 7. Huang H, Feng J, Famulski J, Rattner JB, Liu ST, Kao GD, Muschel R, Chan GK, Yen TJ. Tripin/hSgo2 recruits MCAK to the inner centromere to correct defective kinetochore attachments. J Cell Biol. 2007; 177:413–24. https://doi.org/10.1083/jcb.200701122 [PubMed]
- 8. Javerzat JP. Molecular biology. Directing the centromere guardian. Science. 2010; 327:150–1. https://doi.org/10.1126/science.1184770 [PubMed]
- 9. Kitajima TS, Kawashima SA, Watanabe Y. The conserved kinetochore protein shugoshin protects centromeric cohesion during meiosis. Nature. 2004; 427:510–7. https://doi.org/10.1038/nature02312 [PubMed]
- 10. Xu Z, Cetin B, Anger M, Cho US, Helmhart W, Nasmyth K, Xu W. Structure and function of the PP2A-shugoshin interaction. Mol Cell. 2009; 35:426–41. https://doi.org/10.1016/j.molcel.2009.06.031 [PubMed]
- 11. Takii R, Fujimoto M, Matsumoto M, Srivastava P, Katiyar A, Nakayama KI, Nakai A. The pericentromeric protein shugoshin 2 cooperates with HSF1 in heat shock response and RNA Pol II recruitment. EMBO J. 2019; 38:e102566. https://doi.org/10.15252/embj.2019102566 [PubMed]
- 12. Tashiro S, Handa T, Matsuda A, Ban T, Takigawa T, Miyasato K, Ishii K, Kugou K, Ohta K, Hiraoka Y, Masukata H, Kanoh J. Shugoshin forms a specialized chromatin domain at subtelomeres that regulates transcription and replication timing. Nat Commun. 2016; 7:10393. https://doi.org/10.1038/ncomms10393 [PubMed]
- 13. Deng M, Li S, Mei J, Lin W, Zou J, Wei W, Guo R. High SGO2 Expression Predicts Poor Overall Survival: A Potential Therapeutic Target for Hepatocellular Carcinoma. Genes (Basel). 2021; 12:876. https://doi.org/10.3390/genes12060876 [PubMed]
- 14. Jiang SS, Ke SJ, Ke ZL, Li J, Li X, Xie XW. Cell Division Cycle Associated Genes as Diagnostic and Prognostic Biomarkers in Hepatocellular Carcinoma. Front Mol Biosci. 2021; 8:657161. https://doi.org/10.3389/fmolb.2021.657161 [PubMed]
- 15. Kao Y, Tsai WC, Chen SH, Hsu SY, Huang LC, Chang CJ, Huang SM, Hueng DY. Shugosin 2 is a biomarker for pathological grading and survival prediction in patients with gliomas. Sci Rep. 2021; 11:18541. https://doi.org/10.1038/s41598-021-97119-4 [PubMed]
- 16. McNevin CS, Cadoo K, Baird AM, Murchan P, Sheils O, McDermott R, Finn S. Pathogenic BRCA Variants as Biomarkers for Risk in Prostate Cancer. Cancers (Basel). 2021; 13:5697. https://doi.org/10.3390/cancers13225697 [PubMed]
- 17. Rodriguez J, Pilkington R, Garcia Munoz A, Nguyen LK, Rauch N, Kennedy S, Monsefi N, Herrero A, Taylor CT, von Kriegsheim A. Substrate-Trapped Interactors of PHD3 and FIH Cluster in Distinct Signaling Pathways. Cell Rep. 2016; 14:2745–60. https://doi.org/10.1016/j.celrep.2016.02.043 [PubMed]
- 18. Goldknopf IL, Busch H. Isopeptide linkage between nonhistone and histone 2A polypeptides of chromosomal conjugate-protein A24. Proc Natl Acad Sci USA. 1977; 74:864–8. https://doi.org/10.1073/pnas.74.3.864 [PubMed]
- 19. Goldknopf IL, French MF, Musso R, Busch H. Presence of protein A24 in rat liver nucleosomes. Proc Natl Acad Sci USA. 1977; 74:5492–5. https://doi.org/10.1073/pnas.74.12.5492 [PubMed]
- 20. Inobe T, Matouschek A. Paradigms of protein degradation by the proteasome. Curr Opin Struct Biol. 2014; 24:156–64. https://doi.org/10.1016/j.sbi.2014.02.002 [PubMed]
- 21. Liu C, Lou W, Yang JC, Liu L, Armstrong CM, Lombard AP, Zhao R, Noel ODV, Tepper CG, Chen HW, Dall’Era M, Evans CP, Gao AC. Proteostasis by STUB1/HSP70 complex controls sensitivity to androgen receptor targeted therapy in advanced prostate cancer. Nat Commun. 2018; 9:4700. https://doi.org/10.1038/s41467-018-07178-x [PubMed]
- 22. Vellky JE, Ricke WA. Development and prevalence of castration-resistant prostate cancer subtypes. Neoplasia. 2020; 22:566–75. https://doi.org/10.1016/j.neo.2020.09.002 [PubMed]
- 23. Zhang X, Luukkonen LM, Eissler CL, Crowley VM, Yamashita Y, Schafroth MA, Kikuchi S, Weinstein DS, Symons KT, Nordin BE, Rodriguez JL, Wucherpfennig TG, Bauer LG, et al. DCAF11 Supports Targeted Protein Degradation by Electrophilic Proteolysis-Targeting Chimeras. J Am Chem Soc. 2021; 143:5141–9. https://doi.org/10.1021/jacs.1c00990 [PubMed]
- 24. Singh R, Karri D, Shen H, Shao J, Dasgupta S, Huang S, Edwards DP, Ittmann MM, O’Malley BW, Yi P. TRAF4-mediated ubiquitination of NGF receptor TrkA regulates prostate cancer metastasis. J Clin Invest. 2018; 128:3129–43. https://doi.org/10.1172/JCI96060 [PubMed]
- 25. Chandrashekar DS, Bashel B, Balasubramanya SAH, Creighton CJ, Ponce-Rodriguez I, Chakravarthi BVS, Varambally S. UALCAN: A Portal for Facilitating Tumor Subgroup Gene Expression and Survival Analyses. Neoplasia. 2017; 19:649–58. https://doi.org/10.1016/j.neo.2017.05.002 [PubMed]
- 26. Cai C, Tang YD, Zhai J, Zheng C. The RING finger protein family in health and disease. Signal Transduct Target Ther. 2022; 7:300. https://doi.org/10.1038/s41392-022-01152-2 [PubMed]
- 27. Andersen LB, Nørgaard M, Rasmussen M, Fredsøe J, Borre M, Ulhøi BP, Sørensen KD. Immune cell analyses of the tumor microenvironment in prostate cancer highlight infiltrating regulatory T cells and macrophages as adverse prognostic factors. J Pathol. 2021; 255:155–65. https://doi.org/10.1002/path.5757 [PubMed]
- 28. Eggener SE, Rumble RB, Armstrong AJ, Morgan TM, Crispino T, Cornford P, van der Kwast T, Grignon DJ, Rai AJ, Agarwal N, Klein EA, Den RB, Beltran H. Molecular Biomarkers in Localized Prostate Cancer: ASCO Guideline. J Clin Oncol. 2020; 38:1474–94. https://doi.org/10.1200/JCO.19.02768 [PubMed]
- 29. Sandhu S, Moore CM, Chiong E, Beltran H, Bristow RG, Williams SG. Prostate cancer. Lancet. 2021; 398:1075–90. https://doi.org/10.1016/S0140-6736(21)00950-8 [PubMed]
- 30. Sung H, Ferlay J, Siegel RL, Laversanne M, Soerjomataram I, Jemal A, Bray F. Global Cancer Statistics 2020: GLOBOCAN Estimates of Incidence and Mortality Worldwide for 36 Cancers in 185 Countries. CA Cancer J Clin. 2021; 71:209–49. https://doi.org/10.3322/caac.21660 [PubMed]
- 31. Shan MM, Sun SC. The multiple roles of RAB GTPases in female and male meiosis. Hum Reprod Update. 2021; 27:1013–29. https://doi.org/10.1093/humupd/dmab019 [PubMed]
- 32. Wang X, Liu F, Qin X, Huang T, Huang B, Zhang Y, Jiang B. Expression of Rab1A is upregulated in human lung cancer and associated with tumor size and T stage. Aging (Albany NY). 2016; 8:2790–8. https://doi.org/10.18632/aging.101087 [PubMed]
- 33. Thomas JD, Zhang YJ, Wei YH, Cho JH, Morris LE, Wang HY, Zheng XF. Rab1A is an mTORC1 activator and a colorectal oncogene. Cancer Cell. 2014; 26:754–69. https://doi.org/10.1016/j.ccell.2014.09.008 [PubMed]
- 34. Yang XZ, Chen XM, Zeng LS, Deng J, Ma L, Jin C, Wang R, Wang MH, Wen YF, Wu XL, Wang HY, Cui SZ. Rab1A promotes cancer metastasis and radioresistance through activating GSK-3β/Wnt/β-catenin signaling in nasopharyngeal carcinoma. Aging (Albany NY). 2020; 12:20380–95. https://doi.org/10.18632/aging.103829 [PubMed]
- 35. Zhang X, Wang X, Yuan Z, Radford SJ, Liu C, Libutti SK, Zheng XFS. Amino acids-Rab1A-mTORC1 signaling controls whole-body glucose homeostasis. Cell Rep. 2021; 34:108830. https://doi.org/10.1016/j.celrep.2021.108830 [PubMed]
- 36. Huang T, Chen B, Wang F, Cai W, Wang X, Huang B, Liu F, Jiang B, Zhang Y. Rab1A promotes IL-4R/JAK1/STAT6-dependent metastasis and determines JAK1 inhibitor sensitivity in non-small cell lung cancer. Cancer Lett. 2021; 523:182–94. https://doi.org/10.1016/j.canlet.2021.10.008 [PubMed]
- 37. Xiong B, Huang J, Liu Y, Zou M, Zhao Z, Gong J, Wu X, Qiu C. Ubiquitin-specific protease 2a promotes hepatocellular carcinoma progression via deubiquitination and stabilization of RAB1A. Cell Oncol (Dordr). 2021; 44:329–43. https://doi.org/10.1007/s13402-020-00568-8 [PubMed]
- 38. Zhang ZD, Li HX, Gan H, Tang Z, Guo YY, Yao SQ, Liuyu T, Zhong B, Lin D. RNF115 Inhibits the Post-ER Trafficking of TLRs and TLRs-Mediated Immune Responses by Catalyzing K11-Linked Ubiquitination of RAB1A and RAB13. Adv Sci (Weinh). 2022; 9:e2105391. https://doi.org/10.1002/advs.202105391 [PubMed]
- 39. Hoeller D, Dikic I. Targeting the ubiquitin system in cancer therapy. Nature. 2009; 458:438–44. https://doi.org/10.1038/nature07960 [PubMed]
- 40. Hynes-Smith RW, Wittorf KJ, Buckley SM. Regulation of Normal and Malignant Hematopoiesis by FBOX Ubiquitin E3 Ligases. Trends Immunol. 2020; 41:1128–40. https://doi.org/10.1016/j.it.2020.10.003 [PubMed]
- 41. Jackson PK, Eldridge AG, Freed E, Furstenthal L, Hsu JY, Kaiser BK, Reimann JD. The lore of the RINGs: substrate recognition and catalysis by ubiquitin ligases. Trends Cell Biol. 2000; 10:429–39. https://doi.org/10.1016/s0962-8924(00)01834-1 [PubMed]
- 42. Li Y, Xie P, Lu L, Wang J, Diao L, Liu Z, Guo F, He Y, Liu Y, Huang Q, Liang H, Li D, He F. An integrated bioinformatics platform for investigating the human E3 ubiquitin ligase-substrate interaction network. Nat Commun. 2017; 8:347. https://doi.org/10.1038/s41467-017-00299-9 [PubMed]
- 43. Ou T, Lilly M, Jiang W. The Pathologic Role of Toll-Like Receptor 4 in Prostate Cancer. Front Immunol. 2018; 9:1188. https://doi.org/10.3389/fimmu.2018.01188 [PubMed]
- 44. Sfanos KS, Yegnasubramanian S, Nelson WG, De Marzo AM. The inflammatory microenvironment and microbiome in prostate cancer development. Nat Rev Urol. 2018; 15:11–24. https://doi.org/10.1038/nrurol.2017.167 [PubMed]
- 45. Zhang Y, Wang L, Lv Y, Jiang C, Wu G, Dull RO, Minshall RD, Malik AB, Hu G. The GTPase Rab1 Is Required for NLRP3 Inflammasome Activation and Inflammatory Lung Injury. J Immunol. 2019; 202:194–206. https://doi.org/10.4049/jimmunol.1800777 [PubMed]
- 46. Chen D, Wang K, Li X, Jiang M, Ni L, Xu B, Chu Y, Wang W, Wang H, Kang H, Wu K, Liang J, Ren G. FOXK1 plays an oncogenic role in the development of esophageal cancer. Biochem Biophys Res Commun. 2017; 494:88–94. https://doi.org/10.1016/j.bbrc.2017.10.080 [PubMed]
- 47. Kim D, Song J, Jin EJ. BNIP3-Dependent Mitophagy via PGC1α Promotes Cartilage Degradation. Cells. 2021; 10:1839. https://doi.org/10.3390/cells10071839 [PubMed]
- 48. Hänzelmann S, Castelo R, Guinney J. GSVA: gene set variation analysis for microarray and RNA-seq data. BMC Bioinformatics. 2013; 14:7. https://doi.org/10.1186/1471-2105-14-7 [PubMed]