


Introduction
OP is an important public health problem. Accordingly, OP affects more than 200 million people globally [1]. The pathogenesis of OP is the dysregulation of bone remodelling between osteoclasts and osteoblasts [2], resulting in bone mass reduction and bone tissues deterioration, thereby increasing the risk of bone fracture [3]. There are many risk factors of OP, such as age, sex, lifestyle, and genes [4, 5]. The heritability of OP is 60%–80% [6]. Studies report that network of IGF-1, COL2A1, DDR2, SOX9, and PTH involve in osteogenesis [7]. Insulin-like growth factor-1 (IGF-1), a growth-promoting cytokine, mediates metabolism, development, and growth [8] and has extremely important effects on bone growth and mineralization together with growth hormone (GH) [9, 10].
Research has unveiled that lower serum concentrations of IGF-1 significantly associated with the occurrence of osteoporotic fractures in postmenopausal women [11]. In 2002, Lee et al. firstly proposed the relationship of IGF-1 gene polymorphisms to the bone mineral density (BMD) among postmenopausal women [12]. Sequentially, Rivadeneira et al. reported that the promoter of IGF-1 with the microsatellite repeat polymorphism was associated with the BMD level and bone loss in postmenopausal women in a large- scale study [13].
Seven studies examine the correlation between IGF-1 and OP [14–20], of which four studies show that rs35767 is associated with OP in postmenopausal women [14–17]. The results of 2 meta-analysis on IGF-1 and OP show that rs35767 is associated with OP in postmenopausal women [21, 22]. Besides, other studies also show that IGF-1, rs2288377 and rs5742612, are risk factors to OP through regulation of gene expression [20, 23]. Furthermore, three models, the allele, recessive, and dominant inheritance models, were used to evaluate IGF-1's predictability for OP, and the dominant model maybe the actual genetic pattern for IGF-1 and OP [22].
Although two meta-analyses have been published, conclusion of the association between IGF-1 and OP is pending, probably due to limited studies on postmenopausal women [21, 22]. The trial sequential analysis (TSA) provides methodology to assess the creditability of SNP and diseases based on cumulative samples [24]. We designed a case-control study to confirm the relationship of IGF-1 rs35767, rs2288377, and rs5742612 polymorphisms to OP in Taiwan. To substantialize, we also performed a combination of our case-control study and meta-analysis to conclude the association with IGF-1 SNPs and OP based on computation of cumulative samples through TSA.
Materials and Methods
Case-control study
Subjects
Subjects were collected at the Health Management Center of TSGH in a Taipei check-up program from March 2015 to August 2019. The exclusion criteria included: (1) Total hip replacement, (2) Vertebroplasty, (3) Unsuccessful gene sequencing (Supplementary Figure 1). Demographic data contain age, body mass index (BMI), smoking status, and alcohol consumption status. Finally, 317 older adults were recruited in this research.
OP was diagnosed based on WHO criteria for diagnosis of OP as follows [25]: The case group consists of subjects with a lumbar vertebrae BMD T score of ≤ −2.5 (n = 95), and the control group consists of subjects with a lumbar vertebrae BMD T score ≥ −1 (n = 222).
Measurement of BMD
BMD was measured based on the density of the lumbar spine (L1-L4) using the Dual energy X-ray absorptiometry (DXA) during the health examinations at TSGH by using Prodigy Series X-Ray Tube Housing Assembly (GE Medical Systems Lunar, Madison, WI, USA) for all the participants [26].
Genomic DNA extraction and genotyping
Intravenous blood samples (5 mL) from every participant were collected by medical technologists. Genomic DNA of peripheral blood samples was extracted according to standard procedures for proteinase K (Invitrogen, Carlsbad, CA, USA) digestion and the phenol/chloroform method. The polymorphisms of IGF-1 (rs35767, rs2288377, and rs5742612) were determined using iPLEX Gold SNP genotyping. We adopted inter- and intra-replication validation to evaluate the quality of genotyping experiment, including at least 10% of the samples.
Statistical analysis
Continuous variables were shown as mean ± standard deviation and tested using Student’s t-test. We used χ2 test to examine whether there were differences in genotype and allele frequencies between OP patients and healthy controls. To identify the risk of OP, we used logistic regression to estimate odd ratios (ORs) and 95% confidence intervals (CIs). Based on previous studies, the dominant model is suggested to be the most suitable model for examining the relationship of the IGF-1 gene to OP [22]. Therefore, in this study, dominant model was used to determine the risk of genetic polymorphisms to OP. The significance was set as a p-value of <0.05. Statistical analyses were performed in R 3.4.4.
Meta-analysis
Search methods and criteria of included studies
The PRISMA checklist and Genetic Association Studies Checklist of meta-analysis, including the PROSPERO International Prospective Register of Ongoing Systematic Reviews registration number, CRD42022372332, shown in Supplementary Table 1 [27]. We used related terms of “IGF-1” and “OP” to screen the PubMed, EMBASE, Cochrane, and Web of science for articles published up to 31 November 2020 as listed in Supplementary Table 2. Furthermore, articles included in the meta-analysis research were manually checked to avert the omission of vital papers. The criteria of inclusion were listed as following: (1) case-control studies (2) diagnose of OP based on radiological examination (3) genotypes of distribution of IGF-1 in detail. Types of research were discarded from this analysis: (1) case report, comments, reviews, or animal studies (2) Research on non-postmenopausal women.
Data extraction
Data quality was assessed by two authors (Sui-Lung Su and Meng-Chang Lee) independently. We recorded the information of each article as following: (1) surname of the first author; (2) year of publication; (3) country where the research was conducted; (4) sample sizes of cases and control subjects; (5) diagnostic criteria of OP; (6) distribution of genotyping in cases and control subjects; (7) Hardy–Weinberg Equilibrium (HWE) test results of control participants. All chosen articles were evaluated using the Newcastle–Ottawa Scale, and all criteria of scores were set as ≥7 points.
Statistical analysis
We used ORs with 95% CIs to assess the relationship of IGF-1 polymorphisms to the risk of OP in the meta-analysis. The estimation of I2 from the DerSimonian–Laird method was adopted to evaluate heterogeneity, and more than 50% of I2 exhibited a moderate-to-high heterogeneity [28]. We used the random-effects model to get the summary results. Dominant models were used to calculate the association between genetic polymorphism and the risk of OP. We used Egger’s regression and a funnel plot to examine the symmetry of pooled results [29]. A p-value of <0.05 was set as significant criterion. We used the “meta” packages of R 3.4.4 to perform statistical analyses.
For TSA parameter setting, type I error was set as 0.05, heterogeneity was set as 0%, power was set as 80%, and OR was referenced from previous studies and set as 1.3.
Results
Case-control study
Finally, 317 participants were recruited in our case-control study. The demographic data of OP cases and controls is displayed in Table 1. In the control group, there are 222 subjects with a mean age of 71.67 ± 6.19 years. In the case group, there are 95 subjects with a mean age of 71.95 ± 6.76 years. Cases of BMI, waist circumference and hip circumference are significantly lower than those of controls (p < 0.001).
Table 1. Distribution of demographic characteristics in the case and control groups.
| Variables | Control (N = 222) | Case (N = 95) | p-value | ||||||||||||||||||||||||||||||||||||||||||||||||||||||||||||||||||||||||||||||||||||||||||||||||
| Age (Mean ± SD) | 71.67 ± 6.19 | 71.95 ± 6.76 | 0.702 | ||||||||||||||||||||||||||||||||||||||||||||||||||||||||||||||||||||||||||||||||||||||||||||||||
| BMI | 25.06 ± 3.72 | 22.07 ± 3.10 | <0.001* | ||||||||||||||||||||||||||||||||||||||||||||||||||||||||||||||||||||||||||||||||||||||||||||||||
| Waist circumference | 81.74 ± 9.17 | 76.01 ± 8.91 | <0.001* | ||||||||||||||||||||||||||||||||||||||||||||||||||||||||||||||||||||||||||||||||||||||||||||||||
| Hips circumference | 97.83 ± 7.94 | 92.60 ± 5.67 | <0.001* | ||||||||||||||||||||||||||||||||||||||||||||||||||||||||||||||||||||||||||||||||||||||||||||||||
| Smoking | 0.637 | ||||||||||||||||||||||||||||||||||||||||||||||||||||||||||||||||||||||||||||||||||||||||||||||||||
| No | 219 (98.6%) | 93 (97.9%) | |||||||||||||||||||||||||||||||||||||||||||||||||||||||||||||||||||||||||||||||||||||||||||||||||
| Current or former | 3 (1.4%) | 2 (2.1%) | |||||||||||||||||||||||||||||||||||||||||||||||||||||||||||||||||||||||||||||||||||||||||||||||||
| Drinking | 0.310 | ||||||||||||||||||||||||||||||||||||||||||||||||||||||||||||||||||||||||||||||||||||||||||||||||||
| No | 216 (97.3%) | 94 (98.9%) | |||||||||||||||||||||||||||||||||||||||||||||||||||||||||||||||||||||||||||||||||||||||||||||||||
| Current or former | 6 (2.7%) | 1 (1.1%) | |||||||||||||||||||||||||||||||||||||||||||||||||||||||||||||||||||||||||||||||||||||||||||||||||
| BMD | |||||||||||||||||||||||||||||||||||||||||||||||||||||||||||||||||||||||||||||||||||||||||||||||||||
| L1 | −0.44 ± 1.08 | −2.87 ± 0.87 | <0.001* | ||||||||||||||||||||||||||||||||||||||||||||||||||||||||||||||||||||||||||||||||||||||||||||||||
| L2 | −0.25 ± 1.09 | −2.94 ± 0.79 | <0.001* | ||||||||||||||||||||||||||||||||||||||||||||||||||||||||||||||||||||||||||||||||||||||||||||||||
| L3 | 0.09 ± 1.19 | −2.99 ± 0.86 | <0.001* | ||||||||||||||||||||||||||||||||||||||||||||||||||||||||||||||||||||||||||||||||||||||||||||||||
| L4 | 0.45 ± 1.54 | −2.87 ± 1.17 | <0.001* | ||||||||||||||||||||||||||||||||||||||||||||||||||||||||||||||||||||||||||||||||||||||||||||||||
| BMD, bone mineral density. | |||||||||||||||||||||||||||||||||||||||||||||||||||||||||||||||||||||||||||||||||||||||||||||||||||
| Control, BMD T score>-1; Case, BMD T score<-2.5; *, p-value< 0.05. | |||||||||||||||||||||||||||||||||||||||||||||||||||||||||||||||||||||||||||||||||||||||||||||||||||
| The density of the lumbar spine ranges from L1 to L4. | |||||||||||||||||||||||||||||||||||||||||||||||||||||||||||||||||||||||||||||||||||||||||||||||||||
Results of dominant model show none association between IGF-1 and OP (Table 2). In univariable analysis, we found that those with CT+TT genotyping may not have higher risk of OP when compared to those with CC genotyping in the rs35767 [Crude-OR: 0.96 (95% CI: 0.60–1.54)]; similarly, the result is comparable after adjustment with age, BMI, smoking, drinking [Adj-OR: 0.95 (95% CI: 0.56–1.60)]. Likewise, there are none association in the rs2288377 [AT+TT vs AA; Adj-OR: 1.15 (95% CI: 0.67–1.97)] and rs5742612 [TC+CC vs TT; Adj-OR: 1.07 (95% CI: 0.62–1.83)] with OP under adjustment with age, BMI, smoking, and drinking. To substantialize, we incorporated samples from the case-control study into the meta-analysis and conducted TSA in sequential analysis.
Table 2. Distribution of IGF-1 genotypes in case and control groups.
| Control N=222 | Case N=95 | Crude-OR (95%CI) | p-value | Adjust-OR (95%CI) | p-value | ||||||||||||||||||||||||||||||||||||||||||||||||||||||||||||||||||||||||||||||||||||||||||||||
| rs35767 | 0.835 | 0.381 | |||||||||||||||||||||||||||||||||||||||||||||||||||||||||||||||||||||||||||||||||||||||||||||||||
| CC | 95(42.8%) | 39(41.1%) | 1 | 1 | |||||||||||||||||||||||||||||||||||||||||||||||||||||||||||||||||||||||||||||||||||||||||||||||
| CT | 104(46.8%) | 44(46.3%) | 1.03 (0.62 - 1.72) | 0.908 | 0.91 (0.51 - 1.62) | 0.753 | |||||||||||||||||||||||||||||||||||||||||||||||||||||||||||||||||||||||||||||||||||||||||||||
| TT | 23(10.4%) | 12(12.6%) | 1.27 (0.58 - 2.80) | 0.553 | 1.70 (0.70 - 4.15) | 0.24 | |||||||||||||||||||||||||||||||||||||||||||||||||||||||||||||||||||||||||||||||||||||||||||||
| Dominant | 0.876 | 0.841 | |||||||||||||||||||||||||||||||||||||||||||||||||||||||||||||||||||||||||||||||||||||||||||||||||
| CC | 95(42.8%) | 39(41.1%) | 1 | 1 | |||||||||||||||||||||||||||||||||||||||||||||||||||||||||||||||||||||||||||||||||||||||||||||||
| CT+TT | 127(57.2%) | 56(58.9%) | 0.96 (0.60 - 1.54) | 0.95 (0.56 - 1.60) | |||||||||||||||||||||||||||||||||||||||||||||||||||||||||||||||||||||||||||||||||||||||||||||||
| rs2288377 | 0.843 | 0.845 | |||||||||||||||||||||||||||||||||||||||||||||||||||||||||||||||||||||||||||||||||||||||||||||||||
| AA | 114(51.4%) | 46(48.4%) | 1 | 1 | |||||||||||||||||||||||||||||||||||||||||||||||||||||||||||||||||||||||||||||||||||||||||||||||
| AT | 88(39.6%) | 41(43.2%) | 1.15 (0.70 - 1.91) | 0.576 | 1.12 (0.64 - 1.98) | 0.689 | |||||||||||||||||||||||||||||||||||||||||||||||||||||||||||||||||||||||||||||||||||||||||||||
| TT | 20(9.0%) | 8(8.4%) | 0.99 (0.41 - 2.41) | 0.985 | 1.29 (0.48 - 3.48) | 0.613 | |||||||||||||||||||||||||||||||||||||||||||||||||||||||||||||||||||||||||||||||||||||||||||||
| Dominant | 0.633 | 0.610 | |||||||||||||||||||||||||||||||||||||||||||||||||||||||||||||||||||||||||||||||||||||||||||||||||
| AA | 114(51.4%) | 46(48.4%) | 1 | 1 | |||||||||||||||||||||||||||||||||||||||||||||||||||||||||||||||||||||||||||||||||||||||||||||||
| AT+TT | 108(48.6%) | 49(51.6%) | 1.16 (0.73−1.83) | 1.15 (0.67−1.97) | |||||||||||||||||||||||||||||||||||||||||||||||||||||||||||||||||||||||||||||||||||||||||||||||
| rs5742612 | 0.757 | 0.960 | |||||||||||||||||||||||||||||||||||||||||||||||||||||||||||||||||||||||||||||||||||||||||||||||||
| TT | 113(50.9%) | 47(49.5%) | 1 | 1 | |||||||||||||||||||||||||||||||||||||||||||||||||||||||||||||||||||||||||||||||||||||||||||||||
| TC | 88(39.6%) | 41(43.2%) | 1.12 (0.68 - 1.85) | 0.658 | 1.08 (0.62 - 1.91) | 0.780 | |||||||||||||||||||||||||||||||||||||||||||||||||||||||||||||||||||||||||||||||||||||||||||||
| CC | 21(9.5%) | 7(7.3%) | 0.80 (0.32 - 2.01) | 0.637 | 1.00 (0.36 - 2.77) | 0.996 | |||||||||||||||||||||||||||||||||||||||||||||||||||||||||||||||||||||||||||||||||||||||||||||
| Dominant | 0.783 | 0.806 | |||||||||||||||||||||||||||||||||||||||||||||||||||||||||||||||||||||||||||||||||||||||||||||||||
| TT | 113(50.9%) | 47(49.5%) | 1 | 1 | |||||||||||||||||||||||||||||||||||||||||||||||||||||||||||||||||||||||||||||||||||||||||||||||
| TC+CC | 109(49.1%) | 48(50.5%) | 1.08 (0.69−1.70) | 1.07 (0.62 - 1.83) | |||||||||||||||||||||||||||||||||||||||||||||||||||||||||||||||||||||||||||||||||||||||||||||||
| rs35767 Taiwan biobank MAF: 35%, 1000 Genomes MAF: 30%, HEW: 0.782. | |||||||||||||||||||||||||||||||||||||||||||||||||||||||||||||||||||||||||||||||||||||||||||||||||||
| rs2288377 Taiwan biobank MAF: 29%, 1000 Genomes MAF: 10%, HEW: 0.879. | |||||||||||||||||||||||||||||||||||||||||||||||||||||||||||||||||||||||||||||||||||||||||||||||||||
| rs5742612 Taiwan biobank MAF: 29%, 1000 Genomes MAF: 11%, HEW: 0.816. | |||||||||||||||||||||||||||||||||||||||||||||||||||||||||||||||||||||||||||||||||||||||||||||||||||
| Control: BMD T score>-1, Case: BMD T score<-2.5. | |||||||||||||||||||||||||||||||||||||||||||||||||||||||||||||||||||||||||||||||||||||||||||||||||||
| Adj-OR Age, BMI, Smoking, Drinking. | |||||||||||||||||||||||||||||||||||||||||||||||||||||||||||||||||||||||||||||||||||||||||||||||||||
Meta-analysis
Flowchart is shown in Figure 1. A total of 282 papers were in this meta-analysis, including 105 papers from PubMed, 58 papers from Embase, 9 papers from Cochrane, and 110 papers from Web of Science. Criteria of exclusion contained repetition, 87 papers; unrelated-genes or -OP topics, 74 papers; animal studies, 23 papers; posters, 2 papers; or non-postmenopausal women, 4 papers. Finally, there were 3 papers in this meta-analysis (Supplementary Table 3) [14–16]. Assessment of methodological quality was evaluated according to Newcastle–Ottawa Scale, and all criteria of scores were set as ≥7 points (Supplementary Table 4).
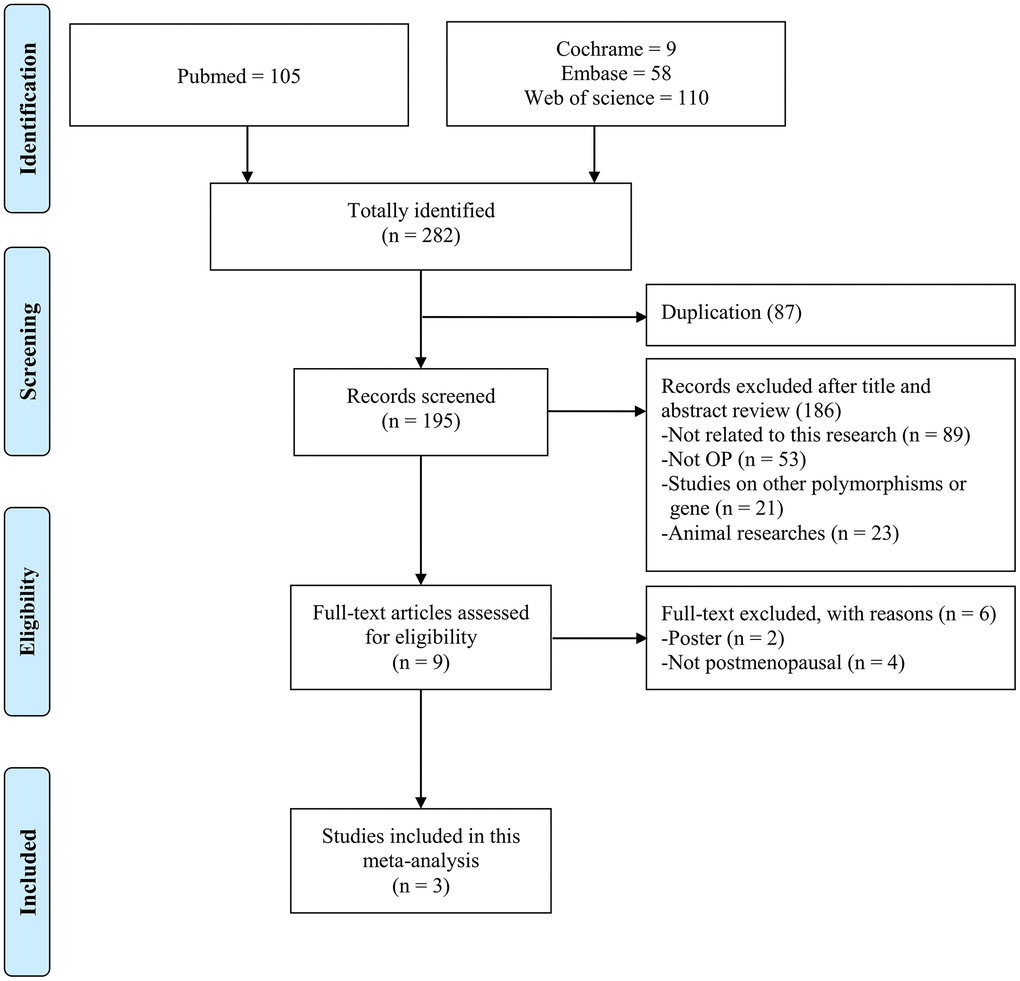
Figure 1. Flow diagram of the identification process for eligible studies.
Forest plot presents rs35767 in dominant model of meta-analysis and merged case-control study, showing [OR: 1.29 (95% CI: 1.08–1.54)] and [OR: 1.24 (95% CI: 1.05–1.47)], respectively. We adopted a funnel plot to examine the publication bias. None significant result of asymmetry was observed (p = 0.261) (Figure 2A). We also evaluated the meta-analysis results for rs2288377 and rs5742612, but there was no significant difference in the results (Figure 2B, 2C).
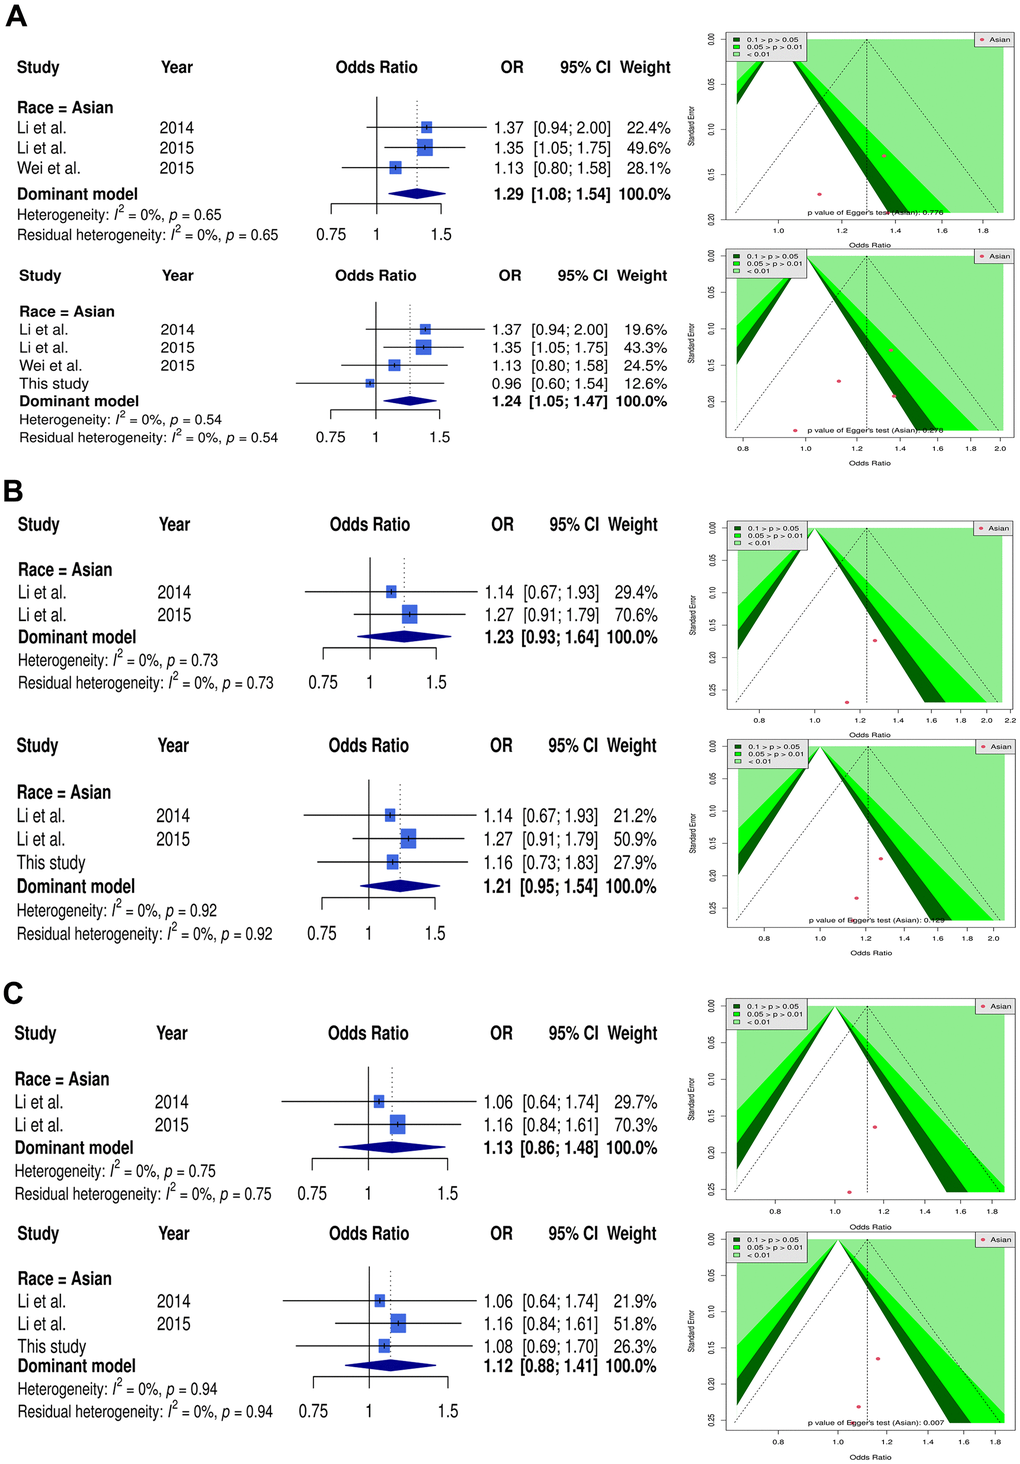
Figure 2. Forest plot and funnel plot of the association between IGF-1 and OP using dominant model. Selected results from the meta-analysis of IGF-1 and OP. (A) The left subplot is a forest plot based on rs35767 dominant model assumption (CT+TT vs. CC). The funnel plot obtained with the dominant models are presented at the right. (B) The left subplot is a forest plot based on rs2288377 dominant model assumption (AT+TT vs AA). The funnel plot obtained with the dominant models are presented at the right. (C) The left subplot is a forest plot based on rs5742612 dominant model assumption (TC+CC vs. TT). The funnel plot obtained with the dominant models are presented at the right.
TSA estimation
Figure 3 shows the TSA results to judge the association of IGF-1 with OP in postmenopausal women. In Asian postmenopausal females, the cumulative sample size, 1950, in rs35767 of meta-analysis was not adequate to achieve a conclusion. However, a joint of case-control research (317 samples) satisfied the minimum sample sizes (1977), criteria of effectiveness, to conclude the risky association between rs35767 and OP. This meta-analysis shows that this study is a crucial sample. The result of TSA in rs2288377 showed that the cumulative sample size was insufficient to reach a conclusion even merging case-control study. The TSA results of rs5742612 is similar to that of rs2288377.
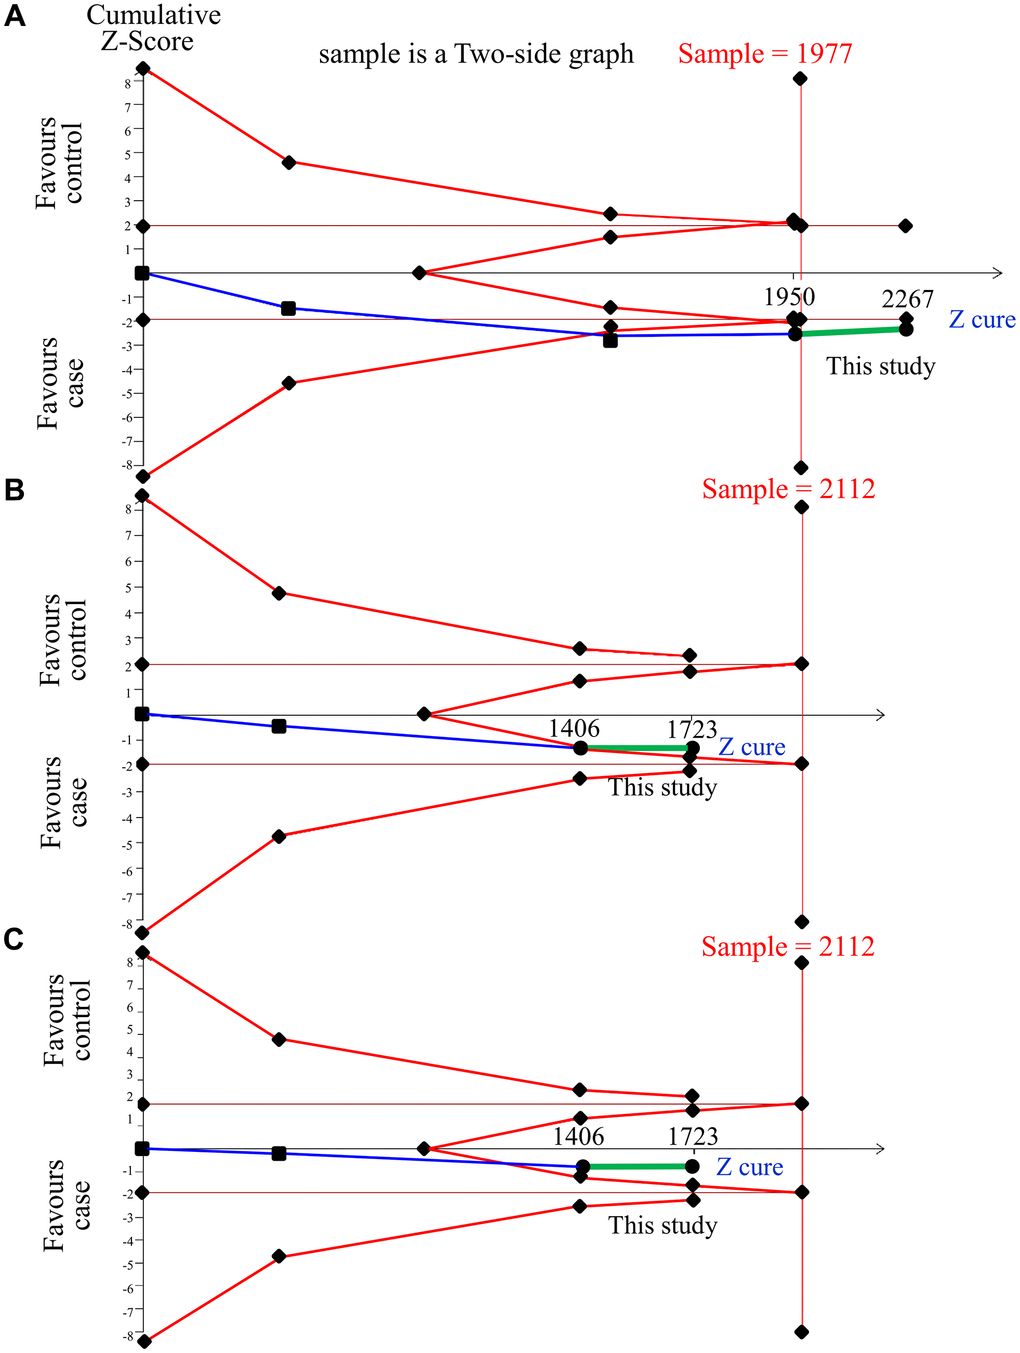
Figure 3. Trial sequential analysis of IGF-1 and OP in Asian samples. We performed a TSA using a dominant model assumption, but replaced the allele count with the sample size (divided by 2). (A) rs35767 detailed settings: Significance level = 0.05; Power = 0.8; least extreme OR to be detected = 1.3; MAF=0.35; I2 (heterogeneity) = 0%. (B) rs2288377 detailed settings: Significance level = 0.05; Power = 0.8; least extreme OR to be detected = 1.3; MAF=0.29; I2 (heterogeneity) = 0%. (C) rs5742612 detailed settings: Significance level = 0.05; Power = 0.8; least extreme OR to be detected = 1.3; MAF = 0.29; I2 (heterogeneity) = 0%.
Discussion
We reveal a conclusive risk association in rs35767 with OP in postmenopausal females judged by TSA with 2,267 Asians in a combination of 3 published studies and our case-control study. However, rs2288377 and rs5742612 show no association with OP but it needs more sample sizes to evaluate the relationship.
However, previous results reported rs2288377 gene polymorphism is significantly associated with OP, while rs35767 and rs5742612 are not significantly correlated with OP [18–20]. Previous meta-analysis studies ignored the estimation of sample size, a crucial key to association study [30], prone to lead to paradoxical conclusion [21, 22]. In this study, we use TSA model to evaluate effectiveness of the meta-analysis through the estimation of sample size. The relationship of the rs35767 to OP is confirmed by TSA with 2267 Asians in a combination of 3 published studies and our case-control study. Bereft of support of sufficient sample sizes in rs2288377 and rs5742612, it needs more research to evaluate the relationship.
The case-control study results found that IGF-1 polymorphism is somewhat divergent with previous studies [14, 15]. We speculate that the reason probably is much older in our case-control study. Our study population was aged more than 70 years old, while participants in 2 previous papers their age range was 50–68 years [14, 15]. Studies show that serum IGF-1 protein of elderly subjects aged 70 years and above decreases by nearly 60% [31, 32]. IGF-1 mediates bone remodeling and induces the differentiation, resorption, and bone formation of mesenchymal stem cells (MSCs) [33, 34]. The decrease of serum IGF-1 protein has a significant relationship with osteoporosis, and strongly affects the incidence of osteoporotic fractures in postmenopausal women [11, 35, 36]. In addition, IGF-1 has also been confirmed in rat experiments to increase bone formation by stimulating the activity of osteoblasts and reduce bone resorption by limiting osteoclast differentiation [37]. In cartilage, IGF-1 regulates chondrocyte differentiation and stimulates the synthesis of extracellular matrix components. In bone tissues, IGF-1 enhances the function of differentiated osteoblasts and mediates parathyroid hormone-specific metabolic effects [38]. IGF-1, PTH, and GH have synergistic effects on osteogenesis. In postmenopausal women with hyperthyroidism, GH level is reduced, which decreases IGF-1 protein and causes osteogenesis [39]. Therefore, the role of IGF-1 in relation to OP is diluted due to aging. Stratified by age at 70, we find that IGF-1 SNPs in those with less than 70 show risky inclination but neutralization in those with more than 70. This result is shown in Supplementary Figure 2.
In the era of precision medicine, disease-associated genomic factors can be considered as biomarkers for disease. Machine learning models facilitate the identification of disease using biomarkers [40, 41]. As a result, the future prospect is to develop machine learning methods to identify the incidence or progression of OP.
Multiple tests in meta-analyses will result in p-value inflation and cause the study results to be significantly more easily, thereby increasing the probability of type I error occurring. TSA compares the confidence intervals of past meta-analyses and can better control type I and II errors [42]. The TSA results of this study showed that this study is a crucial sample, and a decisive conclusion is obtained from sufficient accumulated samples in rs35767.
There are some limitations in this study: 1. We only included English papers. It may lead to bias in this study. 2. This study population consists of Asians and cannot be generalized to other races.
Conclusions
To conclude, our case-control study is a crucial sample in meta-analysis to reach conclusion of the association between IGF-1 rs35767 and OP in postmenopausal women.
Supplementary Materials
Author Contributions
Data curation, Sui-Lung Su, Yung-Hsun Huang, and Wen Su; Formal analysis, Yung-Hsun Huang, Yu-Hsuan Chen, and Pi-Shao Ko; Funding acquisition, Sui-Lung Su and Chih-Chien Wang; Validation, Meng-Chang Lee; Writing – original draft, Sui-Lung Su; Writing – review and editing, Sui-Lung Su and Meng-Chang Lee.
Conflicts of Interest
The authors have no conflicts of interest to declare.
Ethical Statement and Consent
This research was given approval by the institutional review board (TSGH-2-102-05-028) of Tri Service General Hospital (TSGH). Written informed consent was signed by participants after the oral explanation of this research.
Funding
This study was supported by the Ministry of Science and Technology (MOST107-2314-B016-052-MY3, MOST110-2314-B016-006), and National Defense Medical Center (MND-MAB-110-105, MND-MAB-C-11106-111021), Tri-Service General Hospital (TSGH-E110232, TSGH-D-111099).
References
- 1. Reginster JY, Burlet N. Osteoporosis: a still increasing prevalence. Bone. 2006; 38:S4–9. https://doi.org/10.1016/j.bone.2005.11.024 [PubMed]
- 2. Paschalis EP, Gamsjaeger S, Hassler N, Fahrleitner-Pammer A, Dobnig H, Stepan JJ, Pavo I, Eriksen EF, Klaushofer K. Vitamin D and calcium supplementation for three years in postmenopausal osteoporosis significantly alters bone mineral and organic matrix quality. Bone. 2017; 95:41–6. https://doi.org/10.1016/j.bone.2016.11.002 [PubMed]
- 3. Consensus development conference: diagnosis, prophylaxis, and treatment of osteoporosis. Am J Med. 1993; 94:646–50. https://doi.org/10.1016/0002-9343(93)90218-e [PubMed]
- 4. Boudin E, Fijalkowski I, Hendrickx G, Van Hul W. Genetic control of bone mass. Mol Cell Endocrinol. 2016; 432:3–13. https://doi.org/10.1016/j.mce.2015.12.021 [PubMed]
- 5. Eastell R, O’Neill TW, Hofbauer LC, Langdahl B, Reid IR, Gold DT, Cummings SR. Postmenopausal osteoporosis. Nat Rev Dis Primers. 2016; 2:16069. https://doi.org/10.1038/nrdp.2016.69 [PubMed]
- 6. Wang Q, Tang C, Jia J, Zhang G, Liu Z. Associations of IDUA and PTCH1 with Bone Mineral Density, Bone Turnover Markers, and Fractures in Chinese Elderly Patients with Osteoporosis. Dis Markers. 2019; 2019:9503762. https://doi.org/10.1155/2019/9503762 [PubMed]
- 7. Mafi Golchin M, Heidari L, Ghaderian SMH, Akhavan-Niaki H. Osteoporosis: A Silent Disease with Complex Genetic Contribution. J Genet Genomics. 2016; 43:49–61. https://doi.org/10.1016/j.jgg.2015.12.001 [PubMed]
- 8. Yakar S, Werner H, Rosen CJ. Insulin-like growth factors: actions on the skeleton. J Mol Endocrinol. 2018; 61:T115–37. https://doi.org/10.1530/JME-17-0298 [PubMed]
- 9. Li W, Yang SY, Hu ZF, Winslet MC, Wang W, Seifalian AM. Growth factors enhance endothelial progenitor cell proliferation under high-glucose conditions. Med Sci Monit. 2009; 15:BR357–63. [PubMed]
- 10. Pass C, MacRae VE, Ahmed SF, Farquharson C. Inflammatory cytokines and the GH/IGF-I axis: novel actions on bone growth. Cell Biochem Funct. 2009; 27:119–27. https://doi.org/10.1002/cbf.1551 [PubMed]
- 11. Garnero P, Sornay-Rendu E, Delmas PD. Low serum IGF-1 and occurrence of osteoporotic fractures in postmenopausal women. Lancet. 2000; 355:898–9. https://doi.org/10.1016/s0140-6736(99)05463-x [PubMed]
- 12. Kim JG, Roh KR, Lee JY. The relationship among serum insulin-like growth factor-I, insulin-like growth factor-I gene polymorphism, and bone mineral density in postmenopausal women in Korea. Am J Obstet Gynecol. 2002; 186:345–50. https://doi.org/10.1067/mob.2002.120483 [PubMed]
- 13. Rivadeneira F, Houwing-Duistermaat JJ, Vaessen N, Vergeer-Drop JM, Hofman A, Pols HA, Van Duijn CM, Uitterlinden AG. Association between an insulin-like growth factor I gene promoter polymorphism and bone mineral density in the elderly: the Rotterdam Study. J Clin Endocrinol Metab. 2003; 88:3878–84. https://doi.org/10.1210/jc.2002-021813 [PubMed]
- 14. Yun-Kai L, Hui W, Xin-Wei Z, Liang G, Jin-Liang Z. The polymorphism of Insulin-like growth factor-I (IGF-I) is related to osteoporosis and bone mineral density in postmenopausal population. Pak J Med Sci. 2014; 30:131–5. https://doi.org/10.12669/pjms.301.4264 [PubMed]
- 15. Li F, Xing WH, Yang XJ, Jiang HY, Xia H. Influence of polymorphisms in insulin-like growth factor-1 on the risk of osteoporosis in a Chinese postmenopausal female population. Int J Clin Exp Pathol. 2015; 8:5727–32. [PubMed]
- 16. Wei YK, Ma HL, Guo YZ, Yang BH, Pang WX. Association of the IGF-1 rs35767 and rs972936 polymorphisms with the risk of osteoporosis in a Chinese postmenopausal female population. Genet Mol Res. 2015; 14:14325–30. https://doi.org/10.4238/2015.November.13.17 [PubMed]
- 17. Zhang W, Zhang LC, Chen H, Tang PF, Zhang LH. Association between polymorphisms in insulin-like growth factor-1 and risk of osteoporosis. Genet Mol Res. 2015; 14:7655–60. https://doi.org/10.4238/2015.July.13.10 [PubMed]
- 18. Fan Y, Zhang S, Liang F, Zhou Y. Association of insulin-like growth factor I gene polymorphisms with the risk of osteoporosis in a Chinese population. Int J Clin Exp Pathol. 2017; 10:8443–51. [PubMed]
- 19. Liu X, Ma F, Zhong Y. Association of insulin-like growth factor I gene and vitamin D receptor gene polymorphisms with the risk of osteoporosis in a Chinese population. Biomedical Research. 2017; 28.
- 20. Zhou G, Yu J, Zhang J. Association between single-nucleotide polymorphisms and haplotype of insulin-like growth factor I and risk of osteoporosis. Int J Clin Exp Med. 2018; 11:4762–70.
- 21. Chen YC, Zhang L, Li EN, Ding LX, Zhang GA, Hou Y, Yuan W. Association of the insulin-like growth factor-1 single nucleotide polymorphisms rs35767, rs2288377, and rs5742612 with osteoporosis risk: A meta-analysis. Medicine (Baltimore). 2017; 96:e9231. https://doi.org/10.1097/MD.0000000000009231 [PubMed]
- 22. Gao ST, Lv ZT, Zhou CK, Mao C, Sheng WB. Association between IGF-1 polymorphisms and risk of osteoporosis in Chinese population: a meta-analysis. BMC Musculoskelet Disord. 2018; 19:141. https://doi.org/10.1186/s12891-018-2066-y [PubMed]
- 23. Chen HY, Huang W, Leung VH, Fung SL, Ma SL, Jiang H, Tang NL. Functional interaction between SNPs and microsatellite in the transcriptional regulation of insulin-like growth factor 1. Hum Mutat. 2013; 34:1289–97. https://doi.org/10.1002/humu.22363 [PubMed]
- 24. Brok J, Thorlund K, Gluud C, Wetterslev J. Trial sequential analysis reveals insufficient information size and potentially false positive results in many meta-analyses. J Clin Epidemiol. 2008; 61:763–9. https://doi.org/10.1016/j.jclinepi.2007.10.007 [PubMed]
- 25. Assessment of fracture risk and its application to screening for postmenopausal osteoporosis. Report of a WHO Study Group. World Health Organ Tech Rep Ser. 1994; 843:1–129. [PubMed]
- 26. Chen YY, Fang WH, Wang CC, Kao TW, Chang YW, Yang HF, Wu CJ, Sun YS, Chen WL. Crosssectional Assessment of Bone Mass Density in Adults with Hepatitis B Virus and Hepatitis C Virus Infection. Sci Rep. 2019; 9:5069. https://doi.org/10.1038/s41598-019-41674-4 [PubMed]
- 27. Page MJ, McKenzie JE, Bossuyt PM, Boutron I, Hoffmann TC, Mulrow CD, Shamseer L, Tetzlaff JM, Akl EA, Brennan SE, Chou R, Glanville J, Grimshaw JM, et al. The PRISMA 2020 statement: an updated guideline for reporting systematic reviews. BMJ. 2021; 372:n71. https://doi.org/10.1136/bmj.n71 [PubMed]
- 28. Higgins JP, Thompson SG, Deeks JJ, Altman DG. Measuring inconsistency in meta-analyses. BMJ. 2003; 327:557–60. https://doi.org/10.1136/bmj.327.7414.557 [PubMed]
- 29. Egger M, Davey Smith G, Schneider M, Minder C. Bias in meta-analysis detected by a simple, graphical test. BMJ. 1997; 315:629–34. https://doi.org/10.1136/bmj.315.7109.629 [PubMed]
- 30. Kao CC, Hsu HE, Lai JC, Chen HC, Chuang SW, Lee MC. Strategy to Estimate Sample Sizes to Justify the Association between MMP1 SNP and Osteoarthritis. Genes (Basel). 2022; 13:1084. https://doi.org/10.3390/genes13061084 [PubMed]
- 31. Nicolas V, Prewett A, Bettica P, Mohan S, Finkelman RD, Baylink DJ, Farley JR. Age-related decreases in insulin-like growth factor-I and transforming growth factor-beta in femoral cortical bone from both men and women: implications for bone loss with aging. J Clin Endocrinol Metab. 1994; 78:1011–6. https://doi.org/10.1210/jcem.78.5.8175953 [PubMed]
- 32. Moriwaki K, Matsumoto H, Tanishima S, Tanimura C, Osaki M, Nagashima H, Hagino H. Association of serum bone- and muscle-derived factors with age, sex, body composition, and physical function in community-dwelling middle-aged and elderly adults: a cross-sectional study. BMC Musculoskelet Disord. 2019; 20:276. https://doi.org/10.1186/s12891-019-2650-9 [PubMed]
- 33. Mohan S, Jennings JC, Linkhart TA, Baylink DJ. Primary structure of human skeletal growth factor: homology with human insulin-like growth factor-II. Biochim Biophys Acta. 1988; 966:44–55. https://doi.org/10.1016/0304-4165(88)90127-4 [PubMed]
- 34. Xian L, Wu X, Pang L, Lou M, Rosen CJ, Qiu T, Crane J, Frassica F, Zhang L, Rodriguez JP, Xiaofeng J, Shoshana Y, Shouhong X, et al. Matrix IGF-1 maintains bone mass by activation of mTOR in mesenchymal stem cells. Nat Med. 2012; 18:1095–101. https://doi.org/10.1038/nm.2793 [PubMed]
- 35. Mezquita-Raya P, Muñoz-Torres M, Alonso G, de Luna JD, Quesada JM, Dorado G, Luque-Recio F, Ruiz-Requena ME, Lopez-Rodriguez F, Escobar-Jiménez F. Susceptibility for postmenopausal osteoporosis: interaction between genetic, hormonal and lifestyle factors. Calcif Tissue Int. 2004; 75:373–9. https://doi.org/10.1007/s00223-004-0187-9 [PubMed]
- 36. Liang X, Du Y, Wen Y, Liu L, Li P, Zhao Y, Ding M, Cheng B, Cheng S, Ma M, Zhang L, Shen H, Tian Q, et al. Assessing the Genetic Correlations Between Blood Plasma Proteins and Osteoporosis: A Polygenic Risk Score Analysis. Calcif Tissue Int. 2019; 104:171–81. https://doi.org/10.1007/s00223-018-0483-4 [PubMed]
- 37. Sun HB, Chen JC. Prevention of bone loss by injection of insulin-like growth factor-1 after sciatic neurectomy in rats. Chin J Traumatol. 2013; 16:158–62. [PubMed]
- 38. Gazzerro E, Canalis E. Skeletal actions of insulin-like growth factors. Expert Rev Endocrinol Metab. 2006; 1:47–56. https://doi.org/10.1586/17446651.1.1.47 [PubMed]
- 39. Lombardi G, Di Somma C, Grasso LF, Savanelli MC, Colao A, Pivonello R. The cardiovascular system in growth hormone excess and growth hormone deficiency. J Endocrinol Invest. 2012; 35:1021–9. https://doi.org/10.3275/8717 [PubMed]
- 40. Silva PP, Gaudillo JD, Vilela JA, Roxas-Villanueva RML, Tiangco BJ, Domingo MR, Albia JR. A machine learning-based SNP-set analysis approach for identifying disease-associated susceptibility loci. Sci Rep. 2022; 12:15817. https://doi.org/10.1038/s41598-022-19708-1 [PubMed]
- 41. Zheng Z, Zhang X, Oh BK, Kim KY. Identification of combined biomarkers for predicting the risk of osteoporosis using machine learning. Aging (Albany NY). 2022; 14:4270–80. https://doi.org/10.18632/aging.204084 [PubMed]
- 42. Wetterslev J, Jakobsen JC, Gluud C. Trial Sequential Analysis in systematic reviews with meta-analysis. BMC Med Res Methodol. 2017; 17:39. https://doi.org/10.1186/s12874-017-0315-7 [PubMed]