


Introduction
We live in an aging society. According to the U.S. Census Bureau’s 2017 National Population Projections, 1 in every 5 residents will be in retirement age by 2030 [1]. Subsequently, a more significant percentage of the population will endure the challenges of age-related diseases than ever before. Treatments targeting these diseases, such as dementia or cancer, at most “delay” the disease process but have a limited ability to “cure.” Therefore, there are growing interests in treating aging itself as a disease [2].
Considerable evidence from basic and pre-clinical models shows that several interventions, such as exercise, intermittent fasting, and even ingestion of certain compounds can prolong lifespan. These promising compounds include rapamycin [3, 4], resveratrol [5–7], NAD [8], and metformin [9–11]. Our group also confirmed that inpatients using metformin had improved three-year survival rates compared to non-metformin users [12]. In addition, our data also showed that prevalence of delirium was lower among those who were on metformin compared to those without [12].
The mechanism (or mechanisms) of action that rationalizes how these interventions prolong lifespan, or potentially delay aging, has been investigated heavily. Nevertheless, no exact process is well understood, especially for metformin. It is believed that epigenetics is one of the most important molecular mechanisms of aging in animals and plants; thus, it is plausible that the “life-prolonging” effects of many interventions are through modification of epigenetic processes. For example, several reports show epigenetic changes from exercise [13], fasting [14], rapamycin [3], resveratrol [5], and NAD [8]. However, there are only a few studies investigating the direct influence of metformin on epigenetic changes [15–17], suggesting that information about the influence of metformin on the epigenetic profile in humans is currently limited.
To fill such gap of knowledge, we investigated the potential influence of metformin on the epigenetic profile by testing genome-wide DNA methylation (DNAm) in whole blood samples obtained from inpatients with and without a history of metformin use.
Results
Demographics
173 subjects were enrolled in this study, but only 171 were included in downstream data analysis. The average patient age was 74.4 (SD = 9.8). 58 (33.9%) subjects were females while almost all the subjects were white per self-report (n = 167; 97.7%). 108 patients were non-diabetic (non-DM) while 63 were diabetic (DM). Among the DM group, 37 had diabetes with a history of metformin prescription DM(+)Met and 26 had diabetes without a history of metformin prescription DM(−)Met. Additionally, 43 (68.3%) diabetic subjects had a history of insulin use. Charlson Comorbidity Index (CCI) and body mass index (BMI) information are also included in Table 1. No variable revealed statistically significant differences between the DM(−)Met and DM(+)Met. However CCI, BMI, and insulin use were significantly higher among the DM group compared to the non-DM group, as expected.
Table 1. Patient characteristics.
| Classification | All Subjects | Diabetes | p | Statistical test | DM subjects | p | Statistical test | ||||||||||||||||||||||||||||||||||||||||||||||||||||||||||||||||||||||||||||||||||||||||||||
| non-DM | DM | DM(−)Met | DM(+)Met | ||||||||||||||||||||||||||||||||||||||||||||||||||||||||||||||||||||||||||||||||||||||||||||||||
| N | 171 | 108 | 63 | 26 | 37 | ||||||||||||||||||||||||||||||||||||||||||||||||||||||||||||||||||||||||||||||||||||||||||||||
| Age - yr | 74.4 | 74.6 | 74.1 | 0.77 | t = 1.98 | 73.8 | 74.3 | 0.833 | t = 2.01 | ||||||||||||||||||||||||||||||||||||||||||||||||||||||||||||||||||||||||||||||||||||||||||
| SD | 9.8 | 9.7 | 10.0 | 10.6 | 9.7 | ||||||||||||||||||||||||||||||||||||||||||||||||||||||||||||||||||||||||||||||||||||||||||||||
| Female sex (n) | 58 | 36 | 22 | 0.81 | χ2 = 0.10 | 11 | 11 | 0.303 | χ2 = 1.06 | ||||||||||||||||||||||||||||||||||||||||||||||||||||||||||||||||||||||||||||||||||||||||||
| % | 33.9 | 33.6 | 34.9 | 42.3 | 29.7 | ||||||||||||||||||||||||||||||||||||||||||||||||||||||||||||||||||||||||||||||||||||||||||||||
| Race, White (n) | 167 | 105 | 62 | 0.63 | χ2 = 0.23 | 25 | 37 | 0.229 | χ2 = 1.45 | ||||||||||||||||||||||||||||||||||||||||||||||||||||||||||||||||||||||||||||||||||||||||||
| % | 97.7 | 97.2 | 98.4 | 96.2 | 100 | ||||||||||||||||||||||||||||||||||||||||||||||||||||||||||||||||||||||||||||||||||||||||||||||
| CCI | 3.8 | 3.1 | 4.9 | 7.5E-06* | t = 1.98 | 4.8 | 5.0 | 0.756 | t = 2.00 | ||||||||||||||||||||||||||||||||||||||||||||||||||||||||||||||||||||||||||||||||||||||||||
| SD | 2.7 | 2.7 | 2.4 | 2.4 | 2.5 | ||||||||||||||||||||||||||||||||||||||||||||||||||||||||||||||||||||||||||||||||||||||||||||||
| BMI | 29.7 | 28.3 | 32.2 | 0.002* | t = 1.98 | 30.0 | 33.8 | 0.64 | t = 2.00 | ||||||||||||||||||||||||||||||||||||||||||||||||||||||||||||||||||||||||||||||||||||||||||
| SD | 7.6 | 6.3 | 8.8 | 5.0 | 10.5 | ||||||||||||||||||||||||||||||||||||||||||||||||||||||||||||||||||||||||||||||||||||||||||||||
| Insulin use history | 43 | 0 | 43 | 3.3E-23* | χ2 = 98.48 | 15 | 28 | 0.131 | χ2 = 2.28 | ||||||||||||||||||||||||||||||||||||||||||||||||||||||||||||||||||||||||||||||||||||||||||
| % | 25.1 | 0 | 68.3 | 57.7 | 75.7 | ||||||||||||||||||||||||||||||||||||||||||||||||||||||||||||||||||||||||||||||||||||||||||||||
| Age, sex, and race were not significantly different between the non-diabetes (non-DM) and the diabetes (DM) groups, while CCI, BMI, and insulin use were. None of the patient characteristics between metformin nonusers DM(−)Met and metformin users DM(+)Met among the diabetic group were statistically significant. Abbreviations: SD: Standard deviation; CCI: Charlson comorbidity index; BMI: Body mass index. *p < 0.05. | |||||||||||||||||||||||||||||||||||||||||||||||||||||||||||||||||||||||||||||||||||||||||||||||||||
Met vs. non-Met (including all patients regardless of diabetes status): top hits, KEGG, GO
Table 2 shows the most significant genes that differed in methylation rates between patients with and without metformin use history regardless of diabetes status (171 subjects). None of the sites met the criteria for genome-wide statistical significance (p < 5E-8).
Table 2. Top 20 CpG sites that differed between metformin users and nonusers among all patients.
| Gene name | CpG site | Chromosome | non-Met (%) | Met (%) | % mean difference (Δβ) | p-value |
| PSME3 | cg22769787 | chr17 | 15.6% | 14.3% | 1.3% | 3.37E-07 |
| EPHA8 | cg27136384 | chr1 | 83.2% | −2.7% | −2.7% | 4.84E-07 |
| cg22163972 | chr17 | 92.1% | 4.2% | 4.2% | 4.89E-07 | |
| cg23047680 | chr3 | 0.8% | −0.2% | −0.2% | 9.08E-07 | |
| NEDD4 | cg11341892 | chr15 | 4.7% | 0.6% | 0.6% | 2.82E-06 |
| PRKCG | cg11293016 | chr19 | 52.9% | 4.0% | 4.0% | 4.68E-06 |
| SRSF11 | cg12923877 | chr1 | 97.5% | −0.3% | −0.3% | 4.94E-06 |
| RRP15 | cg24353272 | chr1 | 95.3% | −0.8% | −0.8% | 5.16E-06 |
| KIAA1688 | cg07969649 | chr8 | 91.1% | −1.6% | −1.6% | 5.22E-06 |
| TRIM27 | cg02525926 | chr6 | 97.4% | 0.8% | 0.8% | 6.98E-06 |
| cg23067796 | chr12 | 93.7% | 1.7% | 1.7% | 7.29E-06 | |
| RYR2 | cg04573831 | chr1 | 96.6% | −0.6% | −0.6% | 8.11E-06 |
| cg15180899 | chr18 | 93.9% | 1.7% | 1.7% | 8.67E-06 | |
| cg12222244 | chr3 | 94.1% | 2.1% | 2.1% | 1.27E-05 | |
| C1orf125 | cg20746459 | chr1 | 90.6% | 3.5% | 3.5% | 1.52E-05 |
| SERPINH1 | cg19586851 | chr11 | 97.2% | −0.5% | −0.5% | 1.55E-05 |
| PPL | cg12991522 | chr16 | 1.8% | −0.5% | −0.5% | 1.55E-05 |
| ACO1 | cg13567378 | chr9 | 89.0% | −1.3% | −1.3% | 1.71E-05 |
| cg24525630 | chr17 | 1.6% | −0.3% | −0.3% | 1.72E-05 | |
| TCF7L1 | cg20116596 | chr2 | 95.7% | −0.5% | −0.5% | 1.76E-05 |
Next, we conducted enrichment analysis using the top 330 CpG sites based on the absolute difference in methylation level (beta value) between metformin users (Met) and nonusers (non-Met) greater than 4% and the p-value less than 0.01. Enrichment analysis from the KEGG top signals showed relevant pathways to metformin’s possible roles, such as “longevity regulating pathway”, “longevity regulating pathway – multiple species”, and “AMPK signaling pathway” (Table 3). In addition, other pathways, such as “mTOR signaling pathway”, “insulin secretion”, “glutamatergic synapse”, and “circadian entrainment” were discovered (Table 3). There were also relevant pathways revealed in the GO analysis, such as “regulation of hypoxia-inducible factor-1alpha signaling pathway”, “positive regulation of hypoxia-inducible factor-1alpha signaling pathway”, and “canonical Wnt signal pathway” (Table 4), although none of the pathways in either KEGG or GO reached the False Discovery Rate (FDR) significance level (FDR <0.05) (Tables 3 and 4).
Table 3. Top 30 KEGG pathways based on different methylation rates between metformin users and nonusers.
| Pathway | N | DE | p-value | FDR | |||||||||||||||||||||||||||||||||||||||||||||||||||||||||||||||||||||||||||||||||||||||||||||||
| Relaxin signaling pathway | 129 | 6 | 0.007 | 1 | |||||||||||||||||||||||||||||||||||||||||||||||||||||||||||||||||||||||||||||||||||||||||||||||
| Longevity regulating pathway | 89 | 5 | 0.008 | 1 | |||||||||||||||||||||||||||||||||||||||||||||||||||||||||||||||||||||||||||||||||||||||||||||||
| Glutamatergic synapse | 114 | 6 | 0.008 | 1 | |||||||||||||||||||||||||||||||||||||||||||||||||||||||||||||||||||||||||||||||||||||||||||||||
| Cushing syndrome | 155 | 6 | 0.018 | 1 | |||||||||||||||||||||||||||||||||||||||||||||||||||||||||||||||||||||||||||||||||||||||||||||||
| Parathyroid hormone synthesis, secretion and action | 106 | 5 | 0.019 | 1 | |||||||||||||||||||||||||||||||||||||||||||||||||||||||||||||||||||||||||||||||||||||||||||||||
| AMPK signaling pathway | 119 | 5 | 0.021 | 1 | |||||||||||||||||||||||||||||||||||||||||||||||||||||||||||||||||||||||||||||||||||||||||||||||
| Signaling pathways regulating pluripotency of stem cells | 142 | 5 | 0.028 | 1 | |||||||||||||||||||||||||||||||||||||||||||||||||||||||||||||||||||||||||||||||||||||||||||||||
| Gap junction | 88 | 4 | 0.033 | 1 | |||||||||||||||||||||||||||||||||||||||||||||||||||||||||||||||||||||||||||||||||||||||||||||||
| Insulin secretion | 86 | 4 | 0.034 | 1 | |||||||||||||||||||||||||||||||||||||||||||||||||||||||||||||||||||||||||||||||||||||||||||||||
| Melanogenesis | 101 | 4 | 0.043 | 1 | |||||||||||||||||||||||||||||||||||||||||||||||||||||||||||||||||||||||||||||||||||||||||||||||
| Longevity regulating pathway - multiple species | 62 | 3 | 0.051 | 1 | |||||||||||||||||||||||||||||||||||||||||||||||||||||||||||||||||||||||||||||||||||||||||||||||
| Aldosterone synthesis and secretion | 98 | 4 | 0.055 | 1 | |||||||||||||||||||||||||||||||||||||||||||||||||||||||||||||||||||||||||||||||||||||||||||||||
| Chemical carcinogenesis - DNA adducts | 69 | 2 | 0.056 | 1 | |||||||||||||||||||||||||||||||||||||||||||||||||||||||||||||||||||||||||||||||||||||||||||||||
| Circadian entrainment | 97 | 4 | 0.058 | 1 | |||||||||||||||||||||||||||||||||||||||||||||||||||||||||||||||||||||||||||||||||||||||||||||||
| Steroid hormone biosynthesis | 61 | 2 | 0.062 | 1 | |||||||||||||||||||||||||||||||||||||||||||||||||||||||||||||||||||||||||||||||||||||||||||||||
| Thermogenesis | 219 | 5 | 0.063 | 1 | |||||||||||||||||||||||||||||||||||||||||||||||||||||||||||||||||||||||||||||||||||||||||||||||
| Bile secretion | 89 | 3 | 0.063 | 1 | |||||||||||||||||||||||||||||||||||||||||||||||||||||||||||||||||||||||||||||||||||||||||||||||
| Metabolism of xenobiotics by cytochrome P450 | 76 | 2 | 0.068 | 1 | |||||||||||||||||||||||||||||||||||||||||||||||||||||||||||||||||||||||||||||||||||||||||||||||
| Cortisol synthesis and secretion | 65 | 3 | 0.069 | 1 | |||||||||||||||||||||||||||||||||||||||||||||||||||||||||||||||||||||||||||||||||||||||||||||||
| Thyroid hormone synthesis | 75 | 3 | 0.071 | 1 | |||||||||||||||||||||||||||||||||||||||||||||||||||||||||||||||||||||||||||||||||||||||||||||||
| Wnt signaling pathway | 166 | 5 | 0.071 | 1 | |||||||||||||||||||||||||||||||||||||||||||||||||||||||||||||||||||||||||||||||||||||||||||||||
| Vasopressin-regulated water reabsorption | 44 | 2 | 0.081 | 1 | |||||||||||||||||||||||||||||||||||||||||||||||||||||||||||||||||||||||||||||||||||||||||||||||
| Cholinergic synapse | 113 | 4 | 0.090 | 1 | |||||||||||||||||||||||||||||||||||||||||||||||||||||||||||||||||||||||||||||||||||||||||||||||
| Retrograde endocannabinoid signaling | 141 | 4 | 0.089 | 1 | |||||||||||||||||||||||||||||||||||||||||||||||||||||||||||||||||||||||||||||||||||||||||||||||
| Estrogen signaling pathway | 137 | 4 | 0.091 | 1 | |||||||||||||||||||||||||||||||||||||||||||||||||||||||||||||||||||||||||||||||||||||||||||||||
| Mineral absorption | 60 | 2 | 0.111 | 1 | |||||||||||||||||||||||||||||||||||||||||||||||||||||||||||||||||||||||||||||||||||||||||||||||
| Gastric cancer | 149 | 4 | 0.121 | 1 | |||||||||||||||||||||||||||||||||||||||||||||||||||||||||||||||||||||||||||||||||||||||||||||||
| mTOR signaling pathway | 155 | 4 | 0.123 | 1 | |||||||||||||||||||||||||||||||||||||||||||||||||||||||||||||||||||||||||||||||||||||||||||||||
| Protein digestion and absorption | 102 | 3 | 0.123 | 1 | |||||||||||||||||||||||||||||||||||||||||||||||||||||||||||||||||||||||||||||||||||||||||||||||
| Ovarian steroidogenesis | 51 | 2 | 0.123 | 1 | |||||||||||||||||||||||||||||||||||||||||||||||||||||||||||||||||||||||||||||||||||||||||||||||
| Thyroid hormone synthesis | 75 | 3 | 0.071 | 1 | |||||||||||||||||||||||||||||||||||||||||||||||||||||||||||||||||||||||||||||||||||||||||||||||
| Relevant pathways from KEGG [58] are highlighted. Abbreviations: N: number of genes included in each pathway; DE: number of Differentially Expressed genes, which are the number of genes from the top CpG sites; FDR: False Discovery Rate. | |||||||||||||||||||||||||||||||||||||||||||||||||||||||||||||||||||||||||||||||||||||||||||||||||||
Table 4. Top 30 GO pathways based on different methylation rates between metformin users and nonusers.
| Pathway | Ont | N | DE | p-value | FDR | ||||||||||||||||||||||||||||||||||||||||||||||||||||||||||||||||||||||||||||||||||||||||||||||
| Homophilic cell adhesion via plasma membrane adhesion molecules | BP | 168 | 8 | 7.20E-04 | 1 | ||||||||||||||||||||||||||||||||||||||||||||||||||||||||||||||||||||||||||||||||||||||||||||||
| Long-term synaptic depression | BP | 31 | 4 | 9.77E-04 | 1 | ||||||||||||||||||||||||||||||||||||||||||||||||||||||||||||||||||||||||||||||||||||||||||||||
| Locomotory behavior | BP | 198 | 9 | 0.001 | 1 | ||||||||||||||||||||||||||||||||||||||||||||||||||||||||||||||||||||||||||||||||||||||||||||||
| Midbrain dopaminergic neuron differentiation | BP | 17 | 3 | 0.002 | 1 | ||||||||||||||||||||||||||||||||||||||||||||||||||||||||||||||||||||||||||||||||||||||||||||||
| Cell surface receptor signaling pathway involved in cell-cell signaling | BP | 622 | 17 | 0.002 | 1 | ||||||||||||||||||||||||||||||||||||||||||||||||||||||||||||||||||||||||||||||||||||||||||||||
| Negative regulation of synaptic transmission | BP | 71 | 5 | 0.002 | 1 | ||||||||||||||||||||||||||||||||||||||||||||||||||||||||||||||||||||||||||||||||||||||||||||||
| Canonical Wnt signaling pathway | BP | 335 | 11 | 0.002 | 1 | ||||||||||||||||||||||||||||||||||||||||||||||||||||||||||||||||||||||||||||||||||||||||||||||
| Calcium ion binding | MF | 698 | 17 | 0.003 | 1 | ||||||||||||||||||||||||||||||||||||||||||||||||||||||||||||||||||||||||||||||||||||||||||||||
| Hexose mediated signaling | BP | 6 | 2 | 0.003 | 1 | ||||||||||||||||||||||||||||||||||||||||||||||||||||||||||||||||||||||||||||||||||||||||||||||
| Sugar mediated signaling pathway | BP | 6 | 2 | 0.003 | 1 | ||||||||||||||||||||||||||||||||||||||||||||||||||||||||||||||||||||||||||||||||||||||||||||||
| Glucose mediated signaling pathway | BP | 6 | 2 | 0.003 | 1 | ||||||||||||||||||||||||||||||||||||||||||||||||||||||||||||||||||||||||||||||||||||||||||||||
| Cellular response to acid chemical | BP | 209 | 8 | 0.003 | 1 | ||||||||||||||||||||||||||||||||||||||||||||||||||||||||||||||||||||||||||||||||||||||||||||||
| Cell-cell signaling | BP | 1847 | 345 | 0.003 | 1 | ||||||||||||||||||||||||||||||||||||||||||||||||||||||||||||||||||||||||||||||||||||||||||||||
| Regulation of ion transmembrane transporter activity | BP | 256 | 9 | 0.004 | 1 | ||||||||||||||||||||||||||||||||||||||||||||||||||||||||||||||||||||||||||||||||||||||||||||||
| Mesoderm development | BP | 133 | 6 | 0.004 | 1 | ||||||||||||||||||||||||||||||||||||||||||||||||||||||||||||||||||||||||||||||||||||||||||||||
| Neuronal cell body membrane | CC | 27 | 3 | 0.004 | 1 | ||||||||||||||||||||||||||||||||||||||||||||||||||||||||||||||||||||||||||||||||||||||||||||||
| Cell body membrane | CC | 28 | 3 | 0.004 | 1 | ||||||||||||||||||||||||||||||||||||||||||||||||||||||||||||||||||||||||||||||||||||||||||||||
| Regulation of transmembrane transporter activity | BP | 264 | 9 | 0.005 | 1 | ||||||||||||||||||||||||||||||||||||||||||||||||||||||||||||||||||||||||||||||||||||||||||||||
| Regulation of hypoxia-inducible factor-1alpha signaling pathway | BP | 1 | 1 | 0.005 | 1 | ||||||||||||||||||||||||||||||||||||||||||||||||||||||||||||||||||||||||||||||||||||||||||||||
| Positive regulation of hypoxia-inducible factor-1alpha signaling pathway | BP | 1 | 1 | 0.005 | 1 | ||||||||||||||||||||||||||||||||||||||||||||||||||||||||||||||||||||||||||||||||||||||||||||||
| Cellular response to vitamin K | BP | 1 | 1 | 0.005 | 1 | ||||||||||||||||||||||||||||||||||||||||||||||||||||||||||||||||||||||||||||||||||||||||||||||
| Cellular response to glucagon stimulus | BP | 25 | 3 | 0.005 | 1 | ||||||||||||||||||||||||||||||||||||||||||||||||||||||||||||||||||||||||||||||||||||||||||||||
| Carbohydrate mediated signaling | BP | 8 | 2 | 0.005 | 1 | ||||||||||||||||||||||||||||||||||||||||||||||||||||||||||||||||||||||||||||||||||||||||||||||
| Seminal vesicle morphogenesis | BP | 1 | 1 | 0.005 | 1 | ||||||||||||||||||||||||||||||||||||||||||||||||||||||||||||||||||||||||||||||||||||||||||||||
| Glucagon-like peptide 1 receptor activity | MF | 1 | 1 | 0.005 | 1 | ||||||||||||||||||||||||||||||||||||||||||||||||||||||||||||||||||||||||||||||||||||||||||||||
| Behavior | BP | 593 | 15 | 0.005 | 1 | ||||||||||||||||||||||||||||||||||||||||||||||||||||||||||||||||||||||||||||||||||||||||||||||
| Nicotinamide phosphoribosyltransferase activity | MF | 1 | 1 | 0.006 | 1 | ||||||||||||||||||||||||||||||||||||||||||||||||||||||||||||||||||||||||||||||||||||||||||||||
| Response to D-galactose | BP | 1 | 1 | 0.006 | 1 | ||||||||||||||||||||||||||||||||||||||||||||||||||||||||||||||||||||||||||||||||||||||||||||||
| Embryonic skeletal system development | BP | 125 | 6 | 0.006 | 1 | ||||||||||||||||||||||||||||||||||||||||||||||||||||||||||||||||||||||||||||||||||||||||||||||
| Regulation of transporter activity | BP | 279 | 9 | 0.006 | 1 | ||||||||||||||||||||||||||||||||||||||||||||||||||||||||||||||||||||||||||||||||||||||||||||||
| Relevant pathways are highlighted. Abbreviations: Ont: Ontology; BP: biological process; CC: cellular component; MF: molecular function; N: number of genes included in each pathway; DE: number of Differentially Expressed genes, which are the number of genes from the top CpG sites; FDR: False Discovery Rate. | |||||||||||||||||||||||||||||||||||||||||||||||||||||||||||||||||||||||||||||||||||||||||||||||||||
Met vs. non-Met (including only patients with type 2 diabetes mellitus): top hits, KEGG, GO
Table 5 shows the most significant genes that differed in methylation rate between metformin users and nonusers among the diabetes group (63 subjects). Similar to the previous analysis, no gene reached genome-wide statistical significance (p < 5E-8).
Table 5. Top 20 CpG sites that differed between metformin users and nonusers among the diabetes group.
| Gene name | CpG site | Chromosome | non-Met (%) | Met (%) | Mean difference (Δβ) | p-value |
| cg19873536 | chr10 | 78.3% | 67.9% | 10.4% | 1.28E-06 | |
| cg13596208 | chr9 | 1.9% | 2.7% | −0.9% | 2.29E-06 | |
| HBA1 | cg01704105 | chr16 | 40.5% | 33.7% | 6.8% | 5.42E-06 |
| DUOX2 | cg02550961 | chr15 | 1.5% | 1.9% | −0.4% | 6.10E-06 |
| NEO1 | cg12516231 | chr15 | 2.2% | 3.2% | −0.9% | 6.97E-06 |
| C7orf46 | cg06685724 | chr7 | 2.1% | 2.9% | −0.8% | 1.28E-05 |
| NAT15 | cg00484396 | chr16 | 9.8% | 4.9% | 4.8% | 1.56E-05 |
| cg14685975 | chr5 | 89.9% | 92.1% | −2.2% | 1.64E-05 | |
| CTSL | cg02104500 | chr9 | 3.6% | 4.9% | −1.4% | 1.66E-05 |
| cg12584257 | chr9 | 67.6% | 77.2% | −9.6% | 1.69E-05 | |
| NAT15 | cg22508957 | chr16 | 10.9% | 6.3% | 4.6% | 1.84E-05 |
| AREL1 | cg11034672 | chr14 | 11.6% | 15.0% | −3.3% | 1.86E-05 |
| cg24651265 | chr10 | 1.1% | 1.7% | −0.5% | 2.12E-05 | |
| CMBL | cg17467873 | chr5 | 1.7% | 2.1% | −0.4% | 2.21E-05 |
| EBF4 | cg05857996 | chr20 | 77.6% | 63.6% | 13.9% | 2.23E-05 |
| cg18482666 | chr2 | 95.8% | 94.8% | 1.0% | 2.39E-05 | |
| HRASLS5 | cg00489394 | chr11 | 6.6% | 7.1% | −0.5% | 2.40E-05 |
| AKAP13 | cg21530087 | chr15 | 2.2% | 2.6% | −0.4% | 2.59E-05 |
| cg15864571 | chr3 | 93.4% | 95.0% | −1.6% | 2.67E-05 | |
| FLJ35024 | cg15981195 | chr9 | 2.3% | 3.5% | −1.1% | 2.91E-05 |
The enrichment analysis was generated using consistent parameters in methylation level differences (beta >4%) and p-value (<0.01). This current analysis, however, included 1283 CpGs. KEGG showed many of the same signals discovered from the previous analysis, including “longevity regulating pathway”, “glutamatergic synapse”, “insulin secretion”, “circadian entrainment”, and “cholinergic synapse” (Table 6). GO also showed overlapping pathways compared to the first analysis, including “hypoxia-inducible factor-1alpha signaling pathway”, but also new pathways, such as “interleukin-8-mediated signaling pathway”, “negative regulation of leukocyte apoptotic process”, “neutrophil homeostasis”, and “neuron projection”, although these pathways did not reach the FDR significance level (FDR <0.05) (Table 7).
Table 6. Top 30 KEGG pathways that differed between metformin users and nonusers among the diabetes group.
| Pathway | N | DE | p-value | FDR | |||||||||||||||||||||||||||||||||||||||||||||||||||||||||||||||||||||||||||||||||||||||||||||||
| Aldosterone synthesis and secretion | 98 | 14 | 0.001 | 0.219 | |||||||||||||||||||||||||||||||||||||||||||||||||||||||||||||||||||||||||||||||||||||||||||||||
| Circadian entrainment | 97 | 14 | 0.001 | 0.219 | |||||||||||||||||||||||||||||||||||||||||||||||||||||||||||||||||||||||||||||||||||||||||||||||
| Cortisol synthesis and secretion | 65 | 10 | 0.003 | 0.303 | |||||||||||||||||||||||||||||||||||||||||||||||||||||||||||||||||||||||||||||||||||||||||||||||
| Thyroid hormone synthesis | 75 | 10 | 0.004 | 0.303 | |||||||||||||||||||||||||||||||||||||||||||||||||||||||||||||||||||||||||||||||||||||||||||||||
| Regulation of lipolysis in adipocytes | 55 | 8 | 0.006 | 0.330 | |||||||||||||||||||||||||||||||||||||||||||||||||||||||||||||||||||||||||||||||||||||||||||||||
| Parathyroid hormone synthesis, secretion and action | 106 | 13 | 0.006 | 0.330 | |||||||||||||||||||||||||||||||||||||||||||||||||||||||||||||||||||||||||||||||||||||||||||||||
| Insulin secretion | 86 | 11 | 0.007 | 0.330 | |||||||||||||||||||||||||||||||||||||||||||||||||||||||||||||||||||||||||||||||||||||||||||||||
| Calcium signaling pathway | 238 | 21.5 | 0.009 | 0.388 | |||||||||||||||||||||||||||||||||||||||||||||||||||||||||||||||||||||||||||||||||||||||||||||||
| cAMP signaling pathway | 221 | 19 | 0.010 | 0.388 | |||||||||||||||||||||||||||||||||||||||||||||||||||||||||||||||||||||||||||||||||||||||||||||||
| Cholinergic synapse | 113 | 13 | 0.012 | 0.420 | |||||||||||||||||||||||||||||||||||||||||||||||||||||||||||||||||||||||||||||||||||||||||||||||
| Chemical carcinogenesis - receptor activation | 212 | 16 | 0.015 | 0.435 | |||||||||||||||||||||||||||||||||||||||||||||||||||||||||||||||||||||||||||||||||||||||||||||||
| Glutamatergic synapse | 114 | 13 | 0.016 | 0.435 | |||||||||||||||||||||||||||||||||||||||||||||||||||||||||||||||||||||||||||||||||||||||||||||||
| Rap1 signaling pathway | 210 | 19 | 0.016 | 0.435 | |||||||||||||||||||||||||||||||||||||||||||||||||||||||||||||||||||||||||||||||||||||||||||||||
| Thermogenesis | 219 | 15 | 0.020 | 0.468 | |||||||||||||||||||||||||||||||||||||||||||||||||||||||||||||||||||||||||||||||||||||||||||||||
| Amphetamine addiction | 69 | 8 | 0.021 | 0.468 | |||||||||||||||||||||||||||||||||||||||||||||||||||||||||||||||||||||||||||||||||||||||||||||||
| Neuroactive ligand-receptor interaction | 349 | 19.5 | 0.022 | 0.468 | |||||||||||||||||||||||||||||||||||||||||||||||||||||||||||||||||||||||||||||||||||||||||||||||
| Pancreatic secretion | 101 | 9 | 0.029 | 0.552 | |||||||||||||||||||||||||||||||||||||||||||||||||||||||||||||||||||||||||||||||||||||||||||||||
| Long-term potentiation | 67 | 8 | 0.029 | 0.552 | |||||||||||||||||||||||||||||||||||||||||||||||||||||||||||||||||||||||||||||||||||||||||||||||
| Cocaine addiction | 49 | 6 | 0.036 | 0.552 | |||||||||||||||||||||||||||||||||||||||||||||||||||||||||||||||||||||||||||||||||||||||||||||||
| Phospholipase D signaling pathway | 147 | 14.5 | 0.038 | 0.552 | |||||||||||||||||||||||||||||||||||||||||||||||||||||||||||||||||||||||||||||||||||||||||||||||
| cGMP-PKG signaling pathway | 166 | 14.5 | 0.039 | 0.555 | |||||||||||||||||||||||||||||||||||||||||||||||||||||||||||||||||||||||||||||||||||||||||||||||
| Apelin signaling pathway | 139 | 12 | 0.040 | 0.555 | |||||||||||||||||||||||||||||||||||||||||||||||||||||||||||||||||||||||||||||||||||||||||||||||
| Nicotine addiction | 40 | 5 | 0.040 | 0.555 | |||||||||||||||||||||||||||||||||||||||||||||||||||||||||||||||||||||||||||||||||||||||||||||||
| EGFR tyrosine kinase inhibitor resistance | 78 | 9 | 0.041 | 0.555 | |||||||||||||||||||||||||||||||||||||||||||||||||||||||||||||||||||||||||||||||||||||||||||||||
| Inflammatory mediator regulation of TRP channels | 98 | 10 | 0.042 | 0.555 | |||||||||||||||||||||||||||||||||||||||||||||||||||||||||||||||||||||||||||||||||||||||||||||||
| Gap junction | 88 | 9 | 0.042 | 0.555 | |||||||||||||||||||||||||||||||||||||||||||||||||||||||||||||||||||||||||||||||||||||||||||||||
| Type II diabetes mellitus | 46 | 6 | 0.043 | 0.558 | |||||||||||||||||||||||||||||||||||||||||||||||||||||||||||||||||||||||||||||||||||||||||||||||
| Longevity regulating pathway | 89 | 9 | 0.045 | 0.561 | |||||||||||||||||||||||||||||||||||||||||||||||||||||||||||||||||||||||||||||||||||||||||||||||
| Salivary secretion | 92 | 8 | 0.048 | 0.578 | |||||||||||||||||||||||||||||||||||||||||||||||||||||||||||||||||||||||||||||||||||||||||||||||
| Bladder cancer | 41 | 5 | 0.054 | 0.610 | |||||||||||||||||||||||||||||||||||||||||||||||||||||||||||||||||||||||||||||||||||||||||||||||
| Relevant pathways from KEGG [58] are highlighted. Abbreviations: N: number of genes included in each pathway; DE: number of Differentially Expressed genes, which are the number of genes from the top CpG sites; FDR: False Discovery Rate. | |||||||||||||||||||||||||||||||||||||||||||||||||||||||||||||||||||||||||||||||||||||||||||||||||||
Table 7. Top 30 GO pathways that differed between metformin users and nonusers among the diabetes group.
| Pathway | Ont | N | DE | p-value | FDR | ||||||||||||||||||||||||||||||||||||||||||||||||||||||||||||||||||||||||||||||||||||||||||||||
| Neuron projection | CC | 1304 | 97.1 | 1.29E-05 | 0.286 | ||||||||||||||||||||||||||||||||||||||||||||||||||||||||||||||||||||||||||||||||||||||||||||||
| Second-messenger-mediated signaling | BP | 438 | 38.5 | 2.53E-05 | 0.286 | ||||||||||||||||||||||||||||||||||||||||||||||||||||||||||||||||||||||||||||||||||||||||||||||
| Neutrophil homeostasis | BP | 16 | 6 | 3.77E-05 | 0.286 | ||||||||||||||||||||||||||||||||||||||||||||||||||||||||||||||||||||||||||||||||||||||||||||||
| Synaptic signaling | BP | 725 | 59.5 | 9.26E-05 | 0.505 | ||||||||||||||||||||||||||||||||||||||||||||||||||||||||||||||||||||||||||||||||||||||||||||||
| Trans-synaptic signaling | BP | 708 | 57.5 | 1.67E-04 | 0.505 | ||||||||||||||||||||||||||||||||||||||||||||||||||||||||||||||||||||||||||||||||||||||||||||||
| Negative regulation of leukocyte apoptotic process | BP | 46 | 8 | 1.93E-04 | 0.505 | ||||||||||||||||||||||||||||||||||||||||||||||||||||||||||||||||||||||||||||||||||||||||||||||
| Calcium-mediated signaling | BP | 218 | 22.5 | 1.94E-04 | 0.505 | ||||||||||||||||||||||||||||||||||||||||||||||||||||||||||||||||||||||||||||||||||||||||||||||
| Chemical synaptic transmission | BP | 700 | 56.5 | 2.00E-04 | 0.505 | ||||||||||||||||||||||||||||||||||||||||||||||||||||||||||||||||||||||||||||||||||||||||||||||
| Anterograde trans-synaptic signaling | BP | 700 | 56.5 | 2.00E-04 | 0.505 | ||||||||||||||||||||||||||||||||||||||||||||||||||||||||||||||||||||||||||||||||||||||||||||||
| Positive regulation of cell-matrix adhesion | BP | 51 | 10 | 3.21E-04 | 0.682 | ||||||||||||||||||||||||||||||||||||||||||||||||||||||||||||||||||||||||||||||||||||||||||||||
| Positive regulation of multicellular organismal process | BP | 1802 | 106 | 3.39E-04 | 0.682 | ||||||||||||||||||||||||||||||||||||||||||||||||||||||||||||||||||||||||||||||||||||||||||||||
| Plasma membrane bounded cell projection | CC | 2093 | 130.1 | 4.05E-04 | 0.682 | ||||||||||||||||||||||||||||||||||||||||||||||||||||||||||||||||||||||||||||||||||||||||||||||
| Interleukin-8 receptor activity | MF | 2 | 2 | 4.44E-04 | 0.682 | ||||||||||||||||||||||||||||||||||||||||||||||||||||||||||||||||||||||||||||||||||||||||||||||
| Interleukin-8-mediated signaling pathway | BP | 2 | 2 | 4.44E-04 | 0.682 | ||||||||||||||||||||||||||||||||||||||||||||||||||||||||||||||||||||||||||||||||||||||||||||||
| Adult behavior | BP | 144 | 17.5 | 4.73E-04 | 0.682 | ||||||||||||||||||||||||||||||||||||||||||||||||||||||||||||||||||||||||||||||||||||||||||||||
| Cell junction | CC | 1858 | 123.8 | 5.16E-04 | 0.682 | ||||||||||||||||||||||||||||||||||||||||||||||||||||||||||||||||||||||||||||||||||||||||||||||
| Synapse | CC | 1168 | 85.5 | 5.27E-04 | 0.682 | ||||||||||||||||||||||||||||||||||||||||||||||||||||||||||||||||||||||||||||||||||||||||||||||
| NMDA glutamate receptor activity | MF | 7 | 4 | 6.05E-04 | 0.682 | ||||||||||||||||||||||||||||||||||||||||||||||||||||||||||||||||||||||||||||||||||||||||||||||
| Hypoxia-inducible factor-1alpha signaling pathway | BP | 6 | 3 | 6.39E-04 | 0.682 | ||||||||||||||||||||||||||||||||||||||||||||||||||||||||||||||||||||||||||||||||||||||||||||||
| Regulation of dendrite development | BP | 148 | 19 | 6.44E-04 | 0.682 | ||||||||||||||||||||||||||||||||||||||||||||||||||||||||||||||||||||||||||||||||||||||||||||||
| Axon | CC | 606 | 50.6 | 6.46E-04 | 0.682 | ||||||||||||||||||||||||||||||||||||||||||||||||||||||||||||||||||||||||||||||||||||||||||||||
| Low voltage-gated calcium channel activity | MF | 3 | 3 | 7.18E-04 | 0.682 | ||||||||||||||||||||||||||||||||||||||||||||||||||||||||||||||||||||||||||||||||||||||||||||||
| Dendrite development | BP | 232 | 26.5 | 7.28E-04 | 0.682 | ||||||||||||||||||||||||||||||||||||||||||||||||||||||||||||||||||||||||||||||||||||||||||||||
| Vestibulocochlear nerve development | BP | 10 | 4 | 7.64E-04 | 0.682 | ||||||||||||||||||||||||||||||||||||||||||||||||||||||||||||||||||||||||||||||||||||||||||||||
| Ionotropic glutamate receptor signaling pathway | BP | 25 | 7 | 7.69E-04 | 0.682 | ||||||||||||||||||||||||||||||||||||||||||||||||||||||||||||||||||||||||||||||||||||||||||||||
| Neuron projection development | BP | 976 | 74 | 8.82E-04 | 0.682 | ||||||||||||||||||||||||||||||||||||||||||||||||||||||||||||||||||||||||||||||||||||||||||||||
| Cellular response to glucose stimulus | BP | 132 | 15 | 9.26E-04 | 0.682 | ||||||||||||||||||||||||||||||||||||||||||||||||||||||||||||||||||||||||||||||||||||||||||||||
| Locomotory behavior | BP | 198 | 21.5 | 9.36E-04 | 0.682 | ||||||||||||||||||||||||||||||||||||||||||||||||||||||||||||||||||||||||||||||||||||||||||||||
| Cellular response to hexose stimulus | BP | 134 | 15 | 1.08E-03 | 0.682 | ||||||||||||||||||||||||||||||||||||||||||||||||||||||||||||||||||||||||||||||||||||||||||||||
| Positive regulation of cellular component biogenesis | BP | 533 | 41 | 1.12E-03 | 0.682 | ||||||||||||||||||||||||||||||||||||||||||||||||||||||||||||||||||||||||||||||||||||||||||||||
| Relevant pathways are highlighted. Abbreviations: Ont: Ontology; BP: biological process; CC: cellular component; MF: molecular function; N: number of genes included in each pathway; DE: number of Differentially Expressed genes, which are the number of genes from the top CpG sites; FDR: False Discovery Rate. | |||||||||||||||||||||||||||||||||||||||||||||||||||||||||||||||||||||||||||||||||||||||||||||||||||
DNA methylation age acceleration
Among the diabetes group, metformin nonusers had a mean age acceleration of −8.07 compared to a mean age acceleration of −4.47 for metformin users (p = 0.11) (Figure 1). This difference was smaller among all the subjects included regardless of diabetes status (−5.92 for metformin nonusers vs. −4.47 for metformin users; p = 0.34) (Figure 2). Both analyses did not reach statistical significance.
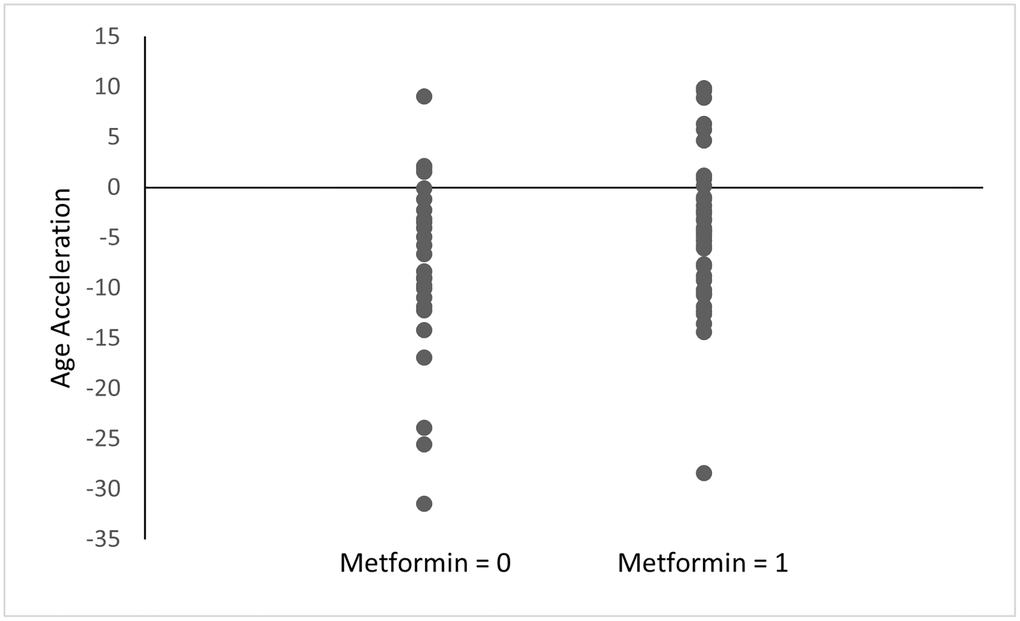
Figure 1. Age acceleration between metformin users and nonusers among the diabetes group. Age acceleration was calculated using the Horvath epigenetic clock as DNAm age - chronological age. Metformin = 0: without history of metformin use, Metformin = 1: with history of metformin use. p = 0.11.
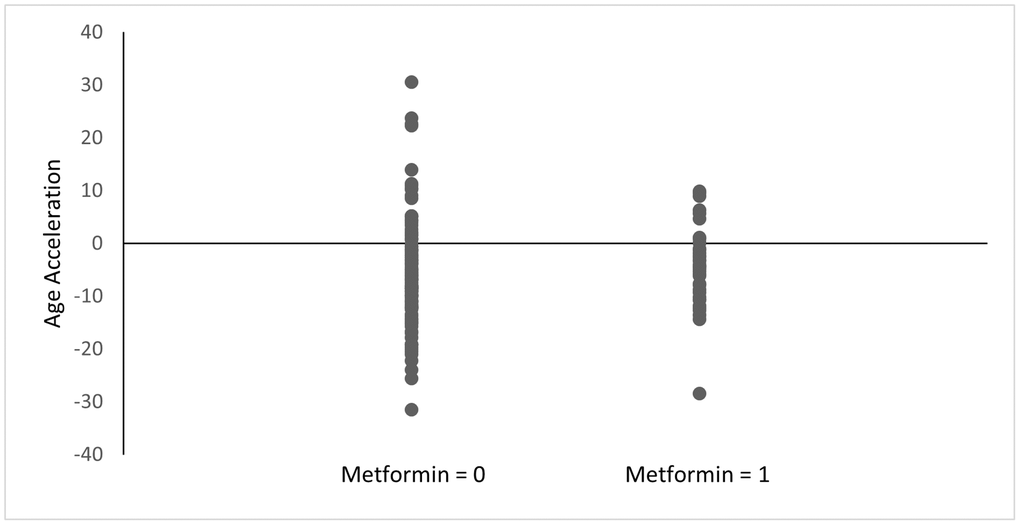
Figure 2. Age acceleration between metformin users and nonusers. Age acceleration was calculated using the Horvath epigenetic clock as DNAm age - chronological age. Metformin = 0: without history of metformin use, Metformin = 1: with history of metformin use. p = 0.34.
Discussion
In this study, we compared genome-wide DNA methylation rates among metformin users and nonusers to investigate the potential epigenetic effects of metformin exposure. Enrichment analysis was employed to elucidate the possible mechanisms of action induced by metformin. Our KEGG analysis revealed evidence of differences in epigenetic profiles involved in “longevity” such as “longevity regulating pathway” and “longevity regulating pathway – multiple species” (Tables 3 and 6). Although it was not statistically significant, the appearance of these pathways among top signals in the KEGG analysis demonstrates the potential role of the epigenetic processes manifesting the effect of metformin on longevity. The same KEGG analysis also showed “AMPK signaling pathway” (Table 3). AMP-activated protein kinase (AMPK), an energy sensor that regulates metabolism, is commonly referred to as one of the targets of metformin’s hypothetical mechanisms of action [18, 19], although there is also evidence that metformin’s effects are in part AMPK-independent [20]. Furthermore, AMPK activation is related to subsequent activation of hypoxia-inducible factors [21] which also appeared in our GO analyses as “regulation of hypoxia-inducible factor-1alpha signaling pathway” and “positive regulation of hypoxia-inducible factor-1alpha signaling pathway” (Table 4), as well as “hypoxia-inducible factor-1alpha signaling pathway” (Table 7). Hypoxia-inducible factor-1alpha (HIF-1α) is a transcription factor expressed in nucleated cells and mediated by oxygen levels. HIF-1α has been implicated in age-related diseases, endothelial senescence progression, AMPK, and many other pathways [22]. Beyond metformin’s potential epigenetic medication related to longevity, several pathways related to delirium, such as “circadian entrainment”, “cholinergic synapse”, and “glutamatergic synapse”, were identified (Tables 3 and 6). These pathways are intriguing from metformin’s possible “anti-aging” standpoint as age is a major risk factor of delirium.
The beneficial effects of metformin on lifespan have been widely studied. Previous studies reported that metformin increased median lifespan of C. elegans co-cultured with E.coli by more than 35% [9, 23], and prolonged the lifespan of mice [10]. Patients with age-related diseases such as cardiovascular diseases and cancer who take metformin also had lower rates of mortality [24, 25]. Our recent study using a cohort of over 1,400 inpatients also revealed that diabetic patients with a history of metformin use have a significantly lower 3-year mortality than diabetic patients who have not taken metformin [12]. There are, however, conflicting reports as well. For example, the same effect was not observed in Drosophila [26]. Also, age-dependent, dose-dependent, and gender-dependent variable effects on lifespan were reported in mice [27, 28]. Although these previous studies’ results are not consistent, our cohort mentioned above (from which the present data are an analysis of its subgroup) clearly showed a positive influence of metformin use on survival among diabetic inpatients [12].
Our epigenetics data presented herein support metformin’s broad range of potential effects as indicated by the pathways identified through the enrichment analysis. The KEGG analysis (Table 7) showed several signals related to inflammation and the immune system, such as “interleukin-8 receptor activity” and “negative regulation of leukocyte apoptotic process.” The appearance of inflammation-related pathways is intriguing considering strong evidence showing that elderly people present with low-grade, chronic inflammation [29]. These signals identified in our study may support our hypothesis that metformin can modify the inflammatory process through epigenetic modification and influence the likelihood of survival. Consistent with our data, Barath et al. also reported that metformin inhibited cytokine production from Th17 by correcting age-related changes in autophagy and mitochondrial bioenergetics, indicating its potential for the medication to promote healthy aging [30]. Among the literature supporting metformin’s role in suppressing inflammation, clinical trials including the Diabetes Prevention Program (DPP) [31] and Bypass Angioplasty Revascularization Investigation 2 Diabetes (BARI 2D) [32] have provided further evidence of metformin’s role in changing inflammatory biomarker levels among diabetic patients, while other clinical trials, such as the Lantus for C-reactive Protein Reduction in Early Treatment of Type 2 Diabetes (LANCET) [33], have found opposing evidence. Although several studies mentioned here have investigated the relationship between metformin and its potential anti-inflammation, a clinical trial aimed to confirm metformin’s role in aging is yet to be seen [2, 34]. It is worth mentioning, nonetheless, a small clinical study that demonstrated the regression of epigenetic age of patients through the administration of recombinant human growth hormone (rhGH), dehydroepiandrosterone (DHEA), and metformin [15]. As the study team administered three medications to their subjects at the same time, it is impossible to distinguish epigenetic changes caused only by metformin. It is also worth mentioning the unexpected results from the Horvath epigenetic clock since subjects with history of metformin use had relatively higher age acceleration than subjects without history of metformin. Still, neither reached statistical significance (p < 0.05). Future prospective studies comparing epigenetics marks before and after metformin use would be needed to better understand the direct effect of the medication.
In DM-only subjects, A-kinase anchoring protein 13 (AKAP13) gene was found (Table 5). A recent study showed that AKAP13 inhibits mammalian target of rapamycin complex 1 (mTORC1), which was present in our enrichment analysis as “mTOR signaling pathway” (Table 3). Furthermore, the degree of AKAP13 expression in lung adenocarcinoma cell lines correlates with mTORC1 activity [35]. Metformin’s anti-inflammatory effect has been shown to occur through eventual AMPK activation, which also inhibits the mTOR signaling pathway [18]. Metformin’s connection to AKAP13, which has yet been fully understood, deserves further investigation.
To the best of our knowledge, our study is the largest of its kind. A smaller, previous study also investigated metformin’s effect on genome-wide DNA methylation in human peripheral blood, although their study power was limited to a sample size of 32 male subjects [36]. Enrichment analysis in the present study revealing the longevity pathway from a hypothesis-free approach further strengthens our hypothesis that metformin exhibits its potential benefit for longevity through epigenetic processes. We also identified other relevant pathways associated with metformin’s mechanisms of action, such as the AMPK signaling pathway and HIF-1α signaling pathway [37].
Our study has several limitations. Although 171 subjects were analyzed retrospectively in this study, a controlled prospective study with a larger sample size would provide a better picture of the epigenetic mechanism of metformin on longevity. In addition, none of the individual CpG sites reached genome-wide significance (p < 5E-08). Thus, our findings should be interpreted as exploratory and hypothesis-generating. However, the fact that we found their biological relevance to metformin’s roles is still worth noting. As diabetes and metformin use status of the subjects was determined based on a retrospective chart review of electronic medical records, there are possibilities for misclassification, although we were still able to find multiple relevant pathways and genes of interest related to metformin’s action. Moreover, the duration of metformin use was not precisely assessed, making our definition of “metformin history use” broad since it might have included patients who took metformin for only a few months and patients who took metformin for years, for instance. Also, other types of diabetic medications were not investigated, such as sulfonylureas and glinide drugs as we used an already completed study dataset from our previous work. The rationale for us not investigating the influence of other diabetic medications was based on past literature showing that those diabetic medications other than metformin did not show benefits for survival. In fact, sometimes they were associated with worse mortality [38–40].
In summary, the data presented here support our hypothesis that epigenetics, especially DNA methylation, may be altered by metformin use and that such epigenetic processes potentially contribute to molecular mechanisms leading to longevity. Further careful investigation with a larger sample size would be warranted.
Methods
Study participants and recruitment
We have previously recruited patients at the University of Iowa Hospital and Clinics (UIHC) for a separate study related to delirium from January 2016 to March 2020 [41–44]. Among them, we used data from a subgroup of patients recruited from November 2017 to March 2020 who had blood samples collected and processed for the epigenetics analysis [45–47]. Patients 18 years or older, who were admitted to the emergency department, orthopedics floor, general medicine floor, or intensive care unit were approached. Only those who consented, or whose legally authorized representative consented, were enlisted in the study. Written informed consent was obtained from all participants. Exclusion criteria included subjects whose goals of care were comfort measures only, those who were prisoners, or individuals with droplet/contact precautions. Further details of the study subjects and enrollment process are described previously [41–44].
We tested 173 subjects for genome-wide DNA methylation (DNAm) status, then conducted a post-hoc analysis of the available data to assess the influence of metformin. This study was approved by the University of Iowa Hospital and Clinics Institutional Review Board, and all procedures were compliant with the Declaration of Helsinki.
Clinical information
Clinical variables were gathered through electronic medical chart review, patient interviews, and collateral information from family members [41–44]. Metformin use, insulin use, and type 2 diabetes mellitus (DM) history were obtained by using the search terms “metformin”, “insulin”, and “DM” or “diabetes”, respectively [12]. Only type 2 diabetes mellitus (DM) was included, excluding type 1 diabetes mellitus or gestational diabetes. If there was a history of metformin prescription before the study enrollment, patients were categorized as metformin users (Met). Those who were prescribed metformin after participation were not categorized as metformin users (non-Met) since the blood was obtained prior to such prescription.
Sample collection
Blood samples were collected in EDTA tubes during patients’ hospital stay. Samples were shipped to the research laboratory and stored at −80°C until downstream analysis as a batch.
Sample analysis
DNA was extracted from whole blood following the MasterPure™ DNA Purification kit (Epicentre, MCD 85201). DNA passing quality control based on NanoDrop spectrometry and in sufficient amount through the Qubit dsDNA Broad Range Assay Kit (ThermoFischer Scientific, Q32850) was selected for analysis for genome-wide DNAm status. 500 ng of genomic DNA from each sample was bisulfite-converted with the EZ DNA Methylation™ Kit (Zymo Research, D5002) and analyzed using Infinium HumanMethylationEPICBeadChip™ Kit (Illumina, WG-317-1002). The Illumina iScan platform scanned the arrays.
Statistics and bioinformatics analysis
All analyses were conducted using R. The R packages ChAMP [48] and minfi [49] were used to process the data. Data from a total of 175 samples from 173 subjects were included for the statistical and bioinformatic analysis. DNAm levels for each CpG site were first compared between those with and without a history of metformin prescription (first run; Supplementary Table 1). Then, comparison limited among only DM patients between those with and without a history of metformin prescription was conducted to avoid potential influence of DM on DNAm status (second run; Supplementary Table 2).
During quality control processes, 2 samples from the first run and no samples from the second run were excluded based on the density analysis plots as a part of our quality control pipeline. 2 samples were also excluded because two patients had their blood collected twice. The first collected samples were included for further analysis while the second samples were excluded to maintain consistency between samples from all subjects. Therefore, 171 subjects from the first run and 63 subjects from the second run remained for the analysis. Furthermore, during the data loading process, probes were filtered out if they (i) had a detection p-value >0.01, (ii) had <3 beads in at least 5% of samples per probe, (iii) were non-CpG, SNP-related, or multi-hit probes, or (iv) were located on chromosome X or Y. Beta mixture quantile dilation [50] was used to normalize samples, while the combat normalization method was used to correct for batch effect in the first run [51, 52]. The second run, which only included diabetic patients, was not corrected for batch effect because there were individual patients who were not part of any batches.
Top hits based on each CpG site difference were obtained through the RnBeads package using the limma method [53, 54] and accounting for age, sex, insulin use, BMI and cell type proportions (CD8 T cells, CD4 T cells, natural killer cells, B cells, and monocytes) as covariates. DNAm Age Calculator available online [55] calculated the cell type proportions through the method reported previously [56].
After obtaining the top CpG sites, enrichment analysis followed using missMethyl [57] and unbalanced numbers of CpG sites on each gene were controlled using the EPIC array. Gene Ontology (GO) and Kyoto Encyclopedia of Genes and Genome (KEGG) [58] analysis was conducted. The number of CpG sites included in the analysis was determined by the combination of p-value and beta value cutoffs of the methylation rates of each CpG site (p < .01 and beta >0.04). Genome-wide significance was set at a p-value of less than = 5.0E-08.
The chi-square test compared the categorical data (sex, race, and insulin use) between two groups, while the Welch’s t-test compared the numerical data (age, BMI, and CCI) between two groups.
DNA methylation aging clock analysis
To investigate whether subjects with history of metformin use had slower “age acceleration” than subjects without history of metformin use, we submitted the raw DNA methylation beta values to a publicly available tool, which includes the Horvath [55] method. The calculated output was the difference between the DNA methylation age and the chronological age.
Availability of data materials
The datasets analyzed during the current study are available from the corresponding author upon reasonable request.
Author Contributions
P.S.M. collected, analyzed the data and wrote the manuscript. T.Y. organized the clinical dataset and edited the manuscript. K.J.C, Z.E.M.A., M.M., G.C., and T.T. collected clinical data and biological samples, and processed them. N.E.W, K.J.C., M.I., and H.R.C. critically reviewed the manuscript. G.S. conceived the ideas of the study, planned its design and coordination, and wrote and edited the manuscript.
Acknowledgments
The authors thank the patients who participated in this study.
Conflicts of Interest
Gen Shinozaki is co-founder of Predelix Medical LLC and has pending patents as follows: “Non-invasive device for predicting and screening delirium”, PCT application no. PCT/US2016/064937 and US provisional patent no. 62/263,325; “Prediction of patient outcomes with a novel electroencephalography device”, US provisional patent no. 62/829,411; “Epigenetic Biomarker of Delirium Risk” in the PCT Application No. PCT/US19/51276, and in U.S. Provisional Patent No. 62/731,599. Pedro S. Marra, Takehiko Yamanashi, Kaitlyn J. Crutchley, Nadia E. Wahba, Zoe-Ella M. Anderson, Manisha Modukuri, Gloria Chang, Tammy Tran, Masaaki Iwata, and Hyunkeun Ryan Cho have declared that no Conflicts of Interest exist.
Ethical Statement and Consent
This study was approved by the University of Iowa Hospital and Clinics Institutional Review Board, and all procedures were compliant with the Declaration of Helsinki. Written informed consent was obtained from all participants.
References
- 1. Older People Projected to Outnumber Children for First Time in U.S. History. United States Census Bureau. 2018. https://www.census.gov/newsroom/press-releases/2018/cb18-41-population-projections.html (11/7/2021).
- 2. Barzilai N, Crandall JP, Kritchevsky SB, Espeland MA. Metformin as a Tool to Target Aging. Cell Metab. 2016; 23:1060–5. https://doi.org/10.1016/j.cmet.2016.05.011 [PubMed]
- 3. Bjedov I, Toivonen JM, Kerr F, Slack C, Jacobson J, Foley A, Partridge L. Mechanisms of life span extension by rapamycin in the fruit fly Drosophila melanogaster. Cell Metab. 2010; 11:35–46. https://doi.org/10.1016/j.cmet.2009.11.010 [PubMed]
- 4. Bitto A, Ito TK, Pineda VV, LeTexier NJ, Huang HZ, Sutlief E, Tung H, Vizzini N, Chen B, Smith K, Meza D, Yajima M, Beyer RP, et al. Transient rapamycin treatment can increase lifespan and healthspan in middle-aged mice. Elife. 2016; 5:e16351. https://doi.org/10.7554/eLife.16351 [PubMed]
- 5. Howitz KT, Bitterman KJ, Cohen HY, Lamming DW, Lavu S, Wood JG, Zipkin RE, Chung P, Kisielewski A, Zhang LL, Scherer B, Sinclair DA. Small molecule activators of sirtuins extend Saccharomyces cerevisiae lifespan. Nature. 2003; 425:191–6. https://doi.org/10.1038/nature01960 [PubMed]
- 6. Baur JA, Sinclair DA. Therapeutic potential of resveratrol: the in vivo evidence. Nat Rev Drug Discov. 2006; 5:493–506. https://doi.org/10.1038/nrd2060 [PubMed]
- 7. Baur JA, Pearson KJ, Price NL, Jamieson HA, Lerin C, Kalra A, Prabhu VV, Allard JS, Lopez-Lluch G, Lewis K, Pistell PJ, Poosala S, Becker KG, et al. Resveratrol improves health and survival of mice on a high-calorie diet. Nature. 2006; 444:337–42. https://doi.org/10.1038/nature05354 [PubMed]
- 8. Rajman L, Chwalek K, Sinclair DA. Therapeutic Potential of NAD-Boosting Molecules: The In Vivo Evidence. Cell Metab. 2018; 27:529–47. https://doi.org/10.1016/j.cmet.2018.02.011 [PubMed]
- 9. Onken B, Driscoll M. Metformin induces a dietary restriction-like state and the oxidative stress response to extend C. elegans Healthspan via AMPK, LKB1, and SKN-1. PLoS One. 2010; 5:e8758. https://doi.org/10.1371/journal.pone.0008758 [PubMed]
- 10. Martin-Montalvo A, Mercken EM, Mitchell SJ, Palacios HH, Mote PL, Scheibye-Knudsen M, Gomes AP, Ward TM, Minor RK, Blouin MJ, Schwab M, Pollak M, Zhang Y, et al. Metformin improves healthspan and lifespan in mice. Nat Commun. 2013; 4:2192. https://doi.org/10.1038/ncomms3192 [PubMed]
- 11. de Kreutzenberg SV, Ceolotto G, Cattelan A, Pagnin E, Mazzucato M, Garagnani P, Borelli V, Bacalini MG, Franceschi C, Fadini GP, Avogaro A. Metformin improves putative longevity effectors in peripheral mononuclear cells from subjects with prediabetes. A randomized controlled trial. Nutr Metab Cardiovasc Dis. 2015; 25:686–93. https://doi.org/10.1016/j.numecd.2015.03.007 [PubMed]
- 12. Yamanashi T, Anderson ZE, Modukuri M, Chang G, Tran T, Marra PS, Wahba NE, Crutchley KJ, Sullivan EJ, Jellison SS, Comp KR, Akers CC, Meyer AA, et al. The potential benefit of metformin to reduce delirium risk and mortality: a retrospective cohort study. Aging (Albany NY). 2022; 14:8927–43. https://doi.org/10.18632/aging.204393 [PubMed]
- 13. Ngwa JS, Nwulia E, Ntekim O, Bedada FB, Kwabi-Addo B, Nadarajah S, Johnson S, Southerland WM, Kwagyan J, Obisesan TO. Aerobic Exercise Training-Induced Changes on DNA Methylation in Mild Cognitively Impaired Elderly African Americans: Gene, Exercise, and Memory Study - GEMS-I. Front Mol Neurosci. 2022; 14:752403. https://doi.org/10.3389/fnmol.2021.752403 [PubMed]
- 14. Ng GY, Sheng DPL, Bae HG, Kang SW, Fann DY, Park J, Kim J, Alli-Shaik A, Lee J, Kim E, Park S, Han JW, Karamyan V, et al. Integrative epigenomic and transcriptomic analyses reveal metabolic switching by intermittent fasting in brain. Geroscience. 2022; 44:2171–94. https://doi.org/10.1007/s11357-022-00537-z [PubMed]
- 15. Fahy GM, Brooke RT, Watson JP, Good Z, Vasanawala SS, Maecker H, Leipold MD, Lin DTS, Kobor MS, Horvath S. Reversal of epigenetic aging and immunosenescent trends in humans. Aging Cell. 2019; 18:e13028. https://doi.org/10.1111/acel.13028 [PubMed]
- 16. Kim D, Kim Y, Lee BB, Cho EY, Han J, Shim YM, Kim DH. Metformin Reduces Histone H3K4me3 at the Promoter Regions of Positive Cell Cycle Regulatory Genes in Lung Cancer Cells. Cancers (Basel). 2021; 13:739. https://doi.org/10.3390/cancers13040739 [PubMed]
- 17. Nwanaji-Enwerem JC, Chung FF, Van der Laan L, Novoloaca A, Cuenin C, Johansson H, Bonanni B, Hubbard AE, Smith MT, Hartman SJ, Cardenas A, Sears DD, Herceg Z. An epigenetic aging analysis of randomized metformin and weight loss interventions in overweight postmenopausal breast cancer survivors. Clin Epigenetics. 2021; 13:224. https://doi.org/10.1186/s13148-021-01218-y [PubMed]
- 18. Burkewitz K, Weir HJ, Mair WB. AMPK as a Pro-longevity Target. Exp Suppl. 2016; 107:227–56. https://doi.org/10.1007/978-3-319-43589-3_10 [PubMed]
- 19. Ma T, Tian X, Zhang B, Li M, Wang Y, Yang C, Wu J, Wei X, Qu Q, Yu Y, Long S, Feng JW, Li C, et al. Low-dose metformin targets the lysosomal AMPK pathway through PEN2. Nature. 2022; 603:159–65. https://doi.org/10.1038/s41586-022-04431-8 [PubMed]
- 20. Foretz M, Hébrard S, Leclerc J, Zarrinpashneh E, Soty M, Mithieux G, Sakamoto K, Andreelli F, Viollet B. Metformin inhibits hepatic gluconeogenesis in mice independently of the LKB1/AMPK pathway via a decrease in hepatic energy state. J Clin Invest. 2010; 120:2355–69. https://doi.org/10.1172/JCI40671 [PubMed]
- 21. Salminen A, Kaarniranta K, Kauppinen A. AMPK and HIF signaling pathways regulate both longevity and cancer growth: the good news and the bad news about survival mechanisms. Biogerontology. 2016; 17:655–80. https://doi.org/10.1007/s10522-016-9655-7 [PubMed]
- 22. Alique M, Sánchez-López E, Bodega G, Giannarelli C, Carracedo J, Ramírez R. Hypoxia-Inducible Factor-1α: The Master Regulator of Endothelial Cell Senescence in Vascular Aging. Cells. 2020; 9:195. https://doi.org/10.3390/cells9010195 [PubMed]
- 23. Cabreiro F, Au C, Leung KY, Vergara-Irigaray N, Cochemé HM, Noori T, Weinkove D, Schuster E, Greene ND, Gems D. Metformin retards aging in C. elegans by altering microbial folate and methionine metabolism. Cell. 2013; 153:228–39. https://doi.org/10.1016/j.cell.2013.02.035 [PubMed]
- 24. Morales DR, Morris AD. Metformin in cancer treatment and prevention. Annu Rev Med. 2015; 66:17–29. https://doi.org/10.1146/annurev-med-062613-093128 [PubMed]
- 25. Luo F, Das A, Chen J, Wu P, Li X, Fang Z. Metformin in patients with and without diabetes: a paradigm shift in cardiovascular disease management. Cardiovasc Diabetol. 2019; 18:54. https://doi.org/10.1186/s12933-019-0860-y [PubMed]
- 26. Slack C, Foley A, Partridge L. Activation of AMPK by the putative dietary restriction mimetic metformin is insufficient to extend lifespan in Drosophila. PLoS One. 2012; 7:e47699. https://doi.org/10.1371/journal.pone.0047699 [PubMed]
- 27. Anisimov VN, Piskunova TS, Popovich IG, Zabezhinski MA, Tyndyk ML, Egormin PA, Yurova MV, Rosenfeld SV, Semenchenko AV, Kovalenko IG, Poroshina TE, Berstein LM. Gender differences in metformin effect on aging, life span and spontaneous tumorigenesis in 129/Sv mice. Aging (Albany NY). 2010; 2:945–58. https://doi.org/10.18632/aging.100245 [PubMed]
- 28. Novelle MG, Ali A, Diéguez C, Bernier M, de Cabo R. Metformin: A Hopeful Promise in Aging Research. Cold Spring Harb Perspect Med. 2016; 6:a025932. https://doi.org/10.1101/cshperspect.a025932 [PubMed]
- 29. Calçada D, Vianello D, Giampieri E, Sala C, Castellani G, de Graaf A, Kremer B, van Ommen B, Feskens E, Santoro A, Franceschi C, Bouwman J. The role of low-grade inflammation and metabolic flexibility in aging and nutritional modulation thereof: a systems biology approach. Mech Ageing Dev. 2014; 136-137:138–47. https://doi.org/10.1016/j.mad.2014.01.004 [PubMed]
- 30. Bharath LP, Agrawal M, McCambridge G, Nicholas DA, Hasturk H, Liu J, Jiang K, Liu R, Guo Z, Deeney J, Apovian CM, Snyder-Cappione J, Hawk GS, et al. Metformin Enhances Autophagy and Normalizes Mitochondrial Function to Alleviate Aging-Associated Inflammation. Cell Metab. 2020; 32:44–55.e6. https://doi.org/10.1016/j.cmet.2020.04.015 [PubMed]
- 31. Haffner S, Temprosa M, Crandall J, Fowler S, Goldberg R, Horton E, Marcovina S, Mather K, Orchard T, Ratner R, Barrett-Connor E, and Diabetes Prevention Program Research Group. Intensive lifestyle intervention or metformin on inflammation and coagulation in participants with impaired glucose tolerance. Diabetes. 2005; 54:1566–72. https://doi.org/10.2337/diabetes.54.5.1566 [PubMed]
- 32. Sobel BE, Hardison RM, Genuth S, Brooks MM, McBane RD
3rd , Schneider DJ, Pratley RE, Huber K, Wolk R, Krishnaswami A, Frye RL, and BARI 2D Investigators. Profibrinolytic, antithrombotic, and antiinflammatory effects of an insulin-sensitizing strategy in patients in the Bypass Angioplasty Revascularization Investigation 2 Diabetes (BARI 2D) trial. Circulation. 2011; 124:695–703. https://doi.org/10.1161/CIRCULATIONAHA.110.014860 [PubMed] - 33. Pradhan AD, Everett BM, Cook NR, Rifai N, Ridker PM. Effects of initiating insulin and metformin on glycemic control and inflammatory biomarkers among patients with type 2 diabetes: the LANCET randomized trial. JAMA. 2009; 302:1186–94. https://doi.org/10.1001/jama.2009.1347 [PubMed]
- 34. Kulkarni AS, Gubbi S, Barzilai N. Benefits of Metformin in Attenuating the Hallmarks of Aging. Cell Metab. 2020; 32:15–30. https://doi.org/10.1016/j.cmet.2020.04.001 [PubMed]
- 35. Zhang S, Wang H, Melick CH, Jeong MH, Curukovic A, Tiwary S, Lama-Sherpa TD, Meng D, Servage KA, James NG, Jewell JL. AKAP13 couples GPCR signaling to mTORC1 inhibition. PLoS Genet. 2021; 17:e1009832. https://doi.org/10.1371/journal.pgen.1009832 [PubMed]
- 36. Li M, Bao L, Zhu P, Wang S. Effect of metformin on the epigenetic age of peripheral blood in patients with diabetes mellitus. Front Genet. 2022; 13:955835. https://doi.org/10.3389/fgene.2022.955835 [PubMed]
- 37. Song H, Zhang X, Zhai R, Liang H, Song G, Yuan Y, Xu Y, Yan Y, Qiu L, Sun T. Metformin attenuated sepsis-associated liver injury and inflammatory response in aged mice. Bioengineered. 2022; 13:4598–609. https://doi.org/10.1080/21655979.2022.2036305 [PubMed]
- 38. Effect of intensive blood-glucose control with metformin on complications in overweight patients with type 2 diabetes (UKPDS 34). UK Prospective Diabetes Study (UKPDS) Group. Lancet. 1998; 352:854–65. [PubMed]
- 39. Johnson JA, Majumdar SR, Simpson SH, Toth EL. Decreased mortality associated with the use of metformin compared with sulfonylurea monotherapy in type 2 diabetes. Diabetes Care. 2002; 25:2244–8. https://doi.org/10.2337/diacare.25.12.2244 [PubMed]
- 40. Cho EH, Han K, Kim B, Lee DH. Gliclazide monotherapy increases risks of all-cause mortality and has similar risk of acute myocardial infarction and stroke with glimepiride monotherapy in Korean type 2 diabetes mellitus. Medicine (Baltimore). 2020; 99:e21236. https://doi.org/10.1097/MD.0000000000021236 [PubMed]
- 41. Shinozaki G, Chan AC, Sparr NA, Zarei K, Gaul LN, Heinzman JT, Robles J, Yuki K, Chronis TJ, Ando T, Wong T, Sabbagh S, Weckmann MT, et al. Delirium detection by a novel bispectral electroencephalography device in general hospital. Psychiatry Clin Neurosci. 2018; 72:856–63. https://doi.org/10.1111/pcn.12783 [PubMed]
- 42. Shinozaki G, Bormann NL, Chan AC, Zarei K, Sparr NA, Klisares MJ, Jellison SS, Heinzman JT, Dahlstrom EB, Duncan GN, Gaul LN, Wanzek RJ, Cramer EM, et al. Identification of Patients With High Mortality Risk and Prediction of Outcomes in Delirium by Bispectral EEG. J Clin Psychiatry. 2019; 80:19m12749. https://doi.org/10.4088/JCP.19m12749 [PubMed]
- 43. Saito T, Malicoat JR, Leyden LR, Williams JC, Jellison SS, Long H, Hellman MM, Crutchley KJ, Anderson ZEM, Lo D, Modukuri MV, Schacher CJ, Yoshino A, et al. Mortality prediction by bispectral electroencephalography among 502 patients: its role in dementia. Brain Commun. 2021; 3:fcab037. https://doi.org/10.1093/braincomms/fcab037 [PubMed]
- 44. Yamanashi T, Crutchley KJ, Wahba NE, Sullivan EJ, Comp KR, Kajitani M, Tran T, Modukuri MV, Marra PS, Herrmann FM, Chang G, Anderson ZM, Iwata M, et al. Evaluation of point-of-care thumb-size bispectral electroencephalography device to quantify delirium severity and predict mortality. Br J Psychiatry. 2021. [Epub ahead of print]. https://doi.org/10.1192/bjp.2021.101 [PubMed]
- 45. Saito T, Toda H, Duncan GN, Jellison SS, Yu T, Klisares MJ, Daniel S, Andreasen AJ, Leyden LR, Hellman MM, Shinozaki E, Lee S, Yoshino A, et al. Epigenetics of neuroinflammation: Immune response, inflammatory response and cholinergic synaptic involvement evidenced by genome-wide DNA methylation analysis of delirious inpatients. J Psychiatr Res. 2020; 129:61–5. https://doi.org/10.1016/j.jpsychires.2020.06.005 [PubMed]
- 46. Saito T, Braun PR, Daniel S, Jellison SS, Hellman M, Shinozaki E, Lee S, Cho HR, Yoshino A, Toda H, Shinozaki G. The relationship between DNA methylation in neurotrophic genes and age as evidenced from three independent cohorts: differences by delirium status. Neurobiol Aging. 2020; 94:227–35. https://doi.org/10.1016/j.neurobiolaging.2020.06.003 [PubMed]
- 47. Yamanashi T, Saito T, Yu T, Alario A, Comp K, Crutchley KJ, Sullivan EJ, Anderson ZM, Marra PS, Chang G, Wahba NE, Jellison SS, Meyer AA, et al. DNA methylation in the TNF-alpha gene decreases along with aging among delirium inpatients. Neurobiol Aging. 2021; 105:310–7. https://doi.org/10.1016/j.neurobiolaging.2021.05.005 [PubMed]
- 48. Morris TJ, Butcher LM, Feber A, Teschendorff AE, Chakravarthy AR, Wojdacz TK, Beck S. ChAMP: 450k Chip Analysis Methylation Pipeline. Bioinformatics. 2014; 30:428–30. https://doi.org/10.1093/bioinformatics/btt684 [PubMed]
- 49. Aryee MJ, Jaffe AE, Corrada-Bravo H, Ladd-Acosta C, Feinberg AP, Hansen KD, Irizarry RA. Minfi: a flexible and comprehensive Bioconductor package for the analysis of Infinium DNA methylation microarrays. Bioinformatics. 2014; 30:1363–9. https://doi.org/10.1093/bioinformatics/btu049 [PubMed]
- 50. Teschendorff AE, Marabita F, Lechner M, Bartlett T, Tegner J, Gomez-Cabrero D, Beck S. A beta-mixture quantile normalization method for correcting probe design bias in Illumina Infinium 450 k DNA methylation data. Bioinformatics. 2013; 29:189–96. https://doi.org/10.1093/bioinformatics/bts680 [PubMed]
- 51. Johnson WE, Li C, Rabinovic A. Adjusting batch effects in microarray expression data using empirical Bayes methods. Biostatistics. 2007; 8:118–27. https://doi.org/10.1093/biostatistics/kxj037 [PubMed]
- 52. Leek JT, Johnson WE, Parker HS, Jaffe AE, Storey JD, Zhang Y, Torres LC. sva: Surrogate Variable Analysis. R package version 3.42.0. 2021.
- 53. Assenov Y, Müller F, Lutsik P, Walter J, Lengauer T, Bock C. Comprehensive analysis of DNA methylation data with RnBeads. Nat Methods. 2014; 11:1138–40. https://doi.org/10.1038/nmeth.3115 [PubMed]
- 54. Ritchie ME, Phipson B, Wu D, Hu Y, Law CW, Shi W, Smyth GK. limma powers differential expression analyses for RNA-sequencing and microarray studies. Nucleic Acids Res. 2015; 43:e47. https://doi.org/10.1093/nar/gkv007 [PubMed]
- 55. Horvath S. DNA methylation age of human tissues and cell types. Genome Biol. 2013; 14:R115. https://doi.org/10.1186/gb-2013-14-10-r115 [PubMed]
- 56. Houseman EA, Accomando WP, Koestler DC, Christensen BC, Marsit CJ, Nelson HH, Wiencke JK, Kelsey KT. DNA methylation arrays as surrogate measures of cell mixture distribution. BMC Bioinformatics. 2012; 13:86. https://doi.org/10.1186/1471-2105-13-86 [PubMed]
- 57. Phipson B, Maksimovic J, Oshlack A. missMethyl: an R package for analyzing data from Illumina's HumanMethylation450 platform. Bioinformatics. 2016; 32:286–8. https://doi.org/10.1093/bioinformatics/btv560 [PubMed]
- 58. Kanehisa M, Goto S. KEGG: kyoto encyclopedia of genes and genomes. Nucleic Acids Res. 2000; 28:27–30. https://doi.org/10.1093/nar/28.1.27 [PubMed]