Analysis of the mutated genes in GC tumor samples and cfDNA
Among the 56 stage IV GC patients, genetic mutations were observed in both tumor DNA and cfDNA in 54 (96.4%) patients. Two patients had no genetic mutations detected in either tumor DNA or cfDNA.
We analyzed the genetic mutation according to the metastatic sites. As shown in Figure 1A, for patients with peritoneal metastasis, the most commonly mutated gene was KMT2D (45%), followed by TP53 (42%), KMT2C (42%), ARID1A (39%), MACF1 (27%), LRP1B (24%), FAT4 (21%), CDH1 (21%), APC (18%), and ABCA10 (18%). In Figure 1B, for patients with hematogenous metastasis, the most commonly mutated genes were LRP1B (67%) and KMT2C (67%), followed by TP53 (33%), PREX2 (33%), MACF1 (33%), KRAS (33%), KMT2D (33%), FAT4 (33%), CTNNB1 (33%), CREBBP (33%), CDH1 (33%), BNC2 (33%), BCOR (33%), and ARID1A (33%). In Figure 1C, for patients with distant lymphatic metastasis, the most commonly mutated gene was TP53 (46%), followed by FAT4 (38%), ARID1A (38%), KMT2C (35%), PLB1 (31%), MACF1 (23%), LRP1B (23%), MUC6 (23%), CREBBP (15%), CDH1 (15%), BCOR (15%), ERBB3 (15%), and BNC2 (15%). The most common mutated spot in both peritoneal and distant lymphatic metastases was KMT2C c.8390delA.
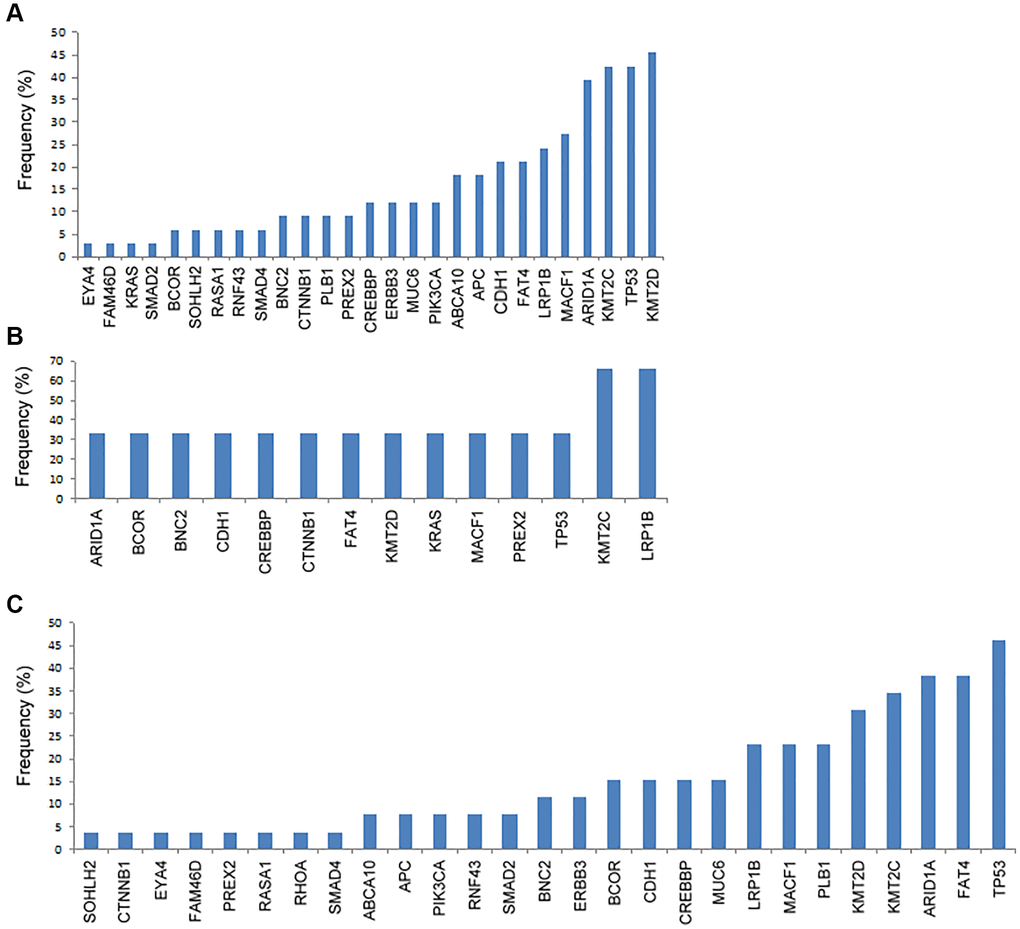
Figure 1. The frequency of genetic mutations according to the metastatic patterns. (A) Peritoneal metastasis, (B) hematogenous metastasis, and (C) distant lymphatic metastasis.
We further analyzed the immunohistochemical (IHC) stain for some common mutated genes in the tumor samples, including CDH1, MACF1, TP53, PLB1, ARID1A, KMT2C, FAT4, and KMT2D. As shown in Figure 2 and Table 2, tumors with CDH1 mutations were associated with significantly more negative expression of the correlated E-cadherin protein (P = 0.021), which was also observed in tumors with mutations in MACF1 (P < 0.001), TP53 (P < 0.001), PLB1 (P < 0.001), ARID1A (P < 0.001), KMT2C (P < 0.001), FAT4 (P < 0.001), and KMT2D (P < 0.001).
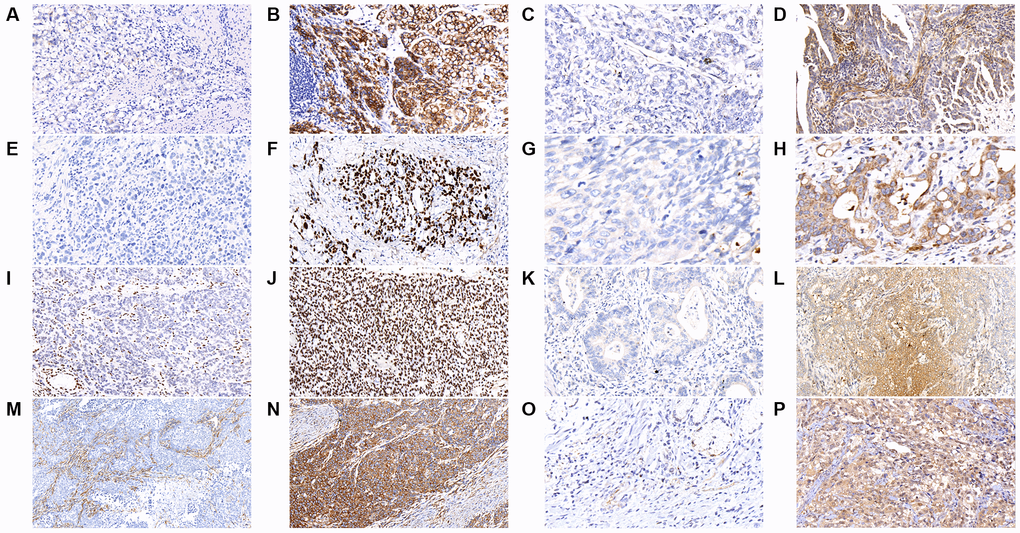
Figure 2. The results of immunohistochemical staining in gastric cancer tumor samples are shown as follows in the figures. (A) E-cadherin-negative (B) E-cadherin-positive (C) MACF1-negative (D) MACF1-positive (E) p53-negative (F) p53-positive (G) PLB1-negative (H) PLB1-positive (I) ARID1A-negative (J) ARID1A-positive (K) KMT2C-negative (L) KMT2C-positive (M) FAT4-negative (N) FAT4-positive (O) KMT2D-negative (P) KMT2D-positive. (x400).
Table 2. The correlation between the expression of IHC stain and genetic mutation.
| IHC stain | Genetic mutation | P value |
| No n (%) | Yes n (%) |
| E-cadherin (CDH1) | | | 0.021 |
| Negative | 0 | 1 (11.1) | |
| Positive | 47 (100) | 8 (88.9) | |
| MACF1 | | | <0.001 |
| Negative | 0 | 7 (58.3) | |
| Positive | 44 (100) | 5 (41.7) | |
| P53 | | | <0.001 |
| Negative | 3 (8.8) | 14 (63.6) | |
| Positive | 31 (91.2) | 8 (36.4) | |
| PLB1 | | | <0.001 |
| Negative | 1 (2.1) | 8 (100) | |
| Positive | 47 (97.9) | 0 | |
| ARID1A | | | <0.001 |
| Negative | 1 (2.8) | 12 (60.0) | |
| Positive | 35 (97.2) | 8 (40.0) | |
| KMT2C | | | <0.001 |
| Negative | 1 (2.4) | 11 (73.3) | |
| Positive | 40 (97.6) | 4 (26.7) | |
| FAT4 | | | <0.001 |
| Negative | 2 (4.7) | 6 (46.2) | |
| Positive | 41 (95.3) | 7 (53.8) | |
| KMT2D | | | <0.001 |
| Negative | 0 | 8 (44.4) | |
| Positive | 38 (100) | 10 (55.6) | |
| Abbreviation: IHC: immunohistochemical. |
As shown in Figure 3, the most commonly mutated gene in cfDNA was MACF1 (19.3%), followed by KMT2D (17.0%), FAT4 (13.6%), KMT2C (13.6%), LRP1B (12.5%) and PLB1 (11.4%). The median number of mutated genes in the 56 GC cfDNA samples was 1 (range 0–5). Among them, twenty-six (46.4%) patients had more than one mutated gene.
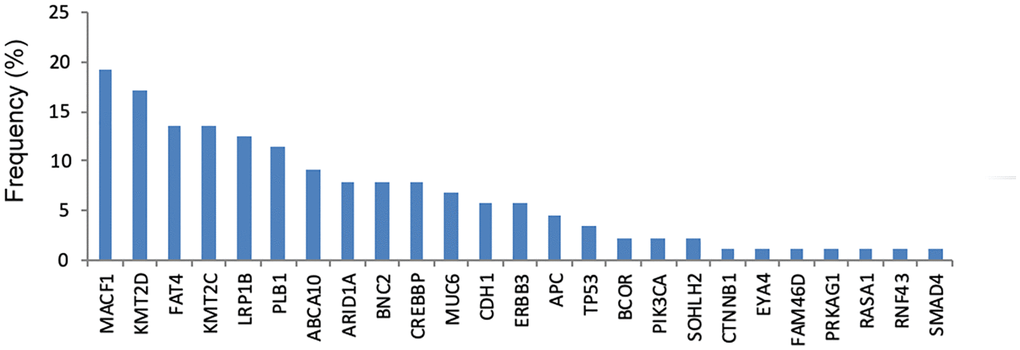
Figure 3. The frequency of genetic mutations in cfDNA.
As shown in Figure 4A, the frequency of genetic mutations (at least one gene mutation) in tumor DNA was highest in patients with hematogenous metastasis (100%), followed by peritoneal metastasis (97%) and distant lymphatic metastasis (96.2%). In Figure 4B, the frequency of genetic mutation in cfDNA was highest in patients with distant lymphatic metastasis (100%), followed by peritoneal metastasis (87.5%) and hematogenous metastasis (66.7%).
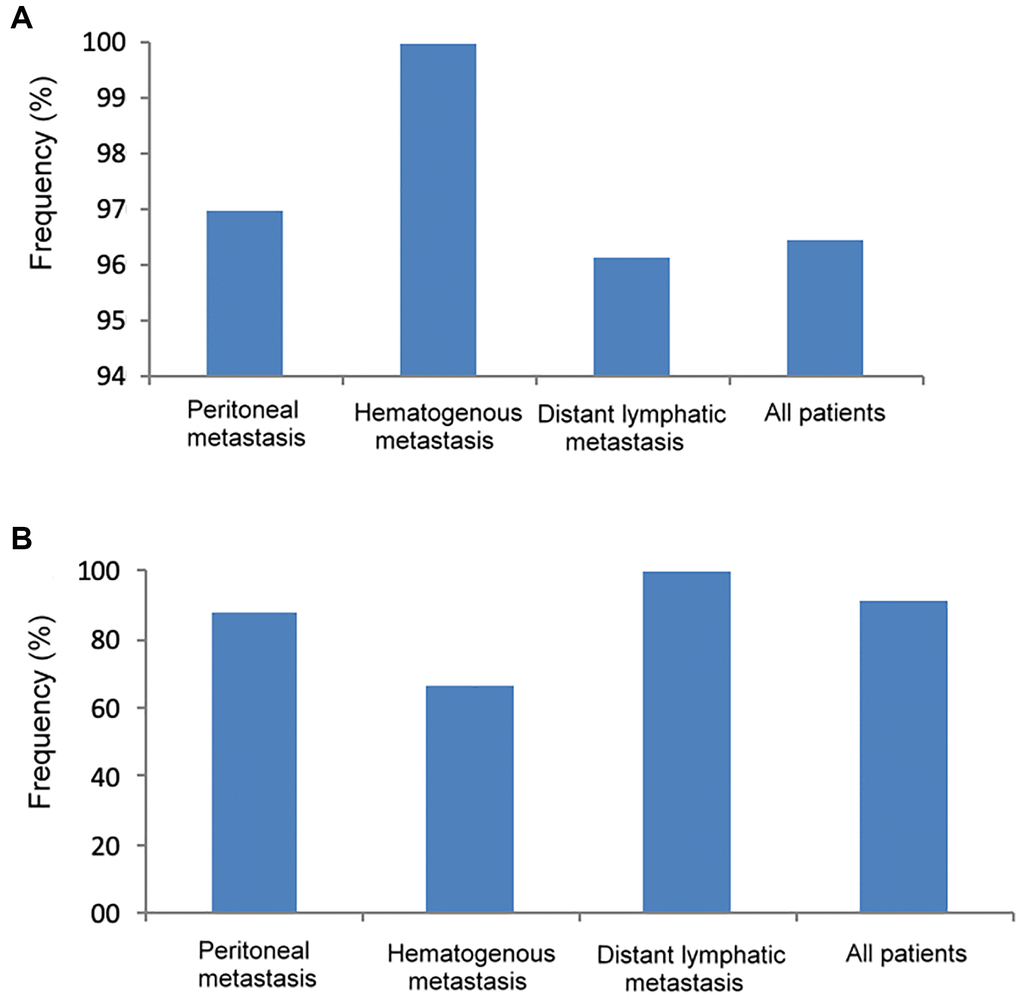
Figure 4. The frequency of genetic mutations in tumor DNA and cfDNA according to different metastatic patterns. (A) Tumor DNA, (B) cfDNA.
As shown in Table 3, comparing patients with peritoneal metastasis alone and distant lymphatic metastasis alone, there was no significant difference in the frequency of any of the genetic mutations between these two metastatic patterns in tumor DNA; however, in cfDNA, the frequency of PLB1 mutations was significantly higher in patients with distant lymphatic metastasis than in those with peritoneal metastasis (23.8% vs. 3.7%, P = 0.037).
Table 3. The correlation of tumor DNA mutation, cfDNA mutation, single peritoneal metastasis and single distant lymphatic metastasis.
| Genetic mutation | Tumor DNA | cfDNA |
| Peritoneum n = 27 n (%) | Distant LM n = 21 n (%) | P value | Peritoneum n = 27 n (%) | Distant LM n = 21 n (%) | P value |
| CREBBP | 2 (7.4) | 2 (9.5) | 0.792 | 1 (3.7) | 1 (4.8) | 0.856 |
| TP53 | 11 (40.7) | 8 (38.1) | 0.853 | 3 (11.1) | 0 | 0.115 |
| ARID1A | 11 (40.7) | 7 (33.3) | 0.599 | 4 (14.8) | 3 (14.3) | 0.959 |
| BCOR | 1 (3.7) | 4 (19.0) | 0.084 | 0 | 1 (4.8) | 0.252 |
| CTNNB1 | 1 (3.7) | 0 | 0.373 | 0 | 0 | |
| KMT2D | 10 (37.0) | 6 (28.6) | 0.537 | 8 (29.6) | 2 (9.5) | 0.089 |
| RNF43 | 1 (3.7) | 1 (4.8) | 0.856 | 0 | 0 | |
| APC | 3 (11.1) | 0 | 0.115 | 2 (7.4) | 0 | 0.203 |
| FAT4 | 3 (11.1) | 7 (33.3) | 0.060 | 2 (7.4) | 6 (28.6) | 0.051 |
| KMT2C | 8 (29.6) | 6 (28.6) | 0.936 | 4 (14.8) | 2 (9.5) | 0.582 |
| ABCA10 | 5 (18.5) | 2 (9.5) | 0.381 | 5 (18.5) | 2 (9.5) | 0.381 |
| MUC6 | 2 (7.4) | 2 (9.5) | 0.792 | 1 (3.7) | 2 (9.5) | 0.409 |
| KRAS | 0 | 0 | | 0 | 0 | |
| SMAD4 | 1 (3.7) | 0 | 0.373 | 1 (3.7) | 0 | 0.373 |
| PIK3CA | 3 (11.1) | 1 (4.8) | 0.430 | 0 | 0 | |
| BNC2 | 2 (7.4) | 2 (9.5) | 0.792 | 1 (3.7) | 2 (9.5) | 0.409 |
| PLB1 | 3 (11.1) | 5 (23.8) | 0.242 | 1 (3.7) | 5 (23.8) | 0.037 |
| MACF1 | 7 (25.9) | 4 (19.0) | 0.574 | 5 (18.5) | 3 (14.3) | 0.696 |
| ERBB3 | 4 (14.8) | 3 (14.3) | 0.959 | 2 (7.4) | 2 (9.5) | 0.792 |
| CDH1 | 4 (14.8) | 2 (9.5) | 0.582 | 3 (11.1) | 2 (9.5) | 0.858 |
| RASA1 | 2 (7.4) | 1 (4.8) | 0.707 | 1 (3.7) | 0 | 0.373 |
| PREX2 | 2 (7.4) | 1 (4.8) | 0.707 | 0 | 0 | |
| EYA4 | 1 (3.7) | 1 (4.8) | 0.856 | 1 (3.7) | 0 | 0.373 |
| LRP18 | 6 (22.2) | 5 (23.8) | 0.897 | 3 (11.1) | 4 (19.0) | 0.440 |
| FAM46D | 1 (3.7) | 1 (4.8) | 0.856 | 0 | 1 (4.8) | 0.252 |
| SMAD2 | 1 (3.7) | 2 (9.5) | 0.409 | 0 | 0 | |
| RHOA | 0 | 1 (4.8) | 0.252 | 0 | 0 | |
| SOHLH2 | 2 (7.4) | 1 (4.8) | 0.707 | 1 (3.7) | 1 (4.8) | 0.856 |
| CNGA4 | 0 | 0 | | 0 | 0 | |
| Abbreviations: cfDNA: cell-free DNA; LM: lymphatic metastasis. |
The specificity of all genetic mutations in cfDNA was 100% in predicting mutations in tumor DNA. As shown in Table 4, the sensitivity of the top nine mutated genes in tumor DNA and cfDNA was compared. Using the mutation pattern of cfDNA in the prediction of mutations in tumor DNA, the sensitivity was the highest in FAT4 (88.9%), followed by MACF1 (80%), CDH1 (75%), PLB1 (75%), KMT2D (72.7%), LRP1B (71.4%), KMT2C (40%), ARID1A (25%), and TP53 (13.6%).
Table 4. Sensitivity and specificity of nine top mutated genes between tumor DNA and cfDNA of stage IV GC patients.
| TP53 | ARID1A | KMT2C | KMT2D | FAT4 | LRP1B | MACF1 | CDH1 | PLB1 |
| Tumor DNA mutation | Tumor DNA mutation | Tumor DNA mutation | Tumor DNA mutation | Tumor DNA mutation | Tumor DNA mutation | Tumor DNA mutation | Tumor DNA mutation | Tumor DNA mutation |
| Yes | No | Yes | Yes | Yes | No | Yes | No | Yes | No | Yes | No | Yes | No | Yes | No | Yes | No |
| cfDNA mutation |
| Yes | 3 | 0 | 5 | 0 | 6 | 0 | 8 | 0 | 8 | 0 | 5 | 0 | 4 | 0 | 3 | 0 | 3 | 0 |
| No | 19 | 34 | 15 | 36 | 9 | 41 | 3 | 45 | 1 | 47 | 2 | 49 | 1 | 51 | 1 | 52 | 1 | 52 |
| Sensitivity | 13.6% | 25% | 40% | 72.7% | 88.9% | 71.4% | 80% | 75% | 75% |
| Specificity | 100% | 100% | 100% | 100% | 100% | 100% | 100% | 100% | 100% |
| Abbreviations: cfDNA: cell-free DNA; GC: gastric cancer. |
The mutation patterns of tumor DNA and cfDNA in patients with more than one metastatic pattern
Among the 56 stage IV GC patients, one patient had both peritoneal and hematogenous metastases. The patient had ten mutated genes in the tumor DNA and a total of 60 mutated spots, and only one mutated gene, MACF1, was detected in both tumor DNA and cfDNA.
Among the 56 stage IV GC patients, five patients had both peritoneal and distant lymphatic metastases. All of them had at least two mutated genes in tumor DNA and at least one mutated gene in cfDNA. Regarding tumor DNA, there were two mutated genes in one patient (CDH1 and MUC6), five mutated genes in two patients (including BNC2, FAT4, APC, TP53, CREBBP), and ten mutated genes in two patients (CDH1, PIK3CA, SMAD4, MUC6, FAT4, APC, RNF43, KMT2D, CTNNB1, ARID1A). Regarding cfDNA, three patients had one mutated gene (including MUC6 mutation in one patient and FAT4 mutation in two patients), and two patients had two mutated genes (one patient with BNC2 and CREBBP mutations; another patient with RNF43 and APC mutations).
We further compared the number of mutated genes and mutated spots between single-site and multiple-site metastases in tumor DNA and cfDNA. Regarding tumor DNA, the number of mutated genes (3.5 ± 2.3 vs. 4.7 ± 2.9, P = 0.273) was not significantly different between single-site and multiple-site metastases, while patients with multiple-site metastases had significantly more mutated spots than patients with single-site metastases (23.7 ± 18.6 vs. 9.6 ± 8.6, P = 0.002). Regarding cfDNA, the number of mutated genes (1.8 ± 1.4 vs. 1.3 ± 0.5, P = 0.432) and mutated spots (5.0 ± 4.2 vs. 6.2 ± 2.3, P = 0.491) were not significantly different between single-site and multiple-site metastases.