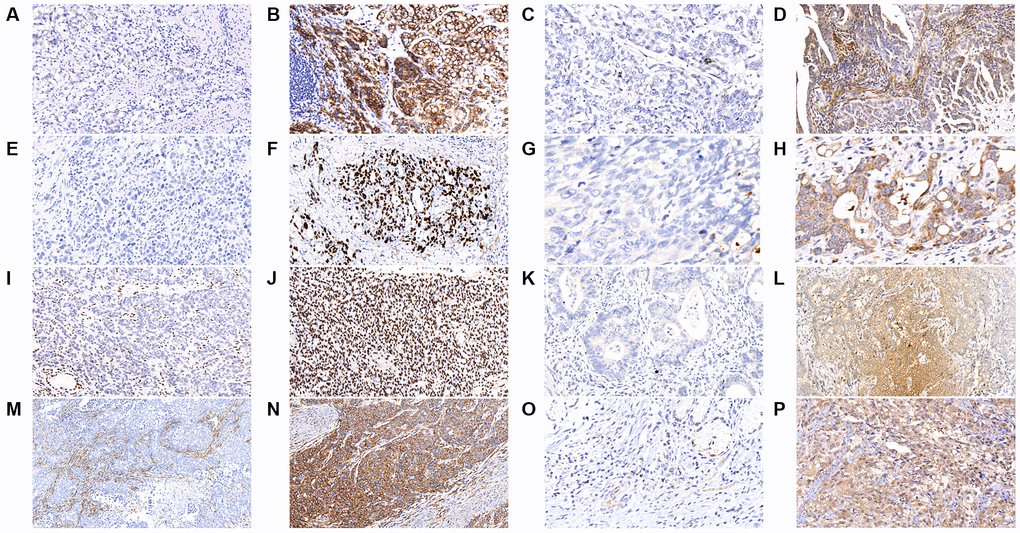
Figure 2.The results of immunohistochemical staining in gastric cancer tumor samples are shown as follows in the figures. (A) E-cadherin-negative (B) E-cadherin-positive (C) MACF1-negative (D) MACF1-positive (E) p53-negative (F) p53-positive (G) PLB1-negative (H) PLB1-positive (I) ARID1A-negative (J) ARID1A-positive (K) KMT2C-negative (L) KMT2C-positive (M) FAT4-negative (N) FAT4-positive (O) KMT2D-negative (P) KMT2D-positive. (x400).