


Introduction
Acute myocardial infarction (AMI) has become the main cause of hospitalization and death worldwide, seriously threatening human health. Previous studies have suggested that AMI is a complex syndrome with multifactorial disorders. Its risk factors include early family history, smoking, hypertension, dyslipidemia, and diabetes [1–4]. The rupture of vulnerable and lipid-overloaded coronary atherosclerotic plaques can induce the formation of acute thrombus, leading to acute occlusion of blood vessels and progressing to AMI [5]. Dyslipidemia, especially elevated levels of low-density lipoprotein (LDL) cholesterol, is believed to play a key role in the pathogenesis of atherosclerosis [6, 7]. Atherogenesis begins when residues of LDL cholesterol, chylomicron, and very low-density lipoprotein (VLDL) cholesterol molecules enter the artery intima. Then, lipid radicals are oxidized and endocytosed by macrophages, followed by the formation of foam cells [6]. Previous studies have demonstrated that every 1% reduction in LDL cholesterol levels is associated with a 1% reduction in AMI risk [8, 9]. Currently, statin therapy has become the cornerstone for cholesterol-lowering drug therapy for coronary heart disease and AMI patients. Moreover, the combination of PCSK9 inhibitors with statins is recommended to reduce the risk of major adverse cardiovascular events (MACEs) in AMI patients [10]. However, the combination of lipid-lowering therapy still cannot eliminate the risk of MACEs in AMI patients. This might be partly because some lipid-related genes have not been identified. Therefore, identifying new lipid metabolism-related genes associated with AMI will help develop new lipid-lowering drugs to reduce the risk of MACEs in AMI patients.
Microarray analysis is an innovative and practical method to discern susceptibility genes to deal with coronary heart disease [11] and AMI [12]. Nevertheless, microarray analysis using differentially expressed genes (DEGs) might have limitations in reproducibility and sensitivity [13, 14]. Machine learning can enhance the prediction and accuracy of these key genes discerned using traditional microarrays or next-generation sequencing data [15]. The most frequently used machine learning techniques include the least absolute shrinkage and selection operator (LASSO) regression and support vector machine recursive feature elimination (SVM-RFE) algorithm [16]. Meanwhile, the combined application of LASSO regression and SVM-RFE algorithm in identifying new lipid-related genes involved in AMI has not been conducted. Therefore, in the present study, we analyzed the GSE66360 dataset from different perspectives: 1) DEGs among lipid-related AMI genes were identified using the “limma” R package and GO and KEGG pathway enrichment analyses. 2) Machine learning methods were applied to large-scale screening and diagnostic identification of AMI-related molecular markers. 3) Lipid-related gene expression levels screened by machine learning were validated using clinical cases.
Results
Identification of lipid-related DEGs in GSE66360
Due to the limitations of chip detection technology, a total of 673 lipid-related genes in 49 AMI samples and 50 normal samples were used to analyze DEGs. After data normalization and removal of batch differences, 50 lipid-related genes were identified, 28 upregulated and 22 downregulated (Table 1). These 50 lipid-related DEGs can be visualized in the volcano plot and heatmap (Figure 1A, 1B). The expression pattern between the two groups was highlighted based on the box plot (Figure 2). Among them, the top three upregulated genes were ACSSL1 (Acyl-CoA Synthetase Long-Chain Family Member 1), PLBD1 (Phospholipase B Domain Containing 1), and CH25H (Cholesterol 25-Hydroxylase). Meanwhile, the top three downregulated genes were ELOVL4 (ELOVL Fatty Acid Elongase 4), TNFAIP8L2 (TNF Alpha Induced Protein 8 Like 2), and CYP2E1 (Cytochrome P450 Family 2 Subfamily E Member 1).
Table 1. The 50 differentially expressed lipid-related genes in AMI samples compared to healthy samples.
| Gene symbol | Log2FC | Changes | p-value | Adjusted p-value |
| ACSL1 | 2.1443758 | Up | 9.76E-14 | 6.57E-11 |
| PLBD1 | 2.0855158 | Up | 1.33E-08 | 1.49E-06 |
| CH25H | 1.561894 | Up | 1.67E-10 | 5.63E-08 |
| PTGS2 | 1.4727308 | Up | 1.64E-04 | 2.56E-03 |
| CYP4F3 | 1.4307856 | Up | 2.77E-07 | 1.35E-05 |
| CD36 | 1.3377248 | Up | 1.25E-08 | 1.49E-06 |
| G0S2 | 1.3051173 | Up | 7.36E-06 | 2.06E-04 |
| LPCAT2 | 1.274232 | Up | 1.13E-07 | 6.95E-06 |
| CYP1B1 | 1.081695 | Up | 2.57E-07 | 1.35E-05 |
| MBOAT2 | 0.996586 | Up | 9.09E-08 | 6.80E-06 |
| DGAT2 | 0.9506635 | Up | 4.65E-07 | 2.09E-05 |
| GPCPD1 | 0.9145163 | Up | 2.38E-05 | 5.52E-04 |
| ABCA1 | 0.8308084 | Up | 3.50E-08 | 2.94E-06 |
| BMX | 0.8267136 | Up | 9.28E-07 | 3.90E-05 |
| PTGS1 | 0.8263128 | Up | 8.69E-05 | 1.46E-03 |
| MBOAT7 | 0.8240098 | Up | 3.66E-06 | 1.29E-04 |
| SGMS2 | 0.8165743 | Up | 5.71E-04 | 6.86E-03 |
| ABHD5 | 0.7901841 | Up | 1.44E-09 | 3.23E-07 |
| GK3P | 0.7584331 | Up | 1.02E-04 | 1.68E-03 |
| ALOX12 | 0.7568656 | Up | 4.36E-03 | 3.45E-02 |
| TNFRSF21 | 0.7529465 | Up | 2.53E-03 | 2.27E-02 |
| TBXAS1 | 0.7461727 | Up | 3.82E-05 | 7.34E-04 |
| CYP27A1 | 0.6990032 | Up | 2.48E-06 | 9.27E-05 |
| STARD4 | 0.6983926 | Up | 3.56E-03 | 2.89E-02 |
| ASAH1 | 0.6750605 | Up | 4.30E-05 | 7.82E-04 |
| CYP4F2 | 0.6721891 | Up | 4.74E-06 | 1.59E-04 |
| GK | 0.6464259 | Up | 2.46E-04 | 3.52E-03 |
| ALOX5AP | 0.6346144 | Up | 1.04E-03 | 1.13E-02 |
| SLC44A3 | −0.590564 | Down | 1.18E-03 | 1.20E-02 |
| CEPT1 | −0.599105 | Down | 1.17E-03 | 1.20E-02 |
| MCEE | −0.609681 | Down | 2.24E-03 | 2.12E-02 |
| PLA2G12A | −0.612271 | Down | 6.79E-06 | 1.99E-04 |
| PNPLA4 | −0.612941 | Down | 2.48E-03 | 2.27E-02 |
| NFYB | −0.623073 | Down | 2.92E-04 | 4.09E-03 |
| CROT | −0.628778 | Down | 2.87E-05 | 6.43E-04 |
| GGPS1 | −0.647568 | Down | 3.19E-05 | 6.58E-04 |
| ARV1 | −0.654258 | Down | 3.44E-05 | 6.81E-04 |
| INSIG2 | −0.663348 | Down | 6.01E-03 | 4.40E-02 |
| THEM4 | −0.748033 | Down | 2.99E-05 | 6.49E-04 |
| PHYH | −0.755787 | Down | 2.36E-03 | 2.21E-02 |
| PIK3C2B | −0.764005 | Down | 4.21E-04 | 5.45E-03 |
| PTPN13 | −0.771322 | Down | 3.25E-04 | 4.47E-03 |
| AGPAT5 | −0.799176 | Down | 8.56E-05 | 1.46E-03 |
| ORMDL2 | −0.803203 | Down | 1.43E-03 | 1.44E-02 |
| GDPD3 | −0.810763 | Down | 4.53E-04 | 5.75E-03 |
| LCLAT1 | −0.828645 | Down | 7.23E-04 | 8.25E-03 |
| HSD11B1 | −0.973808 | Down | 1.14E-07 | 6.95E-06 |
| CYP2E1 | −1.067542 | Down | 5.45E-06 | 1.75E-04 |
| TNFAIP8L2 | −1.222639 | Down | 8.47E-06 | 2.19E-04 |
| ELOVL4 | −1.35438 | Down | 2.82E-07 | 1.35E-05 |
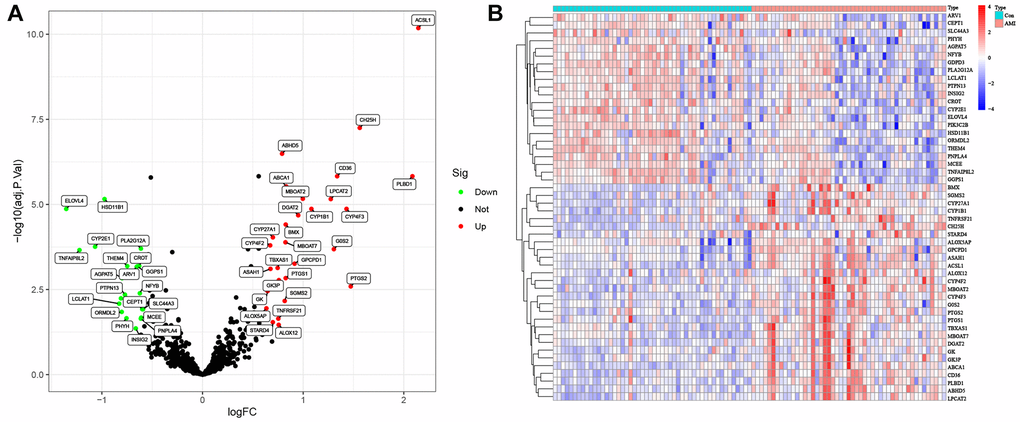
Figure 1. Lipid-related differentially expressed genes (DEGs) in AMI and healthy samples. (A) Volcano plot of the 673 lipid-related DEGs. Red dots represent significantly upregulated genes, and green significantly downregulated genes. (B) Heatmap of the 50 lipid-related DEGs in AMI and healthy samples.
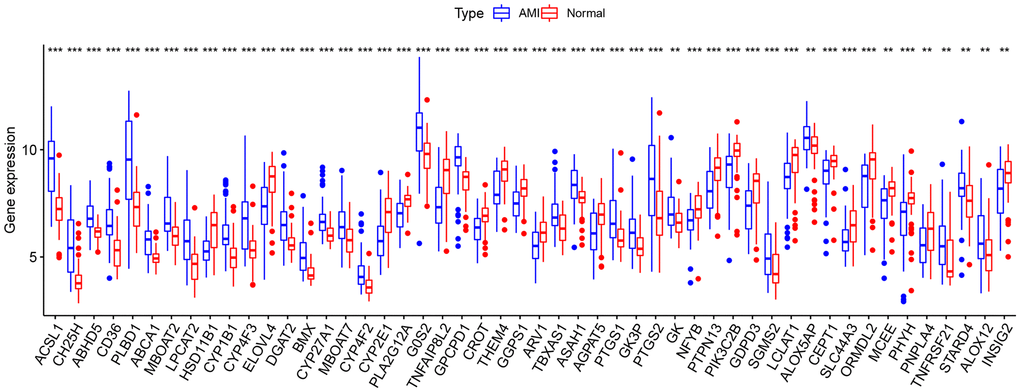
Figure 2. Box plot of 50 lipid-related differentially expressed genes (DEGs) in AMI and healthy samples. *p < 0.05; **p < 0.01; ***p < 0.005.
Correlation analysis of lipid-related DEGs
The 50 lipid-related DEGs in the GSE66360 were significantly correlated by the Pearson correlation analysis (Figure 3). The positive correlation between the PLBD1 and ACSL1 was strongest; and the CYP4F2 had the most obvious negative correlation with PTPN13. Moreover, the ACSL1 was positively related to GPCPD1 and CH25H; the CH25H was positively related to GPCPD1 and ACSL1; the PLA2G12A was positively related to GPCPD1 while negatively related to CH25H.
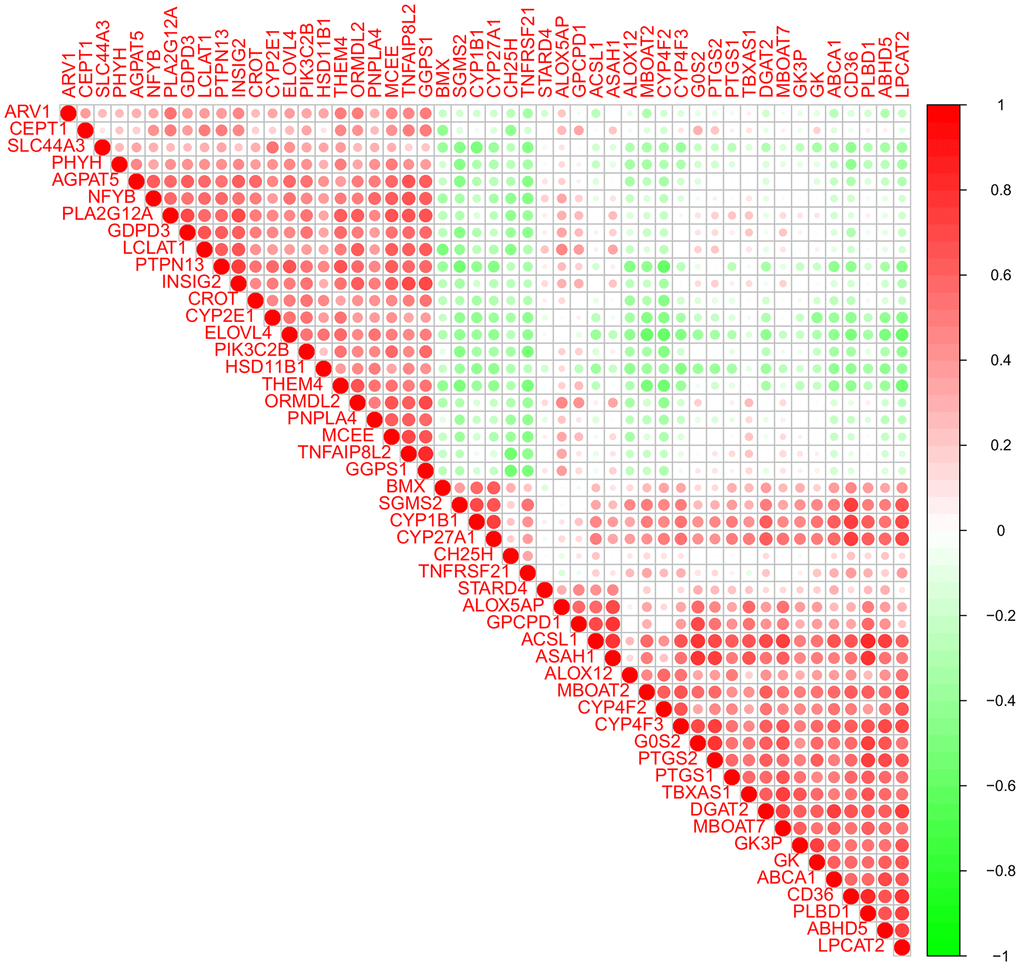
Figure 3. Pearson correlation analysis of the 50 lipid-related differentially expressed genes (DEGs).
Functional analyses of lipid-related DEGs
The biological functions of lipid-related DEGs were determined by GO and KEGG enrichment analyses using R software. The most enriched GO terms were fatty acid metabolic, glycerolipid metabolic, and phospholipid metabolic processes (biological processes, Figure 4A); intrinsic component of endoplasmic reticulum membrane, integral component of endoplasmic reticulum membrane, and lipid droplet (cellular components, Figure 4B); oxidoreductase activity, iron ion binding, and acyltransferase activity (molecular functions, Figure 4C). The KEGG enrichment analyses showed that lipid-related DEGs were involved in the arachidonic acid metabolism, glycerophospholipid metabolism, chemical carcinogenesis-DNA adducts, and the PPAR signaling pathway (Figure 5). The details of these analyses can also be found in Supplementary Table 1.
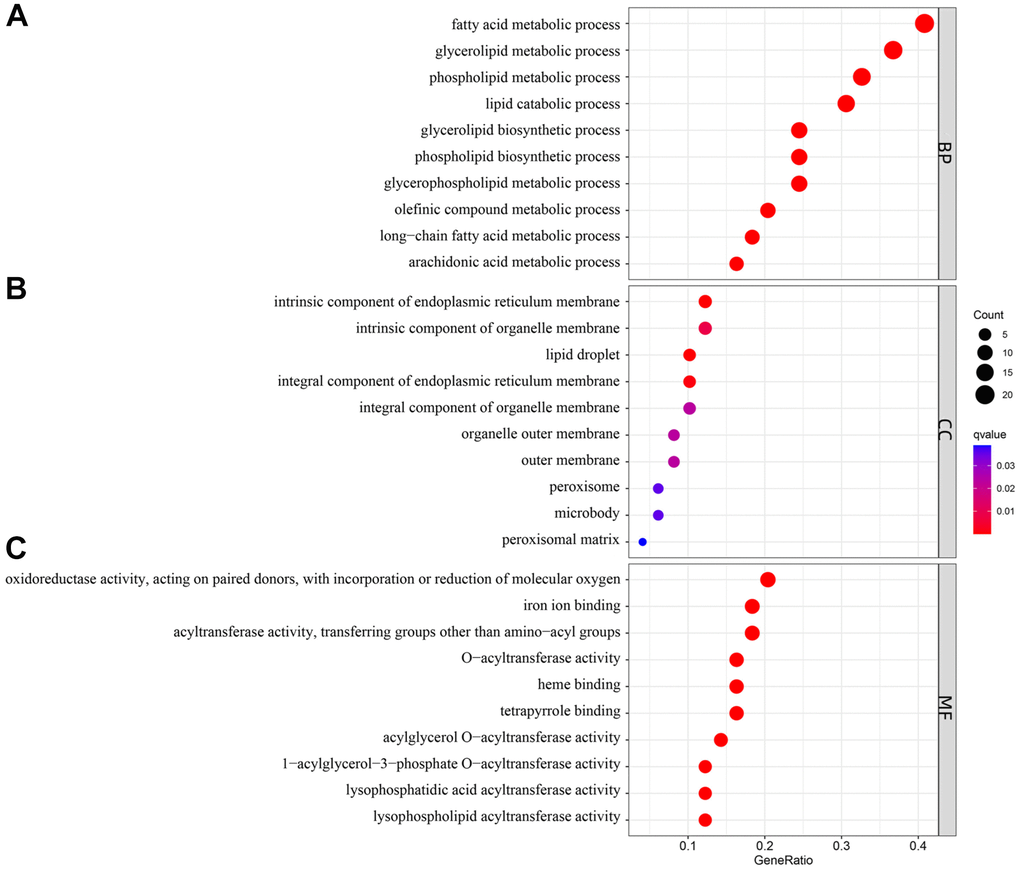
Figure 4. Gene Ontology (GO) enrichment analysis of 50 differentially expressed genes (DEGs). Abbreviations: (A) BP: biological process; (B) CC: cellular component; (C) MF: molecular function.
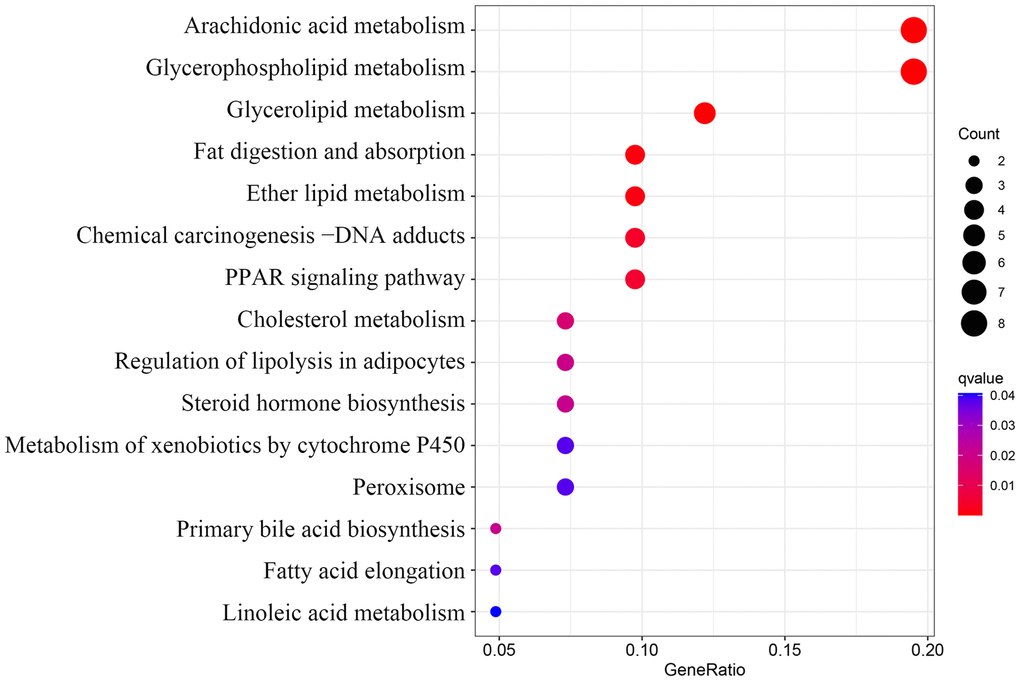
Figure 5. Kyoto Encyclopedia of Genes and Genomes (KEGG) pathway analysis of 50 lipid-related differentially expressed genes (DEGs).
Screening key DEGs by LASSO logistic regression and SVM-RFE
The LASSO logistic regression identified 15 lipid-related genes based on the optimum λ value (Figure 6A), whereas the SVM-RFE algorithm identified four genes (Figure 6B). Four overlap genes including ACSL1, CH25H, GPCPD1 (Glycerophosphocholine Phosphodiesterase 1), and PLA2G12A (Phospholipase A2 Group XIIA) were identified by LASSO and SVM-RFE algorithm as key lipid-related DEGs for subsequent analysis (Figure 6C). In addition, other 14 genes identified by LASSO regression are listed in Supplementary Table 2.
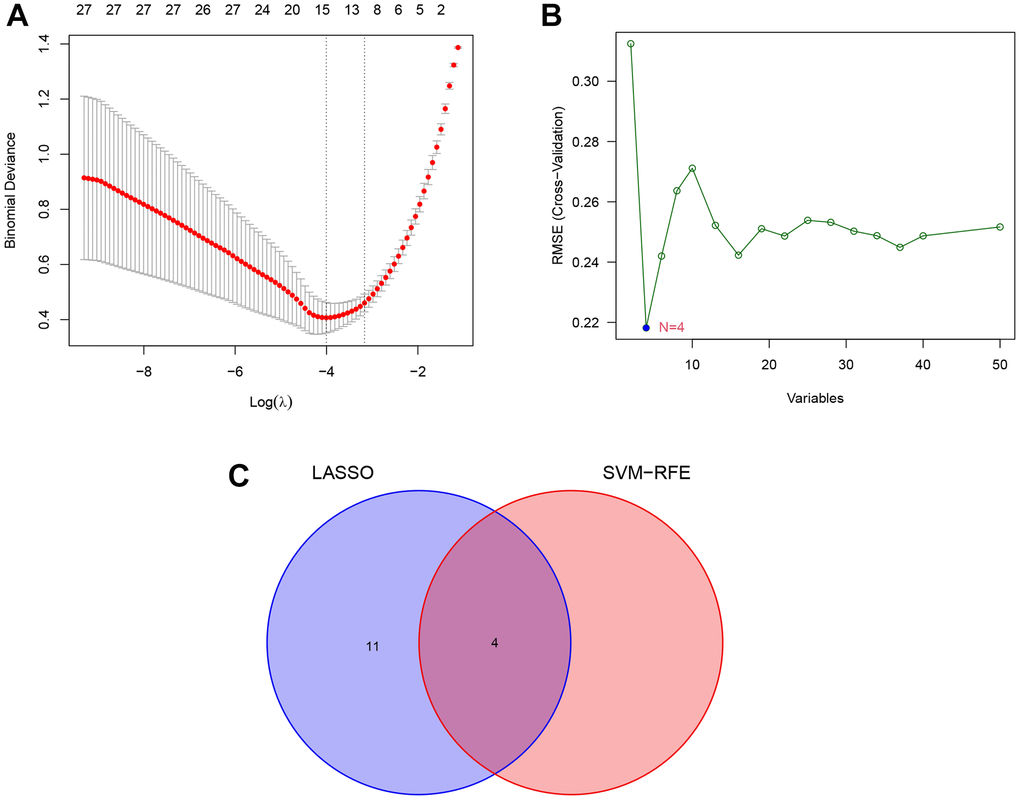
Figure 6. Identification of key lipid-related DEGs by machine learning methods. (A) Least absolute shrinkage and selection operator (LASSO) logistic regression screening of key lipid-related DEGs. (B) Support vector machine-recursive feature elimination (SVM-RFE) algorithm screening of key lipid-related DEGs. (C) Venn diagram of the intersection of diagnostic markers obtained by the two algorithms.
ROC curves between AMI and control groups
The expression of the four lipid-related DEGs between the AMI and control samples of the GSE66360 dataset were analyzed using R software, and the ROC curves were constructed. The area under the curve (AUC), unified with specificity and sensitivity, verified the intrinsic validity of diagnostic tests [17]. Four lipid-related DEGs had a superior diagnostic value for AMI. Among them, the gene with the most significant diagnostic value was ACSL1 (AUC = 0.878). The other genes are: CH25H (AUC = 0.853), GPCPD1 (AUC = 0.819), and PLA2G12A (AUC = 0.747) (Figure 7). These four lipid-related DEGs can be considered underlying diagnostic biomarkers for AMI.
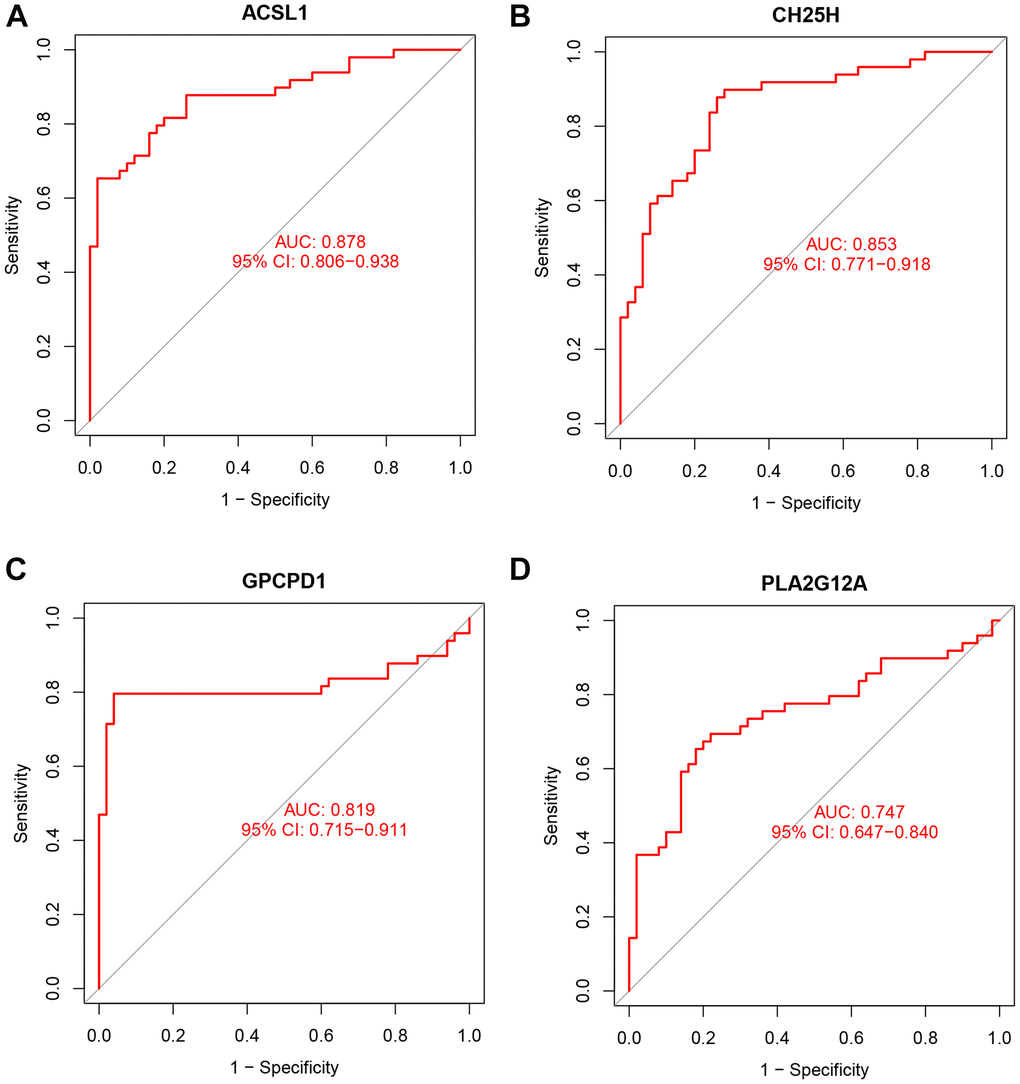
Figure 7. ROC curve analysis. ROC curve of ACSL1 (A), CH25H (B), GPCPD1 (C), PLA2G12A (D) in GSE66360 dataset.
Validation by RT-qPCR
To verify the dependability of the GSE66360 dataset, RT-qPCR was used to validate the expression levels of the above four lipid-related genes in clinical samples. The clinical data of AMI and control groups are summarized in Table 2. The RT-qPCR results suggested in Figure 8, that the expression level of PLA2G12A (p = 2.8e-08) increased in controls compared to the AMI group, while ACSL1 (p = 2.4e-09), CH25H (p = 0.023), and GPCPD1 (p = 1.3e-08) were higher in AMI group. Hence, the RT-qPCR results performed were consistent with the main bioinformatic analysis.
Table 2. Clinical characteristic between control and AMI group.
| Characteristic | Control (n = 50) | AMI (n = 50) | p | ||||||||||||||||||||||||||||||||||||||||||||||||||||||||||||||||||||||||||||||||||||||||||||||||
| Male [n (%)]a | 35 (70.0) | 34 (68.0) | 0.829 | ||||||||||||||||||||||||||||||||||||||||||||||||||||||||||||||||||||||||||||||||||||||||||||||||
| Age (years)a | 55.16 ± 7.22 | 56.52 ± 6.79 | 0.673 | ||||||||||||||||||||||||||||||||||||||||||||||||||||||||||||||||||||||||||||||||||||||||||||||||
| BMI (kg/m²)a | 20.98 ± 2.74 | 23.69 ± 3.20 | 0.305 | ||||||||||||||||||||||||||||||||||||||||||||||||||||||||||||||||||||||||||||||||||||||||||||||||
| Smoking [n (%)]b | 11 (22.0) | 23 (46.0) | 0.011 | ||||||||||||||||||||||||||||||||||||||||||||||||||||||||||||||||||||||||||||||||||||||||||||||||
| Alcohol [n (%)]b | 13 (26.0) | 21 (42.0) | 0.091 | ||||||||||||||||||||||||||||||||||||||||||||||||||||||||||||||||||||||||||||||||||||||||||||||||
| Hypertension [n (%)]b | 15 (30.0) | 30 (60.0) | 0.003 | ||||||||||||||||||||||||||||||||||||||||||||||||||||||||||||||||||||||||||||||||||||||||||||||||
| Type 2 Diabetes [n (%)]b | 10 (20.0) | 19 (38.0) | 0.047 | ||||||||||||||||||||||||||||||||||||||||||||||||||||||||||||||||||||||||||||||||||||||||||||||||
| CK (U/L)a | 125.84 ± 9.35 | 1162.1 ± 576.30 | 6.20E-9 | ||||||||||||||||||||||||||||||||||||||||||||||||||||||||||||||||||||||||||||||||||||||||||||||||
| CK-MB (U/L)a | 15.5 ± 3.06 | 130.35 ± 19.76 | 1.14E-11 | ||||||||||||||||||||||||||||||||||||||||||||||||||||||||||||||||||||||||||||||||||||||||||||||||
| ApoA1 (g/L)a | 1.38 ± 0.30 | 0.96 ± 0.19 | 0.045 | ||||||||||||||||||||||||||||||||||||||||||||||||||||||||||||||||||||||||||||||||||||||||||||||||
| ApoB (g/L)a | 0.82 ± 0.19 | 1.01 ± 0.29 | 0.037 | ||||||||||||||||||||||||||||||||||||||||||||||||||||||||||||||||||||||||||||||||||||||||||||||||
| TC (mmol/L)a | 3.96 ± 0.80 | 4.12 ± 1.14 | 0.029 | ||||||||||||||||||||||||||||||||||||||||||||||||||||||||||||||||||||||||||||||||||||||||||||||||
| TG (mmol/L)a | 1.29 ± 0.41 | 1.50 ± 0.66 | 0.023 | ||||||||||||||||||||||||||||||||||||||||||||||||||||||||||||||||||||||||||||||||||||||||||||||||
| HDL-C (mmol/L)a | 1.63 ± 0.47 | 1.10 ± 0.29 | 0.030 | ||||||||||||||||||||||||||||||||||||||||||||||||||||||||||||||||||||||||||||||||||||||||||||||||
| LDL-C (mmol/L)a | 2.25 ± 0.94 | 3.57 ± 1.26 | 0.003 | ||||||||||||||||||||||||||||||||||||||||||||||||||||||||||||||||||||||||||||||||||||||||||||||||
| Creatinine (μmol/L)a | 86.14 ± 13.07 | 88.98 ± 17.49 | 0.039 | ||||||||||||||||||||||||||||||||||||||||||||||||||||||||||||||||||||||||||||||||||||||||||||||||
| Troponin T (μg/L)a | 0.04 ± 0.03 | 3.22 ± 1.19 | 2.87E-5 | ||||||||||||||||||||||||||||||||||||||||||||||||||||||||||||||||||||||||||||||||||||||||||||||||
| Abbreviations: BMI: Body mass index; HDL-C: high-density lipoprotein cholesterol; LDL-C: low-density lipoprotein cholesterol; Apo: Apolipoprotein; TC: Total cholesterol; TG: Triglyceride; CK: creatine kinase; CK-MB: creatine kinase-myocardial band. aMean ± SD determined by t-test. bThe rate or constituent ratio between the different groups was analyzed by the χ2 test. | |||||||||||||||||||||||||||||||||||||||||||||||||||||||||||||||||||||||||||||||||||||||||||||||||||
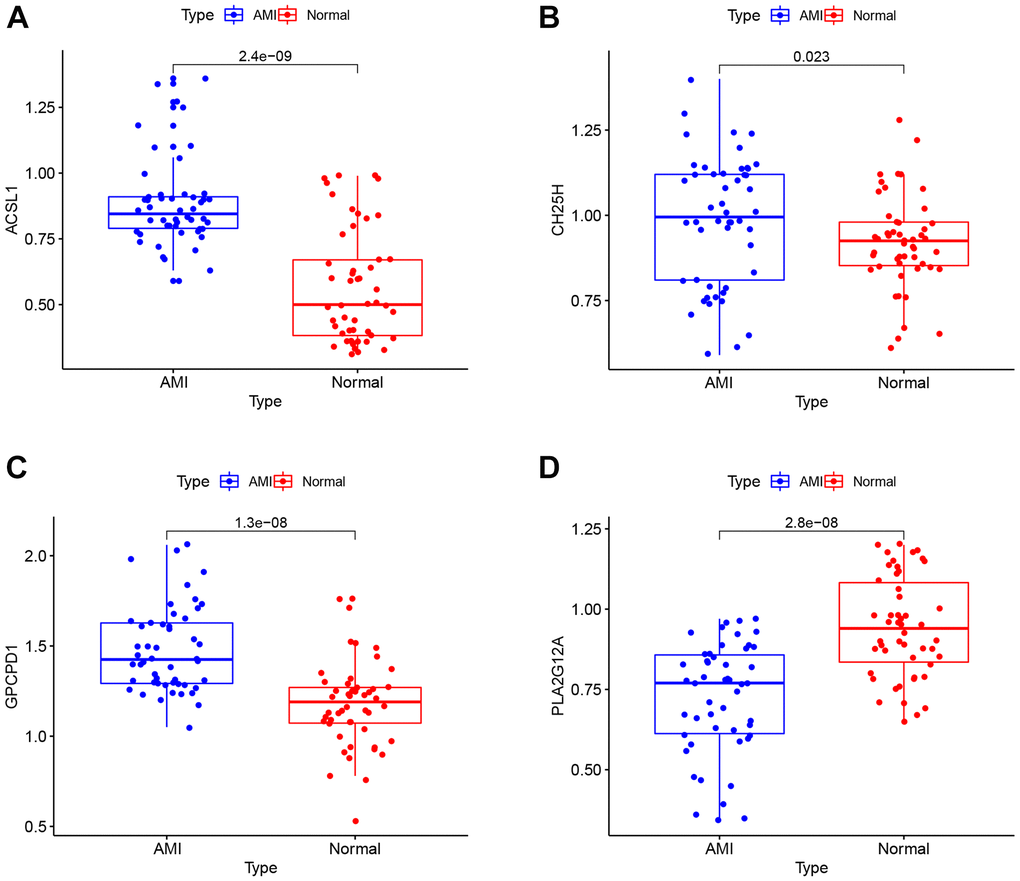
Figure 8. RT-qPCR analysis. The mRNA expression levels of ACSL1 (A), CH25H (B), GPCPD1 (C), PLA2G12A (D) in clinical samples.
Verification of the potential biomarkers for AMI
Furthermore, we analyzed the gene expression levels in the AMI group and healthy individuals using the ROC curve to verify the diagnostic value of the four screened lipid-related genes as shown in Figure 9. The AUC values of ACSL1, CH25H, GPCPD1 and PLA2G12A were 0.846 [95% confidence interval (CI): 0.764–0.929], 0.632 (95% CI: 0.517–0.747), 0.830 (95% CI: 0.749–0.912), and 0.822 (95% CI: 0.744–0.901), respectively. This result showed that these lipid-related DEGs are diagnostic biomarkers for AMI.
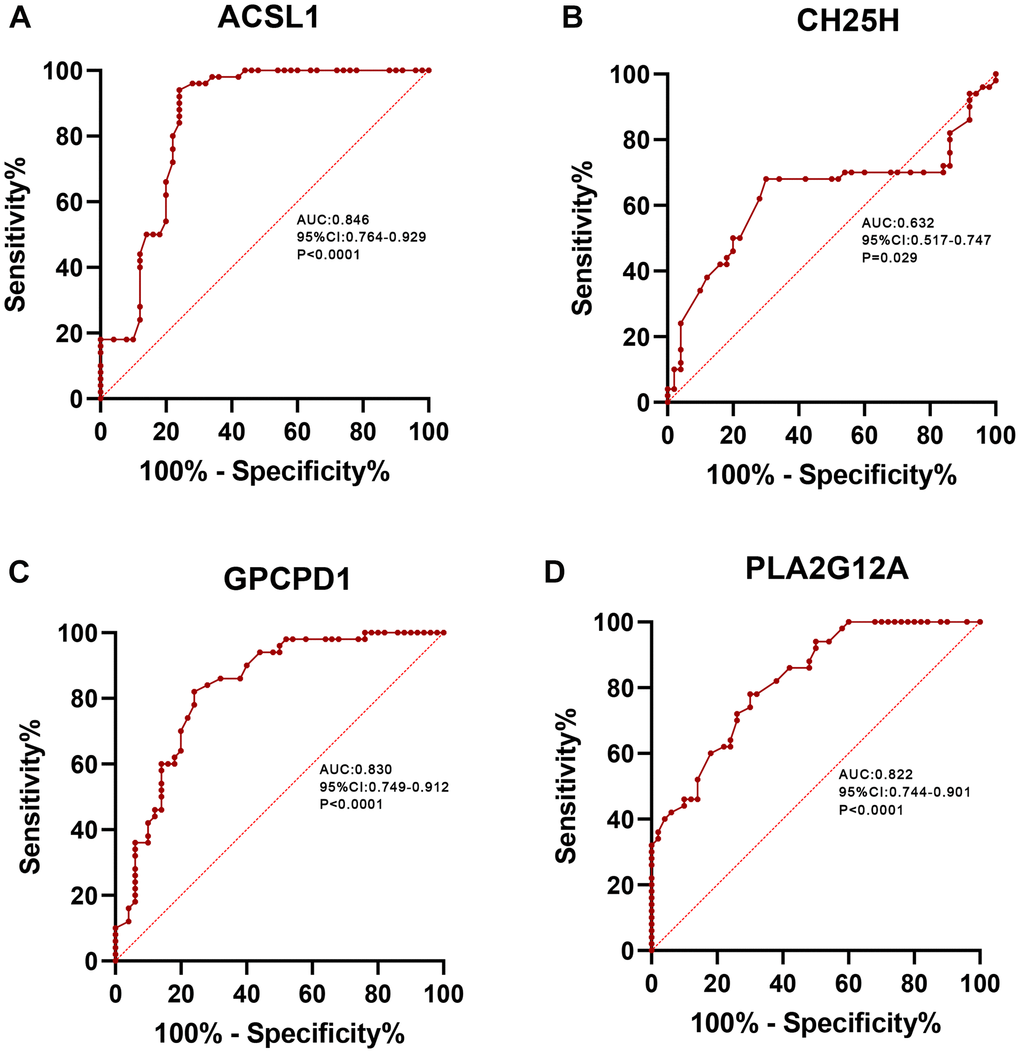
Figure 9. ROC curve analysis. ROC curve of ACSL1 (A), CH25H (B), GPCPD1 (C), PLA2G12A (D) in clinical samples.
Discussion
Acute myocardial infarction (AMI) refers to hypoxia caused by coronary atherosclerosis stenosis and myocardial necrosis caused by acute and persistent ischemia [18]. Dyslipidemia is a known risk factor for AMI [19], and lipid-lowering therapy is the treatment cornerstone. Several convincing studies have shown that the combined effect of lowering triglyceride, LDL cholesterol, and total cholesterol levels yield higher cardiovascular risk than lowering LDL cholesterol levels alone [20–22]. The accumulated molecular genetic data indicate that many genes are related to AMI occurrence, including lipid-related genes [23]. However, the lipid-related genes involved in AMI have not been completely identified. Thus, it is necessary to comprehend the role of lipid-related genes in AMI diagnosis and treatment.
Herein, we retrieved data of AMI patients (GSE66360) and subjected it to differential genes analysis, and identified lipid-related DEGs associated with AMI. Lipid-related DEGs were then subjected to GO and KEGG enrichment analyses. LASSO regression is a machine learning method that recognizes variables by looking for a λ value for a minimal classification error [24]. SVM-RFE is another machine learning method that finds optimal variables through subtracting SVM-generated feature vectors [25]. We used these two algorithms to screen characteristic variables and created an optimal classification model. Four lipid-related genes (ASCL1, CH25H, GPCPD1, and PLA2G12A) were identified based on these two methods, which significantly impact AMI diagnosis. Moreover, the findings of CH25H were controversial compared with previous studies and should be interpreted with caution. Nevertheless, the p values of these four lipid-related genes were < 0.05, verified by RT-qPCR and consistent with our bioinformatic analysis results.
ACSL1 is a key rate-limiting enzyme in lipid metabolism [26], catalyzing the energy production of fatty acids or the production of phospholipids, cholesterol esters, and triglycerides [27]. Previous studies have shown that heart-specific overexpression of ACSL1 in mice increases triglyceride accumulation in cardiomyocytes [28]. Li et al. demonstrated that inhibiting ACSL1 expression in the heart can reduce lipid metabolism and promote the regeneration of cardiomyocytes [29]. A cohort study has shown that the expression level of ACSL1 in peripheral blood leukocytes of AMI patients was higher than that of healthy controls, and this high expression was a risk factor for AMI [30]. A recent study confirmed that the overexpression of ACSL1 can reduce fatty acid β-oxidation and increase plasma triglyceride levels by regulating the PPARγ pathway, which is one of the mechanisms that can promote the pathogenesis of AMI [31]. These results supported the findings of our bioinformatic analysis and suggested that ACSL1 plays a pathological role in AMI through lipid metabolism and might be a promising AMI biomarker. Moreover, PLA2G12A is a secreted phospholipase A2, but its physiological function is largely unclear. In humans, there is a suggestive association between a PLA2G12A polymorphism and response to anti-vascular endothelial growth factor therapy in patients with exudative age-related macular degeneration [32]. Alexandros et al. showed that PLA2G12A is highly expressed in aortic endothelial cells in vivo and may inhibit atherosclerosis by reducing the adhesion properties of vascular endothelial cells, which confirmed PLA2G12A as a candidate gene for atherosclerosis protection [33]. This was consistent with our findings that PLA2G12A was downregulated in AMI samples and was a protective gene, possibly by reducing vascular adhesion to decrease AMI incidence.
CH25H regulates cholesterol and lipid metabolism by converting cholesterol to 25-HC, and plays an important role in regulating cellular inflammatory states and cholesterol biosynthesis in endothelial cells and monocytes [34]. CH25H and 25-HC were traditionally regarded as key regulators to maintain cholesterol homeostasis by inhibiting sterol regulator-binding protein (SREBP) and liver X receptor (LXR) [35]. Elizabeth et al. showed that 25-HC production promotes the formation of macrophage foam cells and increases susceptibility to atherosclerosis, thereby increasing AMI risk [36]. However, the pro-inflammatory role of CH25H in atherosclerosis remains controversial. Other studies have shown that CH25H is involved in macrophages’ functional endothelium and anti-inflammatory phenotype and that CH25H ablation increases susceptibility to atherosclerosis [37]. Our current study suggested that CH25H was upregulated in AMI samples, consistent with the Elizabeth et al. results. This contradiction might be partly due to different experimental conditions requiring further study. Additionally, GPCPD1 is a key enzyme in choline and phospholipid metabolism. GPCPD1 has also been reported to be involved in the complex network of enzymatic reactions regulating choline metabolism [38]. It can cleave glycerophosphocholine to form glycerol-3-phosphate and choline [39]. GPCPD1 has been reported to promote cell migration, metastasis, adhesion, and diffusion in breast, endometrial, and ovarian cancers. However, its biological role in cardiovascular disease remains unclear. Hence, more studies are needed to further verify our current findings.
In the current research, several correlations between four key lipid-related DEGs were also noticed. Correlation analysis indicated that the ACSL1, CH25H, GPCPD1, and PLA2G12A genes may influence the occurrence of AMI by synergistically regulating the same lipid metabolic pathway. Meanwhile, the functional analyses were also performed to evaluate the potential biological functions of lipid-related DEGs. The GO enrichment analysis showed that these genes were closely related to fatty acid metabolism. Furthermore, the KEGG enrichment analysis revealed that the lipid-related genes were primarily associated with the PPAR signaling pathway. PPAR is activated by fatty acids and their derivatives, thereby creating a lipid signaling network between the cell surface and the nucleus [40]. As lipid sensors and master regulators, PPAR controls the expression of genes that function in lipid metabolism [41]. The PPAR signaling pathway, a crossing regulator of lipid signaling and inflammation, [40] was enriched, indicating that it plays a crucial role in lipid metabolism response to AMI. A previous study has found that the downregulation of PPARγ contributes to the activation and aggregation, eventually forming micro-thromboses, finally leading to myocardial dysfunction [42]. These results indicated that these lipid-related genes might affect AMI occurrence through the PPAR signaling pathway. However, further research is required to confirm the correlations between these key genes.
However, our current study also has some limitations. First, we used the dataset from circulating endothelial cells to perform the bioinformatics analysis, and used the peripheral blood mononuclear cells from myocardial infarction and normal people for verification. Although there was some sample heterogeneity, our research, like other studies using GSE66360 dataset [43–45], obtained a satisfactory result, which fully supported our conclusion. However, more studies are needed to further confirm our findings. Second, the included clinical samples were relatively small. Therefore, our conclusions must be verified by a larger AMI cohort. Third, lipid-related DEGs were only confirmed in clinical samples, and their potential functions were not demonstrated in AMI cells or animal models. Hence, more in vivo and in vitro studies are needed to clarify the underlying mechanisms of these key genes in AMI.
In summary, four lipid-related genes involved in AMI were confirmed by bioinformatics analysis and machine learning methods. These genes might influence AMI occurrence by regulating lipid metabolism. Our current findings might help understand the mechanisms of lipid metabolism-related genes in AMI and develop future lipid-lowering treatment strategies for AMI.
Materials and Methods
Clinical validation samples
From September 2021 to May 2022, 50 AMI patients (AMI group) and healthy participants (control group) were recruited from the Hunan Provincial People’s Hospital. The blood samples were collected from AMI patients within hours of admission with chest pain and before using antiplatelet or anticoagulant to eliminate the influence of possible changes in blood status after pharmacological intervention. All AMI patients underwent percutaneous coronary intervention (PCI) within 12 h of the chest pain onset. The AMI patients were diagnosed based on the 2018 guidelines for diagnosing AMI patients [52]. A total of 50 healthy individuals were enrolled in the hospital physical examination center in the same period. The exclusion criteria were: (i) active inflammation; (ii) patients receiving thrombolysis and with other underlying heart diseases (e.g., severe valvular abnormalities, cardiomyopathy, or congenital heart disease); and (iii) patients who had hepatic and/or renal dysfunction, tumors, and autoimmune diseases. All participants provided written informed consent before the beginning of the study. This research was approved by the Ethics Committee of the Hunan Provincial People’s Hospital (approval number: [2021]-41).
Real-time quantitative polymerase chain reaction (RT-qPCR)
Peripheral blood was obtained from blood samples of patients using RNeasy™ Mini Kit (QIAGEN, Frankfurt, Germany) to extract total RNA. Total RNA was reverse transcribed into cDNA using the PrimeScript RT reagent kit (Takara Bio, Japan). RT-qPCR was performed with a LightCycler 480 II Real-time PCR instrument (Roche, Switzerland) using the TransStart Top Green qPCR SuperMix (AQ131-03, Transgen, Beijing, China).
Statistical analysis
All bioinformatics and Pearson’s correlation analyses were performed using R software (version 4.6.0, http://www.R-project.org). SPSS software (version 22.0) was used to analyze clinical data. Clinical characteristic data were analyzed using Student’s t-test and χ2 test. R and Grap Pad Prism software were used for ROC curve analysis. A p < 0.05 was considered statistically significant.
Supplementary Materials
Author Contributions
Z.Y.L and F.L. designed the study, performed the statistical analyses and drafted the manuscript. P.F.Z. and X.Q.H participated in the design and helped to draft the manuscript. F.L. collected the research data. H.W.P. performed the statistical analyses. S.L.P and Y.C. revised the manuscript. All authors read and approved the final manuscript.
Acknowledgments
We thank all the participants of this study.
Conflicts of Interest
The authors declare no conflicts of interest related to this study.
Ethical Statement and Consent
This research was approved by the Ethics Committee of the Hunan Provincial People’s Hospital (approval number: [2021]-41).) Written informed consent was obtained from all participants.
Funding
This study was supported by the Key Research and Development Program of Hunan Province (No: 2019SK2021), Young Doctor Fund Project of Hunan Provincial People’s Hospital (No: BSJJ202212) and the Natural Science Foundation of Hunan Province (No: 2020JJ4406). There was no role of the funding body in the design of the study and collection, analysis, and interpretation of data and in writing the manuscript.
References
- 1. Yamada Y, Matsui K, Takeuchi I, Fujimaki T. Association of genetic variants with coronary artery disease and ischemic stroke in a longitudinal population-based genetic epidemiological study. Biomed Rep. 2015; 3:413–9. https://doi.org/10.3892/br.2015.440 [PubMed]
- 2. Abram S, Arruda-Olson AM, Scott CG, Pellikka PA, Nkomo VT, Oh JK, Milan A, Abidian MM, McCully RB. Frequency, Predictors, and Implications of Abnormal Blood Pressure Responses During Dobutamine Stress Echocardiography. Circ Cardiovasc Imaging. 2017; 10:e005444. https://doi.org/10.1161/CIRCIMAGING.116.005444 [PubMed]
- 3. Chiu MH, Heydari B, Batulan Z, Maarouf N, Subramanya V, Schenck-Gustafsson K, O'Brien ER. Coronary artery disease in post-menopausal women: are there appropriate means of assessment? Clin Sci (Lond). 2018; 132:1937–52. https://doi.org/10.1042/CS20180067 [PubMed]
- 4. Madhavan MV, Gersh BJ, Alexander KP, Granger CB, Stone GW. Coronary Artery Disease in Patients ≥80 Years of Age. J Am Coll Cardiol. 2018; 71:2015–40. https://doi.org/10.1016/j.jacc.2017.12.068 [PubMed]
- 5. Anderson JL, Morrow DA. Acute Myocardial Infarction. N Engl J Med. 2017; 376:2053–64. https://doi.org/10.1056/NEJMra1606915 [PubMed]
- 6. Andreadou I, Tsoumani M, Vilahur G, Ikonomidis I, Badimon L, Varga ZV, Ferdinandy P, Schulz R. PCSK9 in Myocardial Infarction and Cardioprotection: Importance of Lipid Metabolism and Inflammation. Front Physiol. 2020; 11:602497. https://doi.org/10.3389/fphys.2020.602497 [PubMed]
- 7. Michos ED, McEvoy JW, Blumenthal RS. Lipid Management for the Prevention of Atherosclerotic Cardiovascular Disease. N Engl J Med. 2019; 381:1557–67. https://doi.org/10.1056/NEJMra1806939 [PubMed]
- 8. Grundy SM, Cleeman JI, Merz CN, Brewer HB
Jr , Clark LT, Hunninghake DB, Pasternak RC, Smith SCJr , Stone NJ, and Coordinating Committee of the National Cholesterol Education Program. Implications of recent clinical trials for the National Cholesterol Education Program Adult Treatment Panel III Guidelines. J Am Coll Cardiol. 2004; 44:720–32. https://doi.org/10.1016/j.jacc.2004.07.001 [PubMed] - 9. Gotto AM
Jr , Brinton EA. Assessing low levels of high-density lipoprotein cholesterol as a risk factor in coronary heart disease: a working group report and update. J Am Coll Cardiol. 2004; 43:717–24. https://doi.org/10.1016/j.jacc.2003.08.061 [PubMed] - 10. Gencer B, Koskinas KC, Räber L, Karagiannis A, Nanchen D, Auer R, Carballo D, Carballo S, Klingenberg R, Heg D, Matter CM, Lüscher TF, Rodondi N, et al. Eligibility for PCSK9 Inhibitors According to American College of Cardiology (ACC) and European Society of Cardiology/European Atherosclerosis Society (ESC/EAS) Guidelines After Acute Coronary Syndromes. J Am Heart Assoc. 2017; 6:e006537. https://doi.org/10.1161/JAHA.117.006537 [PubMed]
- 11. Sinnaeve PR, Donahue MP, Grass P, Seo D, Vonderscher J, Chibout SD, Kraus WE, Sketch M
Jr , Nelson C, Ginsburg GS, Goldschmidt-Clermont PJ, Granger CB. Gene expression patterns in peripheral blood correlate with the extent of coronary artery disease. PLoS One. 2009; 4:e7037. https://doi.org/10.1371/journal.pone.0007037 [PubMed] - 12. Muse ED, Kramer ER, Wang H, Barrett P, Parviz F, Novotny MA, Lasken RS, Jatkoe TA, Oliveira G, Peng H, Lu J, Connelly MC, Schilling K, et al. A Whole Blood Molecular Signature for Acute Myocardial Infarction. Sci Rep. 2017; 7:12268. https://doi.org/10.1038/s41598-017-12166-0 [PubMed]
- 13. Ntzani EE, Ioannidis JP. Predictive ability of DNA microarrays for cancer outcomes and correlates: an empirical assessment. Lancet. 2003; 362:1439–44. https://doi.org/10.1016/S0140-6736(03)14686-7 [PubMed]
- 14. Ein-Dor L, Kela I, Getz G, Givol D, Domany E. Outcome signature genes in breast cancer: is there a unique set? Bioinformatics. 2005; 21:171–8. https://doi.org/10.1093/bioinformatics/bth469 [PubMed]
- 15. Chen R, Liu X, Jin S, Lin J, Liu J. Machine Learning for Drug-Target Interaction Prediction. Molecules. 2018; 23:30200333. https://doi.org/10.3390/molecules23092208 [PubMed]
- 16. Wei S, Lu J, Lou J, Shi C, Mo S, Shao Y, Ni J, Zhang W, Cheng X. Gastric Cancer Tumor Microenvironment Characterization Reveals Stromal-Related Gene Signatures Associated With Macrophage Infiltration. Front Genet. 2020; 11:663. https://doi.org/10.3389/fgene.2020.00663 [PubMed]
- 17. Kumar R, Indrayan A. Receiver operating characteristic (ROC) curve for medical researchers. Indian Pediatr. 2011; 48:277–87. https://doi.org/10.1007/s13312-011-0055-4 [PubMed]
- 18. Moreira DM, da Silva RL, Vieira JL, Fattah T, Lueneberg ME, Gottschall CA. Role of vascular inflammation in coronary artery disease: potential of anti-inflammatory drugs in the prevention of atherothrombosis. Inflammation and anti-inflammatory drugs in coronary artery disease. Am J Cardiovasc Drugs. 2015; 15:1–11. https://doi.org/10.1007/s40256-014-0094-z [PubMed]
- 19. Boateng S, Sanborn T. Acute myocardial infarction. Dis Mon. 2013; 59:83–96. https://doi.org/10.1016/j.disamonth.2012.12.004 [PubMed]
- 20. Ferrières J, Amber V, Crisan O, Chazelle F, Jünger C, Wood D. Total lipid management and cardiovascular disease in the dyslipidemia international study. Cardiology. 2013; 125:154–63. https://doi.org/10.1159/000348859 [PubMed]
- 21. Chapman MJ, Ginsberg HN, Amarenco P, Andreotti F, Borén J, Catapano AL, Descamps OS, Fisher E, Kovanen PT, Kuivenhoven JA, Lesnik P, Masana L, Nordestgaard BG, et al, and European Atherosclerosis Society Consensus Panel. Triglyceride-rich lipoproteins and high-density lipoprotein cholesterol in patients at high risk of cardiovascular disease: evidence and guidance for management. Eur Heart J. 2011; 32:1345–61. https://doi.org/10.1093/eurheartj/ehr112 [PubMed]
- 22. Can M, Acikgoz S, Mungan G, Ugurbas E, Ankarali H, Sumbuloglu V, Demirtas S, Karaca L. Is direct method of low density lipoprotein cholesterol measurement appropriate for targeting lipid lowering therapy? Int J Cardiol. 2010; 142:105–7. https://doi.org/10.1016/j.ijcard.2008.11.141 [PubMed]
- 23. Zdravkovic S, Wienke A, Pedersen NL, de Faire U. Genetic susceptibility of myocardial infarction. Twin Res Hum Genet. 2007; 10:848–52. https://doi.org/10.1375/twin.10.6.848 [PubMed]
- 24. Zhao YP, Wang JJ, Li XY, Peng GJ, Yang Z. Extended least squares support vector machine with applications to fault diagnosis of aircraft engine. ISA Trans. 2020; 97:189–201. https://doi.org/10.1016/j.isatra.2019.08.036 [PubMed]
- 25. Wan JJ, Chen BL, Kong YX, Ma XG, Yu YT. An Early Intestinal Cancer Prediction Algorithm Based on Deep Belief Network. Sci Rep. 2019; 9:17418. https://doi.org/10.1038/s41598-019-54031-2 [PubMed]
- 26. Goldenberg JR, Wang X, Lewandowski ED. Acyl CoA synthetase-1 links facilitated long chain fatty acid uptake to intracellular metabolic trafficking differently in hearts of male versus female mice. J Mol Cell Cardiol. 2016; 94:1–9. https://doi.org/10.1016/j.yjmcc.2016.03.006 [PubMed]
- 27. Li LO, Ellis JM, Paich HA, Wang S, Gong N, Altshuller G, Thresher RJ, Koves TR, Watkins SM, Muoio DM, Cline GW, Shulman GI, Coleman RA. Liver-specific loss of long chain acyl-CoA synthetase-1 decreases triacylglycerol synthesis and beta-oxidation and alters phospholipid fatty acid composition. J Biol Chem. 2009; 284:27816–26. https://doi.org/10.1074/jbc.M109.022467 [PubMed]
- 28. Chiu HC, Kovacs A, Ford DA, Hsu FF, Garcia R, Herrero P, Saffitz JE, Schaffer JE. A novel mouse model of lipotoxic cardiomyopathy. J Clin Invest. 2001; 107:813–22. https://doi.org/10.1172/JCI10947 [PubMed]
- 29. Li Y, Yang M, Tan J, Shen C, Deng S, Fu X, Gao S, Li H, Zhang X, Cai W. Targeting ACSL1 promotes cardiomyocyte proliferation and cardiac regeneration. Life Sci. 2022; 294:120371. https://doi.org/10.1016/j.lfs.2022.120371 [PubMed]
- 30. Yang L, Yang Y, Si D, Shi K, Liu D, Meng H, Meng F. High expression of long chain acyl-coenzyme A synthetase 1 in peripheral blood may be a molecular marker for assessing the risk of acute myocardial infarction. Exp Ther Med. 2017; 14:4065–72. https://doi.org/10.3892/etm.2017.5091 [PubMed]
- 31. Li T, Li X, Meng H, Chen L, Meng F. ACSL1 affects Triglyceride Levels through the PPARγ Pathway. Int J Med Sci. 2020; 17:720–7. https://doi.org/10.7150/ijms.42248 [PubMed]
- 32. Wang VM, Rosen RB, Meyerle CB, Kurup SK, Ardeljan D, Agron E, Tai K, Pomykala M, Chew EY, Chan CC, Tuo J. Suggestive association between PLA2G12A single nucleotide polymorphism rs2285714 and response to anti-vascular endothelial growth factor therapy in patients with exudative age-related macular degeneration. Mol Vis. 2012; 18:2578–85. [PubMed]
- 33. Nicolaou A, Northoff BH, Sass K, Ernst J, Kohlmaier A, Krohn K, Wolfrum C, Teupser D, Holdt LM. Quantitative trait locus mapping in mice identifies phospholipase Pla2g12a as novel atherosclerosis modifier. Atherosclerosis. 2017; 265:197–206. https://doi.org/10.1016/j.atherosclerosis.2017.08.030 [PubMed]
- 34. Tuong ZK, Lau P, Du X, Condon ND, Goode JM, Oh TG, Yeo JC, Muscat GE, Stow JL. RORα and 25-Hydroxycholesterol Crosstalk Regulates Lipid Droplet Homeostasis in Macrophages. PLoS One. 2016; 11:e0147179. https://doi.org/10.1371/journal.pone.0147179 [PubMed]
- 35. Zhao J, Chen J, Li M, Chen M, Sun C. Multifaceted Functions of CH25H and 25HC to Modulate the Lipid Metabolism, Immune Responses, and Broadly Antiviral Activities. Viruses. 2020; 12:727. https://doi.org/10.3390/v12070727 [PubMed]
- 36. Gold ES, Ramsey SA, Sartain MJ, Selinummi J, Podolsky I, Rodriguez DJ, Moritz RL, Aderem A. ATF3 protects against atherosclerosis by suppressing 25-hydroxycholesterol-induced lipid body formation. J Exp Med. 2012; 209:807–17. https://doi.org/10.1084/jem.20111202 [PubMed]
- 37. Li Z, Martin M, Zhang J, Huang HY, Bai L, Zhang J, Kang J, He M, Li J, Maurya MR, Gupta S, Zhou G, Sangwung P, et al. Krüppel-Like Factor 4 Regulation of Cholesterol-25-Hydroxylase and Liver X Receptor Mitigates Atherosclerosis Susceptibility. Circulation. 2017; 136:1315–30. https://doi.org/10.1161/CIRCULATIONAHA.117.027462 [PubMed]
- 38. Marchan R, Büttner B, Lambert J, Edlund K, Glaeser I, Blaszkewicz M, Leonhardt G, Marienhoff L, Kaszta D, Anft M, Watzl C, Madjar K, Grinberg M, et al. Glycerol-3-phosphate Acyltransferase 1 Promotes Tumor Cell Migration and Poor Survival in Ovarian Carcinoma. Cancer Res. 2017; 77:4589–601. https://doi.org/10.1158/0008-5472.CAN-16-2065 [PubMed]
- 39. Glunde K, Penet MF, Jiang L, Jacobs MA, Bhujwalla ZM. Choline metabolism-based molecular diagnosis of cancer: an update. Expert Rev Mol Diagn. 2015; 15:735–47. https://doi.org/10.1586/14737159.2015.1039515 [PubMed]
- 40. Wahli W, Michalik L. PPARs at the crossroads of lipid signaling and inflammation. Trends Endocrinol Metab. 2012; 23:351–63. https://doi.org/10.1016/j.tem.2012.05.001 [PubMed]
- 41. Michalik L, Auwerx J, Berger JP, Chatterjee VK, Glass CK, Gonzalez FJ, Grimaldi PA, Kadowaki T, Lazar MA, O'Rahilly S, Palmer CN, Plutzky J, Reddy JK, et al. International Union of Pharmacology. LXI. Peroxisome proliferator-activated receptors. Pharmacol Rev. 2006; 58:726–41. https://doi.org/10.1124/pr.58.4.5 [PubMed]
- 42. Zhou H, Li D, Zhu P, Hu S, Hu N, Ma S, Zhang Y, Han T, Ren J, Cao F, Chen Y. Melatonin suppresses platelet activation and function against cardiac ischemia/reperfusion injury via PPARγ/FUNDC1/mitophagy pathways. J Pineal Res. 2017; 63:e12438. https://doi.org/10.1111/jpi.12438 [PubMed]
- 43. Zheng PF, Liao FJ, Yin RX, Chen LZ, Li H, Nie RJ, Wang Y, Liao PJ. Genes associated with inflammation may serve as biomarkers for the diagnosis of coronary artery disease and ischaemic stroke. Lipids Health Dis. 2020; 19:37. https://doi.org/10.1186/s12944-020-01217-7 [PubMed]
- 44. Cheng M, An S, Li J. Identifying key genes associated with acute myocardial infarction. Medicine (Baltimore). 2017; 96:e7741. https://doi.org/10.1097/MD.0000000000007741 [PubMed]
- 45. Ji Z, Zhang R, Yang M, Zuo W, Yao Y, Qu Y, Su Y, Liu Z, Gu Z, Ma G. Accuracy of triggering receptor expressed on myeloid cells 1 in diagnosis and prognosis of acute myocardial infarction: a prospective cohort study. PeerJ. 2021; 9:e11655. https://doi.org/10.7717/peerj.11655 [PubMed]
- 46. Xia C, Chen L, Sun W, Yan R, Xia M, Wang Y, Yang D. Total saponins from Paris forrestii (Takht) H. Li. show the anticancer and RNA expression regulating effects on prostate cancer cells. Biomed Pharmacother. 2020; 121:109674. https://doi.org/10.1016/j.biopha.2019.109674 [PubMed]
- 47. Huang J, Liu L, Qin L, Huang H, Li X. Weighted Gene Coexpression Network Analysis Uncovers Critical Genes and Pathways for Multiple Brain Regions in Parkinson's Disease. Biomed Res Int. 2021; 2021:6616434. https://doi.org/10.1155/2021/6616434 [PubMed]
- 48. Xu M, Li Z, Yang L, Zhai W, Wei N, Zhang Q, Chao B, Huang S, Cui H. Elucidation of the Mechanisms and Molecular Targets of Sanhuang Xiexin Decoction for Type 2 Diabetes Mellitus Based on Network Pharmacology. Biomed Res Int. 2020; 2020:5848497. https://doi.org/10.1155/2020/5848497 [PubMed]
- 49. McEligot AJ, Poynor V, Sharma R, Panangadan A. Logistic LASSO Regression for Dietary Intakes and Breast Cancer. Nutrients. 2020; 12:2652. https://doi.org/10.3390/nu12092652 [PubMed]
- 50. Pierre JF, Akbilgic O, Smallwood H, Cao X, Fitzpatrick EA, Pena S, Furmanek SP, Ramirez JA, Jonsson CB. Discovery and predictive modeling of urine microbiome, metabolite and cytokine biomarkers in hospitalized patients with community acquired pneumonia. Sci Rep. 2020; 10:13418. https://doi.org/10.1038/s41598-020-70461-9 [PubMed]
- 51. Sundermann B, Bode J, Lueken U, Westphal D, Gerlach AL, Straube B, Wittchen HU, Ströhle A, Wittmann A, Konrad C, Kircher T, Arolt V, Pfleiderer B. Support Vector Machine Analysis of Functional Magnetic Resonance Imaging of Interoception Does Not Reliably Predict Individual Outcomes of Cognitive Behavioral Therapy in Panic Disorder with Agoraphobia. Front Psychiatry. 2017; 8:99. https://doi.org/10.3389/fpsyt.2017.00099 [PubMed]
- 52. Thygesen K, Alpert JS, Jaffe AS, Chaitman BR, Bax JJ, Morrow DA, White HD, and Executive Group on behalf of the Joint European Society of Cardiology (ESC)/American College of Cardiology (ACC)/American Heart Association (AHA)/World Heart Federation (WHF) Task Force for the Universal Definition of Myocardial Infarction. Fourth Universal Definition of Myocardial Infarction (2018). Circulation. 2018; 138:e618–51. https://doi.org/10.1161/CIR.0000000000000617 [PubMed]