


This article has been corrected: The authors corrected Table 3, “Sequence of primers for RT-PCR and long PCR,” because they forgot to update this table before submission. The primers used in the study were changed three times before a set that worked was synthesized and verified by “Sangon Biotech.” They also found and corrected a duplication in Figure 5B created during the figure assembly - column chart “PGC-1α” replicates column chart “Fis1.” Correction was done with data from the original sets of Western blots for PGC-1α protein. These corrections have no impact on the experimental outcome or conclusions.
The corrected Table 3 and Figure 5 are presented below.
| Table 3. Sequences of primers for RT-PCR and long PCR. |
|---|
| Target Gene | Primer Sequence | Tm (°C) |
| OPA1 | Forward: 5’-TGGTTCGAGAGTCGGTTGAA-3’ | 56 |
| Reverse: 5’- CCTCCCAGTGCTTTGGAGTA -3’ | 56 | |
| Mfn1 | Forward: 5’-GGGAAGACCAAATCGACAGA-3’ | 57 |
| Reverse: 5’-CAAAACAGACAGGCGACAAA-3’ | 57 | |
| Mfn2 | Forward: 5’-GAGAGGCGATTTGAGGAGTG-3’ | 58 |
| Reverse: 5’-CTCTTCCCGCATTTCAAGAC-3’ | 56 | |
| Drp1 | Forward: 5’-GCCCGTGGATGATAAAAGTG-3’ | 56 |
| Reverse: 5’-TGGCGGTCAAGATGTCAATA-3’ | 56 | |
| Fis1 | Forward: 5’-AGATGGACTGGTAGGCATGG-3’ | 56 |
| Reverse: 5’-GACACAGCCAGTCCAATGAG-3’ | 56 | |
| PGC-1α | Forward: 5’-GGACGAATACCGCAGAGAGT-3’ | 59 |
| Reverse: 5’-CCATCATCCCGCAGATTTAC-3’ | 56 | |
| Tfam | Forward: 5’-TCACCTCAAGGGAAATTGAAG-3’ | 55 |
| Reverse: 5’-CCCAATCCCAATGACAACTC-3’ | 56 | |
| Long Fragment | Forward:5’-AAAATCCCCGCAAACAATGACCACCC-3’ | 72 |
| Reverse: 5’-GGCAATTAAGAGTGGGATGGAGCCAA-3’ | 72 | |
| Short Fragment | Forward: 5’-CCTCCCATTCATTATCGCCGCCCTGC-3’ | 60 |
| Reverse: 5’-GTCTGGGTCTCCTAGTAGGTCTGGGAA-3’ | 60 | |
| Bax | Forward: 5’-GCGATGAACTGGACAACAAC-3’ | 57 |
| Reverse: 5’-GATCAGCTCGGGCACTTTAG-3’ | 58 | |
| Bcl-2 | Forward: 5’-CGAGTGGGATACTGGAGATGA-3’ | 58 |
| Reverse: 5’- GACGGTAGCGACGAGAGAAG-3’ | 59 | |
| Caspase-3 | Forward: 5’-GACTGGAAAGCCGAAACTCT-3’ | 55 |
| Reverse: 5’-TGCCATATCATCGTCAGTTCC-3’ | 54 | |
| Caspase-9 | Forward: 5’-CAGAGGTTCTCACACCAGAAA-3’ | 54 |
| Reverse: 5’-TGCCATATCTGCATGTCTCTC-3’ | 54 | |
| ASK1 | Forward: 5’-GACAAGAGAGCCTGTGCTAAT-3’ | 54 |
| Reverse: 5’-TCTCCGTGCAACCACATAC-3’ | 55 | |
| JNK | Forward: 5’-GGATTTGGAGGAGCGAACTAA -3’ | 54 |
| Reverse: 5’-CATTGACAGACGGCGAAGA-3’ | 55 | |
| Cty-c | Forward: 5’-GGACAGCCCCGATTTAAGTA-3’ | 57 |
| Reverse: 5’-TCAATAGGTTTGAGGCGACAC-3’ | 58 | |
| GAPDH | Forward: 5’- AGGTCGGTGTGAACGGATTTG -3’ | 58 |
| Reverse: 5’- GGGGTCGTTGATGGCAACA-3’ | 58 |
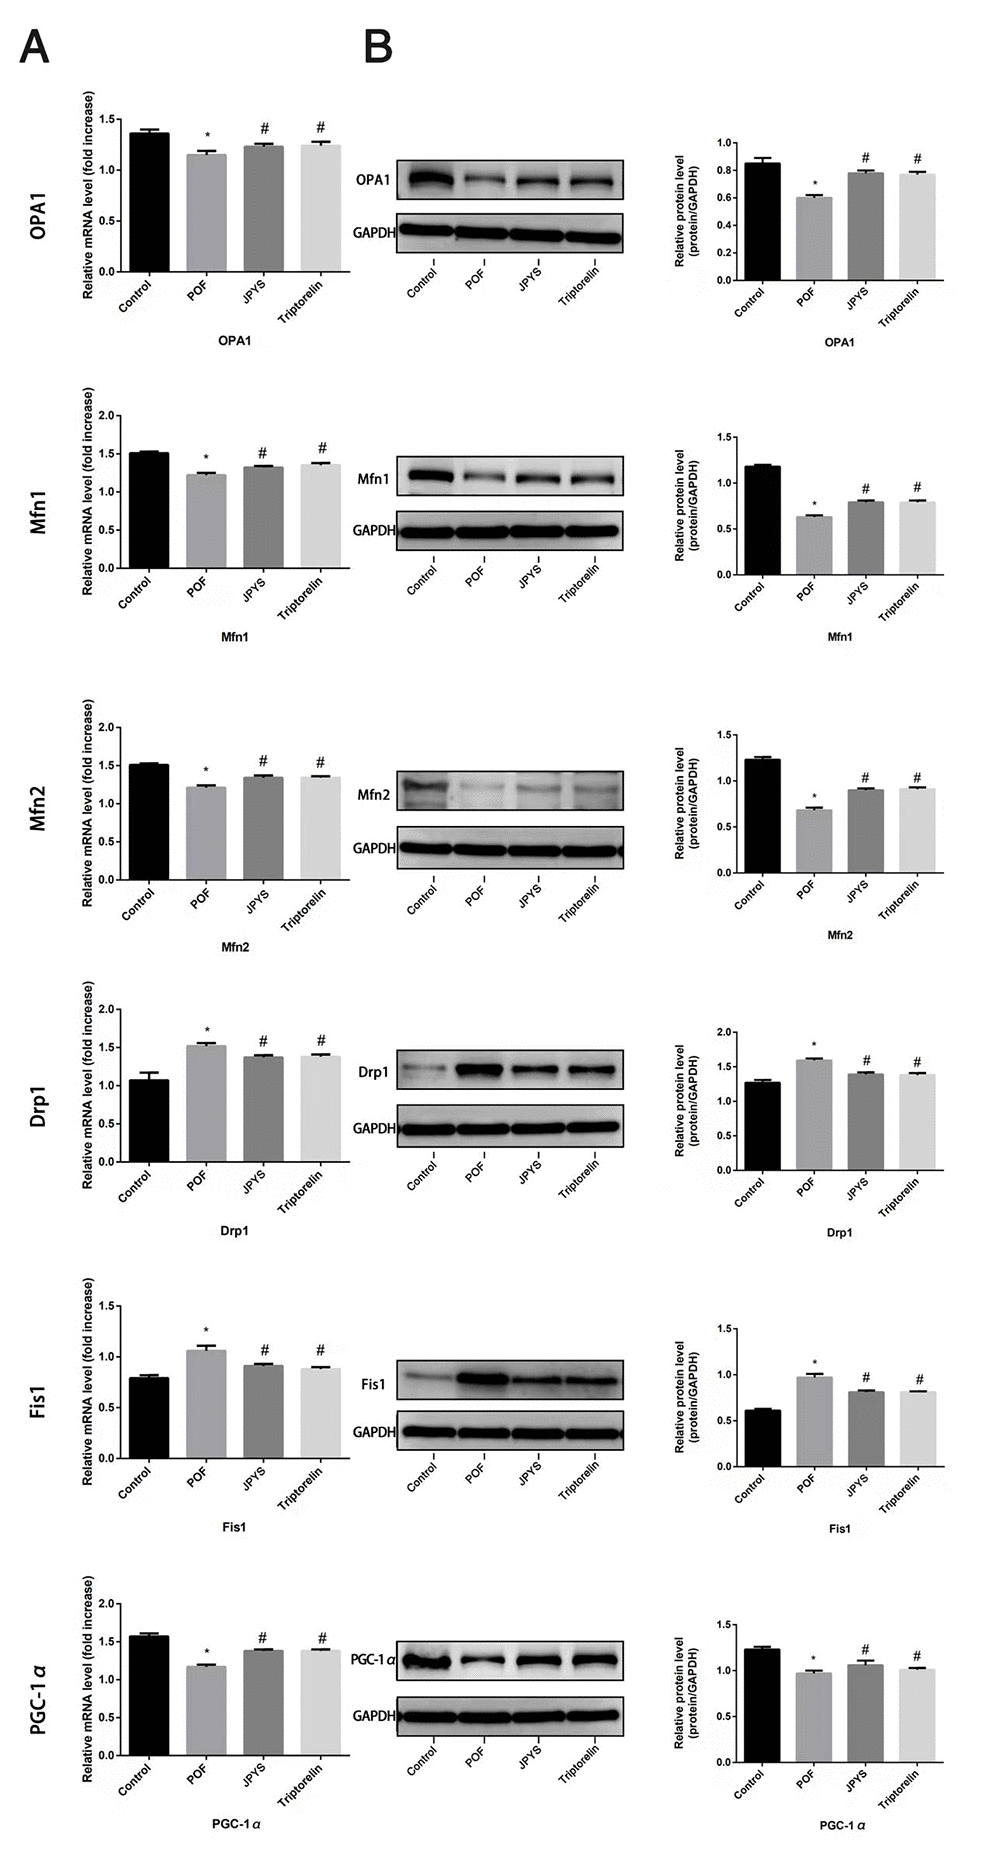
Figure 5. JPYS improved mitochondrial biogenesis and dynamics in premature ovarian failure (POF) rats. Rats were treated with JPYS (11.0 g/kg.d) and pre-treated with triptorelin (1.5 mg/kg) followed by intraperitoneally injected cyclophosphamide (50 mg/kg). We used real-time qPCR and western blot to detect mitochondrial biogenesis and dynamics. We chose OPA1, Mfn1, and Mfn2 to represent mitochondrial biogenesis function, and PGC-1α to represent the dynamic mitochondrial fusion, and Drp1 and Fis1 to represent mitochondrial fission. The expression of OPA1, Mfn1, Mfn2, PGC-1α, Drp1, and Fis1 in mRNA (A) and protein (B) levels. Data are shown as mean ± SD. *p < 0.05 versus control group, #p < 0.05 versus POF group, △p < 0.05 versus JPYS group. (n=6).