


Introduction
Ischemic stroke is induced by cerebral artery occlusion, which causes damage to endothelial cells, vascular smooth muscle, glial cells, neurons and related neurovascular units, and ultimately leads to brain tissue death and focal neurological damage [1, 2]. Post-stroke cognitive impairment (PSCI) is a type of vascular cognitive impairment that manifests throughout 6 months following a stroke. Patients suffering from stroke lesions taking place in various regions of the brain that are not traditionally cognition-included may also result in development of PSCI. The plasma exosome biomarkers of PSCI have been emphasized. Plasma exosome biomarkers exploration and utilization and their associated functions allowed PSCI diagnosis and treatment possible.
Exosomes are small membrane vesicles existed in extracellular fluid and contain important genetic materials such as DNA, RNA, protein, lipid and miRNA [3]. Exosomes exist in extracellular fluid and contain important genetic materials such as DNA, RNA, protein, lipid and miRNA [3]. Exosomes can directly or indirectly act on target cells through the release of membrane contents or signal molecules for intercellular information transmission. In different pathological stages of ischemic stroke, exosomes released by different types of nerve cells contain specific signal molecules. Exosome miRNA-122-5p and miR-300-3p were biomarkers for the diagnosis of hyperacute (less than 6 h), subacute (8–14 d) and convalescent (greater than 14 d) ischemic cerebral infarction [4]. Exosomes secreted by circulating EPCs can transfer their inclusion to recipient endothelial cells, which contain miRNA related to PI3K/Akt signaling pathway and miRNA related to angiogenesis, such as miR-126 and miR-296. In the brain, exosomes secreted by cultured glioma cells provide angiogenic proteins, mRNAs and miRNAs to cerebrovascular endothelial cells and induce angiogenesis [5]. Neurons and glial cells interact with exosomes released by them to transfer biomolecules, regulate axonal growth and myelin sheath formation, and participate in brain nerve remodeling. Exosomes derived from multipluripotent mesenchymal stromal cells can effectively promote vascular and nerve regeneration, reduce inflammatory response and improve traumatic brain injury [6, 7]. Proteomics is an indispensable omics science to elucidate the proteome diversity. Faced with the limitations of diagnosis and treatment of PSCI, the task of finding effective methods to diagnose, predict and prevent PSCI has become more important.
In order to find a new prognostic and diagnostic plasma exosome biomarkers utilizing label-free quantitative proteomics and analysis of biological information in individuals with PSCI. In this study, a variety of psychological evaluations, which include the Mini-Mental Status Examination (MMSE), the Montreal Cognitive Assessment (MoCA), the Barthel index and blood biomarker detection were performed. The plasma exosome from control participants and PSCI patients were collected and analyzed by label-free quantitative proteomics. The differentially expressed proteins and its biological information analysis were conducted to establish global prospective on the PSCI pathogenesis mechanisms at proteins level.
Methods
Study design
The Chinese Clinical Trial Registry (ChiCTR) has registered and recorded this clinical trial (registration number: ChiCTR1900023739, registration date: June 10, 2019), and the research protocol was approved by the Ethics Committee of Dongzhimen Hospital, a department of Beijing University of Chinese Medicine (approval number: DZMEC-KY-2019-04). Patients suffering from acute ischemic stroke were registered from Dongzhimen Hospital (eastern area) associated with Beijing University of Chinese Medicine between June 9, 2019 to December, 2019. The present investigation was conducted based on the ethical principles outlined in the Helsinki Declaration of 1975 (and as modified in 2013). This study contains the control group and PSCI group.
Participants
This investigation included 20 participants who signed an informed consent form. There are 10 participants in the PSCI group and control group, respectively. PSCI patients’ inclusion criteria involved the following: (1) Age ≥35 years and ≤70 years; (2) Every patient has either an MRI or CT scan to validate the acute ischemic stroke; (3) Cognitive evaluation was done by MMSE within the first 7 days after the development of acute ischemic stroke. Patients having MMSE score ≤26 were determined as the PSCI group. (4) Cognitive impairment occurred after stroke [8, 9]. The exclusion criteria comprise the subsequent aspects : (1) Symptoms exhibited a range of complex to severe primary disorders of the heart, kidney, liver and hematopoietic system; (2) Consciousness acute disturbance; (3) Dementia and brain, different causes are because of mental or physiological diseases; (4) With severe vision, hearing or even speech impairment conflicts with rehabilitation; and (5) Furthermore the onset of cognitive impairment, there were no additional focal indications of cerebrovascular disease.
Behavioral assessment
The informed consent forms were signed by all participants and a variety of behavioral evaluations were conducted, such as the MMSE, the MoCA, the Barthel index, the Morse Fall Seale (MFS), and The Braden Scale is a scale utilised for the prediction of pressure sore risk, as well as the Padua Prediction Score. The patients received antiplatelet therapy (aspirin, 100 mg, QD) before assessments.
Blood biomarker detection
After a fasting period of 12-h, blood samples were obtained in the morning. Two milliliters of whole blood were drawn from peripheral vein of each participant and kept in a polypropylene tube including EDTA. The Dongzhimen Hospital affiliated with Beijing University of Chinese Medicine was requested to furnish the blood specimens. Following that, the fibrinogen, red blood cell specific volume (HCT), total cholesterol (CHO), triglyceride (TG), high-density lipoprotein (HDL), low-density lipoprotein (LDL), and other different markers were measured using whole blood samples.
The isolation and determination of plasma exosomes characteristics
The isolation procedure of exosomes
The isolation of plasma exosomes using TiO2 with a slight modification [10]. Remove the plasma sample from storage and place it on ice. Centrifuge the plasma sample at 2000 × g at room temperature for 20 min to extract cells and debris. Transfer 100 μL plasma to a new tube and processed using 0.2 mm pore size syringe filters (PALL Life Sciences, USA) for extracting apoptotic bodies and the large microvesicles. Following that, 5 mg of TiO2 microspheres were combined with the plasma sample (GL Science Inc, Japan) and mixed the sample thoroughly by vortexing at 4°C for a period of 5 min. The mixture underwent centrifugation at a force of 20,000 × g for 3 min at a temperature of 4°C, subsequently, the supernatant was extracted. The exosomes on the TiO2 microspheres were hydrated with PBS three times to eliminate unspecific contaminants. After washing with PBS, exosomes were lysed and digested directly with trypsin (Promega, Madison, WI) from the surface of microspheres at 37°C in 50 mM ammonium bicarbonate for 16 h. A new tube was used to transfer the supernatant and the TiO2 microspheres were hydrated twice with 100 μL of 0.1% formic acid after centrifugation at 12,000 g at 25°C for 5 min. The washing fraction was extracted and pooled with the supernatant. NanoDrop (Thermo Fisher, USA) was utilized to measure the concentration of peptide at an absorbance of 280 nm.
Western blot analysis of exosomes marker proteins
Detect the quality of plasma protein in 0.5 mL fraction sample. The fraction of vesicles with the least plasma protein content was selected for subsequent analysis. The concentration of protein samples was measured utilizing the BCA method. 12% SDS-PAGE was used for separating 10 μg of the protein, then the protein transferred to a 0.45 μm PVDF membrane, and inhibited utilizing a blocking solution including 5% bovine serum albumin for a period of 1 h at room temperature. Exosomal marker protein antibodies were add and incubate at a temperature of 4°C overnight, containing anti-CD63 rabbit polyclonal antibody (1:600) (Cat No. 25682-1-AP, Proteintech Group, Chicago, IL, USA), anti-TSG101 rabbit polyclonal antibody (1:2000) (Cat No. 28283-1-AP, Proteintech Group, USA), anti-CD81 mouse polyclonal antibody (1:3500) (Cat No. 66866-1-Ig, Proteintech Group, USA), anti-CD9 mouse polyclonal antibody (1:3000) (Cat No. 20597-1-AP, Proteintech Group, USA) and HRP-conjugated secondary antibodies (1:6000) (Cat No. SA00001-2; Proteintech Group, USA). The western blotting was examined utilizing an eECL Western blot kit (Cat No. CW0049 M, CWBIO, Jiangsu, China). After being eluted with 1 × TBST buffer, secondary antibody was supplemented and incubated at room temperature for a period of 90 min. After 3 hydrations by TBST, the color was generated utilizing SuperSignal West Femto Substrate Trial Kit (34094, Pierce, Rockford, IL, USA).
Transmission electron microscopy (TEM)
The exosome morphology was observed utilizing TEM. Exosome sample drops have the ability to adsorb for 5 min on formvar-coated EM grids, and were stained negatively utilizing 2% (w/v) phosphotungstic acid for 1 min. At 80 kV of acceleration voltage, transmission electron microscope (H-7650; Hitachi, Ltd., Tokyo, Japan) was utilized to perform TEM analysis.
Nanoparticle tracking analyzer (NTA) and Dynamic light scattering (DLS) analysis
The particle size and concentration analysis of model exosomes were performed on ZetaView Nanoparticle Tracker (Particle Metrix, Meerbusch, Germany). Calibrate the instrument with polystyrene particles with approximately 100 nm of a particle size, Dilute the model exosomes to approximately 1 × 10⁸ particles/mL, and put them into the instrument for analysis. Each group of samples is automatically scanned 11 times to remove abnormal data. The data was recorded and analyzed by ZetaView 8.03.04.01 software.
Label-free quantitative proteomics
MALDI-TOF-MS/MS and database searching were utilized for the identification of proteins. An online liquid chromatography-tandem mass spectrometry (LC-MS/MS) setup including an EasynanoLC system and a Q-Exactive mass spectrometer (Thermo Scientific, Germany) installed with a nanoelectrospray ion source was utilized for all LC-MS/MS investigations.
(1) Mobile phase A included 0.1% FA, 2% acetonitrile dissolved within water, and mobile phase B included 0.1% FA, 98% acetonitrile in water. The flow rate has been measured to be 300 nL/min.
(2) At 2 kV, the source was operated. In order to perform a full MS survey scan, AGC target was 3e6, scan range was from m/z 300 to 1400 and the result of resolution was 70,000. The 50 highest intense peaks with charge state 2 and above were chosen in order to sequence and fragmented in the ion trap by HCD with normalized collision energy of 27%. Exclude isotope item was enabled and dynamic exclusion time was adjusted as 18 s.
(3) MaxQuant software was utilized to search the Raw MS files against UniProt database. (Version 1.5.2.8). The fixed modification was C (carbamidomethyl) and the variable modification was M (oxidation) and protein N-term (acetyl). The tolerance for the first search peptide was 20 ppm and the tolerance for the main search peptide was 6 ppm. The MS/MS tolerance result was 0.02Da. The PSM and protein false discovery level result was 1%. The employed among the runs and minimum score required for modified peptides was 40.
Biological information analysis
Protein-protein interaction (PPI) networks analysis
To gain a deeper comprehension from the perspective of the biological context of differentially expressed proteins, the protein interaction analysis was conducted by utilizing the free web-based search tool STRING10.5. The STRING database is a fundamental data resource within the ELIXIR’s core, containing both identified and anticipated protein interactions. These data will be collected and integrated by the STRING database, with consolidating identified and anticipated protein-protein correlation data for the organism’s large number [11]. STRING was needed to incorporate additional predicted functional partners for the purpose of improving the PPI networks formation. The protein IDs list that was differentially expressed was entered into the STRING database (https://string-db.org) to determine identified and anticipated protein functional correlation networks.
GO analysis
For exhibiting the differentially expressed proteins presence, to categorize the proteins in accordance with their biological process, protein classification, cellular composition, and pathway, GO enrichment analysis was conducted. In order to find out how these experimentally discovered proteins are distributed, GO enrichment annotation tools were used to examine each protein with higher speed and to comprehend the relationship between protein and biological function in its entirety. GO function enrichment analysis of protein describes this distribution comparison with the overall protein distribution, confirming which biological processes or molecular functions were significantly enriched with experimentally identified proteins, many regulatory, metabolic, and signal transduction pathways are resistant within the organism, and these pathways frequently form various pathways. Pathway analysis permits the identification of the highest significant biochemical-metabolic and signal transduction pathways in which the proteins were contained.
ELISA quantification analysis
To detect the levels of IGHD, ABCB6, HSPD1, YWHAZ and BAIAP2, enzyme-linked immunosorbent assay (ELISA) kits were utilized to determine the plasma. According to the manufacturer guidelines, plasma samples were thawed and submitted to ELISA quantitative analysis using human IgD ELISA kit (Abcam, ab157708, Cambridge, UK), human ATP Binding Cassette Subfamily B Member 6, Mitochondrial (ABCB6) ELISA Kit (Abbexa, abx385541, Cambridge, UK), human Heat Shock Protein 60, HSP-60 ELISA Kit (CSB-E08560h, Cusabio, China), human 14-3-3 protein zeta/delta (YWHAZ) ELISA kit (CSB-EL026293HU, Cusabio, China), human Brain-Specific Angiogenesis Inhibitor 1-Associated Protein 2 (BAIAP2) ELISA Kit (Abbexa, abx386001, Cambridge, UK). ELISA microplates were read using MK3 microplate reader (Thermo, Helsinki, Finland).
Statistical analysis
Each value was reported as the mean ± standard deviation (SD). Statistical analysis was conducted by SPSS20.0. The Demographic data and MMSE, MoCA, blood marker were analyzed with independent-samples t-test between control group and PSCI group. The Chi-square statistical test was utilized to investigate potential differences in gender variation between two distinct groups. P-values < 0.05 were reported as statistically significant.
Results
Demographics, behavioral assessment and detection of blood biomarker results
There were no variations in age (P = 0.182), gender (P = 0.653) or education (P = 0.072) among the PSCI and the control groups. The MMSE and MoCA scores were significantly reduced throughout the PSCI groups (P < 0.01) (Table 1). According to the control group, the PT% and high-density lipoprotein reduced (P < 0.05) and the INR ratio reduced (P < 0.05) in the PSCI group (Table 2).
Table 1. Demographic information and behavioral scale assessment.
| Control group (n = 10) | PSCI group (n = 10) | P-value | |||||||||||||||||||||||||||||||||||||||||||||||||||||||||||||||||||||||||||||||||||||||||||||||||
| Age (y) | 55.80 ± 6.92 | 60.30 ± 9.17 | 0.231 | ||||||||||||||||||||||||||||||||||||||||||||||||||||||||||||||||||||||||||||||||||||||||||||||||
| Gender (M/F) | 6/4 | 5/5 | 0.653 | ||||||||||||||||||||||||||||||||||||||||||||||||||||||||||||||||||||||||||||||||||||||||||||||||
| Education (y) | 10.30 ± 2.16 | 8.30 ± 2.50 | 0.072 | ||||||||||||||||||||||||||||||||||||||||||||||||||||||||||||||||||||||||||||||||||||||||||||||||
| MMSE | 29.80 ± 0.42 | 20.30 ± 3.83 | <0.01 | ||||||||||||||||||||||||||||||||||||||||||||||||||||||||||||||||||||||||||||||||||||||||||||||||
| MoCA | 29.40 ± 0.70 | 15.70 ± 5.03 | <0.01 | ||||||||||||||||||||||||||||||||||||||||||||||||||||||||||||||||||||||||||||||||||||||||||||||||
| Barthel | – | 70.00 ± 15.28 | – | ||||||||||||||||||||||||||||||||||||||||||||||||||||||||||||||||||||||||||||||||||||||||||||||||
| Morse Fall Seale | – | 46.50 ± 10.81 | – | ||||||||||||||||||||||||||||||||||||||||||||||||||||||||||||||||||||||||||||||||||||||||||||||||
| Braden Scale | – | 20.50 ± 2.32 | – | ||||||||||||||||||||||||||||||||||||||||||||||||||||||||||||||||||||||||||||||||||||||||||||||||
| Padua Prediction Score | – | 2.70 ± 2.06 | – | ||||||||||||||||||||||||||||||||||||||||||||||||||||||||||||||||||||||||||||||||||||||||||||||||
| Abbreviations: MMSE: Mini-Mental Status Examination; MoCA: Montreal Cognitive Assessment; Barthel: The Barthel index and data are presented as mean ± SD or number of patients. | |||||||||||||||||||||||||||||||||||||||||||||||||||||||||||||||||||||||||||||||||||||||||||||||||||
Table 2. The blood marker detection results.
| Control group (n = 10) | PSCI group (n = 10) | P-value | |||||||||||||||||||||||||||||||||||||||||||||||||||||||||||||||||||||||||||||||||||||||||||||||||
| Blood coagulation function | |||||||||||||||||||||||||||||||||||||||||||||||||||||||||||||||||||||||||||||||||||||||||||||||||||
| PT% | 102.13 ± 9.67 | 91.90 ± 7.58 | 0.027* | ||||||||||||||||||||||||||||||||||||||||||||||||||||||||||||||||||||||||||||||||||||||||||||||||
| INR ratio | 1.00 ± 0.05 | 1.06 ± 0.06 | 0.045* | ||||||||||||||||||||||||||||||||||||||||||||||||||||||||||||||||||||||||||||||||||||||||||||||||
| Activated partial thromboplastin time | 30.14 ± 3.99 | 31.33 ± 5.19 | 0.619 | ||||||||||||||||||||||||||||||||||||||||||||||||||||||||||||||||||||||||||||||||||||||||||||||||
| Fibrinogen content | 2.61 ± 0.26 | 2.80 ± 0.62 | 0.470 | ||||||||||||||||||||||||||||||||||||||||||||||||||||||||||||||||||||||||||||||||||||||||||||||||
| Thrombin time | 15.37 ± 1.16 | 14.86 ± 1.33 | 0.424 | ||||||||||||||||||||||||||||||||||||||||||||||||||||||||||||||||||||||||||||||||||||||||||||||||
| D-dimer | 62.43 ± 27.65 | 118.6 ± 73.42 | 0.075 | ||||||||||||||||||||||||||||||||||||||||||||||||||||||||||||||||||||||||||||||||||||||||||||||||
| Blood biochemistry | |||||||||||||||||||||||||||||||||||||||||||||||||||||||||||||||||||||||||||||||||||||||||||||||||||
| Serum creatinine | 61.40 ± 14.89 | 60.60 ± 21.26 | 0.923 | ||||||||||||||||||||||||||||||||||||||||||||||||||||||||||||||||||||||||||||||||||||||||||||||||
| Glucose | 6.54 ± 2.35 | 8.87 ± 3.68 | 0.109 | ||||||||||||||||||||||||||||||||||||||||||||||||||||||||||||||||||||||||||||||||||||||||||||||||
| Albumin | 39.07 ± 4.57 | 38.44 ± 4.52 | 0.760 | ||||||||||||||||||||||||||||||||||||||||||||||||||||||||||||||||||||||||||||||||||||||||||||||||
| Calcium | 2.29 ± 0.09 | 2.34 ± 0.13 | 0.368 | ||||||||||||||||||||||||||||||||||||||||||||||||||||||||||||||||||||||||||||||||||||||||||||||||
| Total bilirubin | 13.69 ± 3.55 | 19.93 ± 8.57 | 0.047* | ||||||||||||||||||||||||||||||||||||||||||||||||||||||||||||||||||||||||||||||||||||||||||||||||
| Direct bilirubin | 3.23 ± 1.10 | 4.54 ± 2.47 | 0.143 | ||||||||||||||||||||||||||||||||||||||||||||||||||||||||||||||||||||||||||||||||||||||||||||||||
| Indirect bilirubin | 10.46 ± 3.32 | 15.39 ± 6.43 | 0.045* | ||||||||||||||||||||||||||||||||||||||||||||||||||||||||||||||||||||||||||||||||||||||||||||||||
| Alanine aminotransferase | 17.30 ± 6.45 | 24.90 ± 13.16 | 0.118 | ||||||||||||||||||||||||||||||||||||||||||||||||||||||||||||||||||||||||||||||||||||||||||||||||
| Aspartate aminotransferase | 19.40 ± 4.27 | 34.40 ± 35.08 | 0.196 | ||||||||||||||||||||||||||||||||||||||||||||||||||||||||||||||||||||||||||||||||||||||||||||||||
| Lactate dehydrogenase | 152.67 ± 29.82 | 210.90 ± 47.47 | 0.006** | ||||||||||||||||||||||||||||||||||||||||||||||||||||||||||||||||||||||||||||||||||||||||||||||||
| Hydroxybutyric acid dehydrogenase | 114.33 ± 22.87 | 154.50 ± 40.21 | 0.017* | ||||||||||||||||||||||||||||||||||||||||||||||||||||||||||||||||||||||||||||||||||||||||||||||||
| γ-glutamyltransferase | 17.70 ± 6.63 | 29.50 ± 18.85 | 0.078 | ||||||||||||||||||||||||||||||||||||||||||||||||||||||||||||||||||||||||||||||||||||||||||||||||
| Alkaline phosphatase | 60.89 ± 8.62 | 69.70 ± 20.31 | 0.245 | ||||||||||||||||||||||||||||||||||||||||||||||||||||||||||||||||||||||||||||||||||||||||||||||||
| Adenylate dehydrogenase | 10.00 ± 2.87 | 10.70 ± 5.44 | 0.735 | ||||||||||||||||||||||||||||||||||||||||||||||||||||||||||||||||||||||||||||||||||||||||||||||||
| Serum lipid | |||||||||||||||||||||||||||||||||||||||||||||||||||||||||||||||||||||||||||||||||||||||||||||||||||
| Total cholesterol | 4.38 ± 0.56 | 4.18 ± 1.46 | 0.691 | ||||||||||||||||||||||||||||||||||||||||||||||||||||||||||||||||||||||||||||||||||||||||||||||||
| Apolipoprotein A1 | 1.17 ± 0.11 | 1.10 ± 0.17 | 0.401 | ||||||||||||||||||||||||||||||||||||||||||||||||||||||||||||||||||||||||||||||||||||||||||||||||
| Apolipoprotein B | 0.83 ± 0.23 | 0.74 ± 0.26 | 0.501 | ||||||||||||||||||||||||||||||||||||||||||||||||||||||||||||||||||||||||||||||||||||||||||||||||
| High-density lipoprotein | 0.98 ± 0.15 | 0.84 ± 0.13 | 0.045* | ||||||||||||||||||||||||||||||||||||||||||||||||||||||||||||||||||||||||||||||||||||||||||||||||
| Low density lipoprotein | 2.62 ± 0.55 | 2.42 ± 1.25 | 0.662 | ||||||||||||||||||||||||||||||||||||||||||||||||||||||||||||||||||||||||||||||||||||||||||||||||
| Lipoprotein (a) | 182.00 ± 115.42 | 267.78 ± 176.09 | 0.285 | ||||||||||||||||||||||||||||||||||||||||||||||||||||||||||||||||||||||||||||||||||||||||||||||||
| Homocysteine | 13.63 ± 3.75 | 15.78 ± 7.62 | 0.512 | ||||||||||||||||||||||||||||||||||||||||||||||||||||||||||||||||||||||||||||||||||||||||||||||||
| Values are mean ± SD. *P < 0.05, **P < 0.01. | |||||||||||||||||||||||||||||||||||||||||||||||||||||||||||||||||||||||||||||||||||||||||||||||||||
Isolation and characterization results of plasma exosomes
The content detection results of plasma protein in 0.5 mL fraction sample were shown in Figure 1A. The content of plasma protein in fractions 6–10 is relatively lower, and the purity of exosomes is relatively high. Therefore, the 5 vesicle fractions 6–10 were selected for subsequent analysis. Western blot analysis was utilized to detect the exosomal protein markers in all the plasma exosome samples. The exosomal markers of protein expression levels (TSG101, CD9, CD63, and CD81) were shown in Figure 1B. The exosome morphology and size were visualized by TEM (Figure 1C). TEM observation revealed highly homogenous exosome combination with a regular round morphology having a diameter range of 30–200 nm. A representative laser scattering microscopy image of isolated exosomes is shown in Figure 1D. NTA was exploited to measure the size distribution of particles and view the isolated vesicle samples (Figure 1E, 1F). The samples fluorescent detection examined in the scatter mode. The size is calculated by the diffusion behavior. The study determined that the mean size of the particles was 71.6 nm, while the concentration was estimated to be around 6.8E+7 particles/mL.
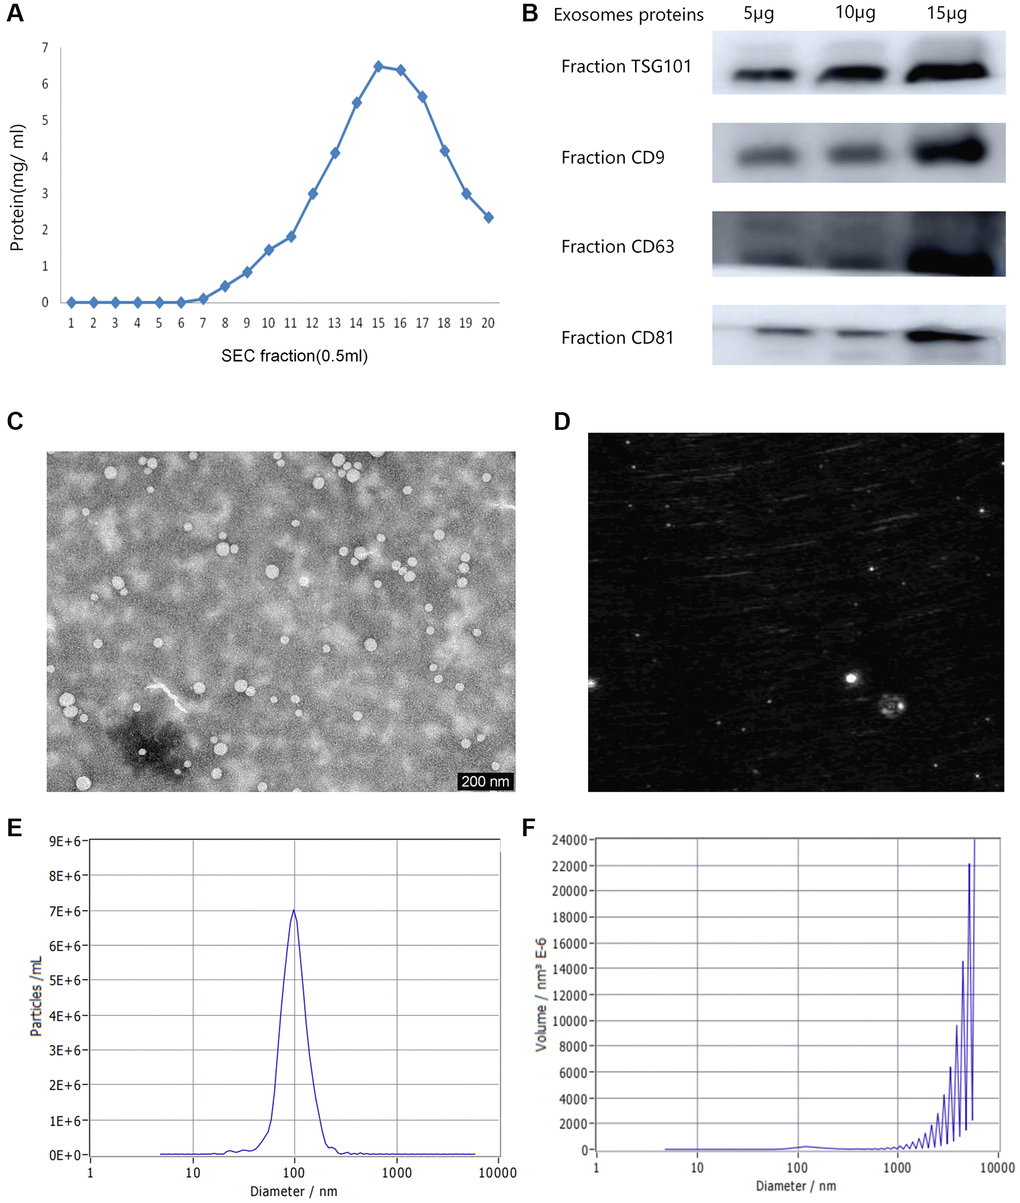
Figure 1. Various characterizations of plasma exosomes. (A) The content of plasma proteins in 0.5 mL fraction sample. (B) Western blot analysis of the typical exosomal proteins, TSG 101, CD9, CD63 and CD81. (C) Transmission electron microscopy (TEM) image indicating exosome morphology. (D) A representative laser scattering microscopy image of isolated exosomes. (E) The Nanoparticle tracking analysis (NTA) result of the particle size distribution for isolated exosomes. (F) The size distribution of volume consistent with the size range of exosomes.
Differentially expressed exosome proteins determination among the control and PSCI groups
In total, 259 differentially expressed exosome proteins have been measured and determined between the control group and PSCI group by Label-free quantitative proteomics, of which 131 proteins demonstrated up-regulated expression and 128 proteins showed down-regulated expression. The differentially expressed proteins with PSCI/control ratios that are high or less than 1.2-fold change having a set P-value < 0.05 were shown to be significantly changed. The differentially expressed proteins volcano plot was presented in Figure 2. The heat map of the whole differential expressed proteins were presented in Figure 3. The identification results of main 30 up-regulated proteins were presented in Table 3 and the other 101 up-regulated proteins were shown in Supplementary Table 1. The identification results of main 30 down-regulated proteins were shown in Table 4 and the other 98 down-regulated proteins were shown in Supplementary Table 2. The results of these proteins are summarized in detail. According to Table 5, the biological process category of 30 up-regulated proteins and molecular function were conducted according to biological function. The biological process category of 27 down-regulated proteins and molecular function were shown in Table 6.
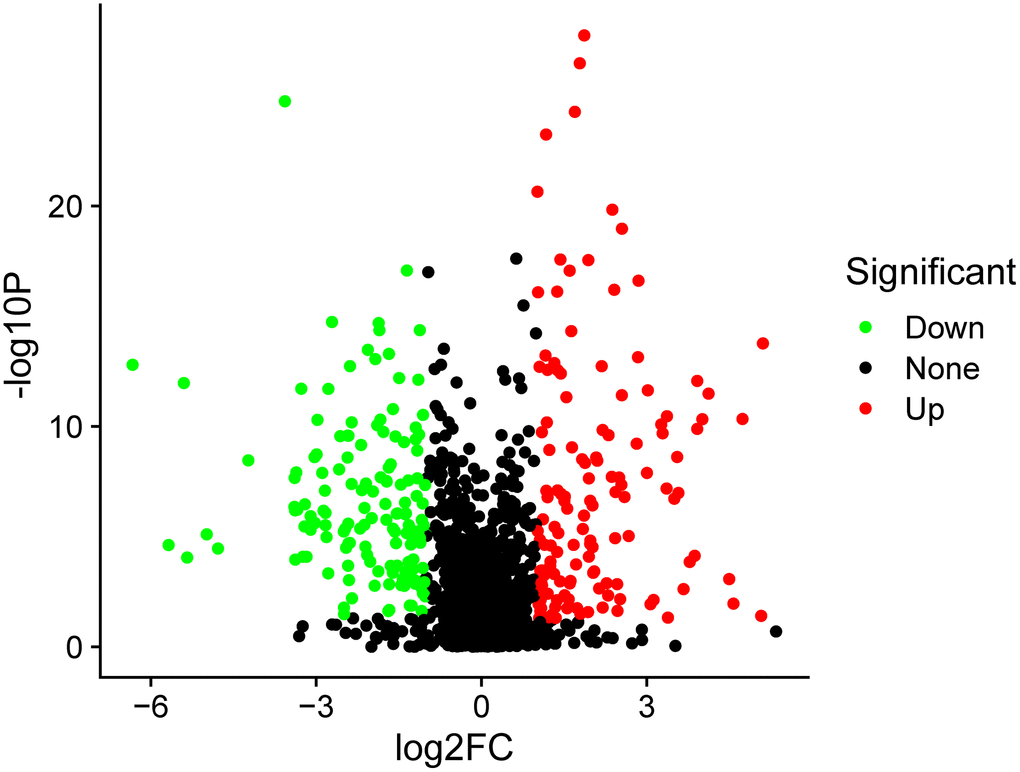
Figure 2. The volcano plot of differentially expressed proteins. The red points represented up-regulated proteins and green points represented down-regulated proteins between the PSCI and control groups.
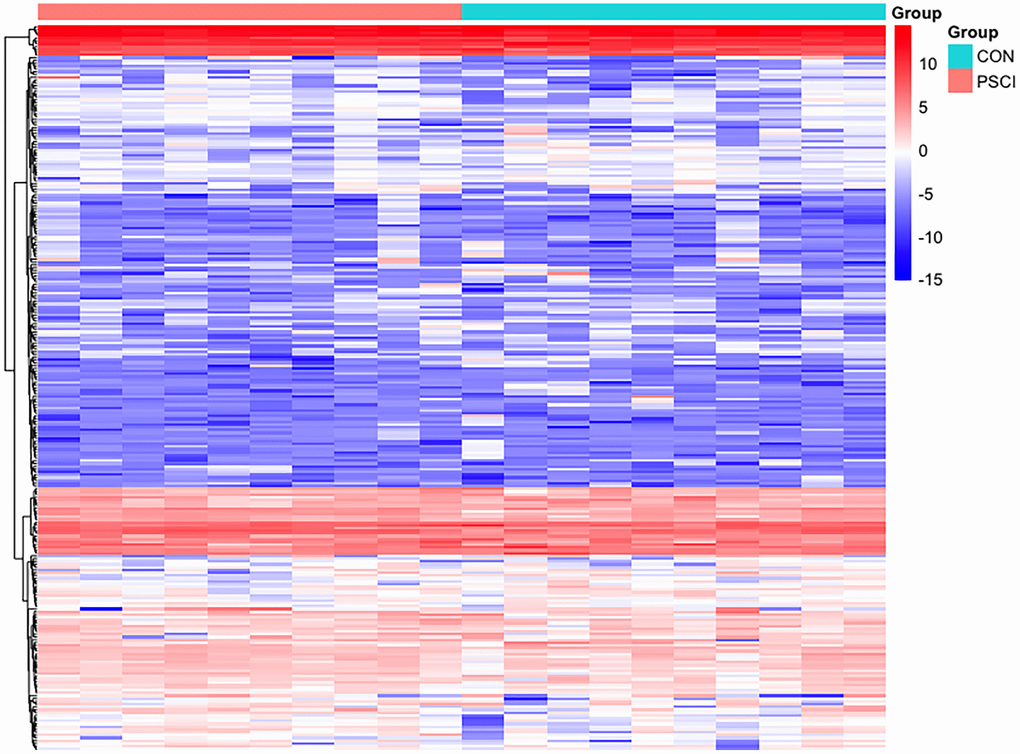
Figure 3. Hierarchical clustering of plasma exosome proteomes. The heat map represented the Z scores of all proteins quantified in Label-free quantitative proteomics.
Table 3. The identification results of main 30 up-regulated proteins between the PSCI group and control group.
| No. | Accession No. | Protein name | Symbol | Exp. Mr (KDa) | Protein score | Fold change (PSCI/Control) | P-value | ||||||||||||||||||||||||||||||||||||||||||||||||||||||||||||||||||||||||||||||||||||||||||||
| 1 | P63104 | 14-3-3 protein zeta/delta | YWHAZ | 27.75 | 177.81 | 2.13 | <0.001 | ||||||||||||||||||||||||||||||||||||||||||||||||||||||||||||||||||||||||||||||||||||||||||||
| 2 | P31947 | 14-3-3 protein sigma | SFN | 27.77 | 8.19 | 3.04 | <0.01 | ||||||||||||||||||||||||||||||||||||||||||||||||||||||||||||||||||||||||||||||||||||||||||||
| 3 | Q9UQB8 | Brain-specific angiogenesis inhibitor 1-associated protein 2 | BAIAP2 | 60.87 | 43.47 | 4.95 | <0.01 | ||||||||||||||||||||||||||||||||||||||||||||||||||||||||||||||||||||||||||||||||||||||||||||
| 4 | P78417 | Glutathione S-transferase omega-1 | GSTO1 | 25.90 | 27.57 | 3.00 | <0.01 | ||||||||||||||||||||||||||||||||||||||||||||||||||||||||||||||||||||||||||||||||||||||||||||
| 5 | P61421 | V-type proton ATPase subunit d 1 | ATP6V0D1 | 40.33 | 8.42 | 2.91 | <0.01 | ||||||||||||||||||||||||||||||||||||||||||||||||||||||||||||||||||||||||||||||||||||||||||||
| 6 | P34932 | Heat shock 70 kDa protein 4 | HSPA4 | 94.33 | 7.37 | 7.05 | <0.01 | ||||||||||||||||||||||||||||||||||||||||||||||||||||||||||||||||||||||||||||||||||||||||||||
| 7 | P40197 | Platelet glycoprotein V | GP5 | 60.96 | 49.41 | 5.19 | <0.01 | ||||||||||||||||||||||||||||||||||||||||||||||||||||||||||||||||||||||||||||||||||||||||||||
| 8 | P37235 | Hippocalcin-like protein 1 | HPCAL1 | 22.31 | 5.46 | 5.82 | |||||||||||||||||||||||||||||||||||||||||||||||||||||||||||||||||||||||||||||||||||||||||||||
| 9 | Q9Y6B6 | GTP-binding protein SAR1b | SAR1B | 22.41 | 5.08 | 2.28 | <0.01 | ||||||||||||||||||||||||||||||||||||||||||||||||||||||||||||||||||||||||||||||||||||||||||||
| 10 | P54920 | Alpha-soluble NSF attachment protein | NAPA | 17.26 | 33.23 | 34.53 | <0.01 | ||||||||||||||||||||||||||||||||||||||||||||||||||||||||||||||||||||||||||||||||||||||||||||
| 11 | P13746 | Class I histocompatibility antigen, A-11 alpha chain | HLA-A | 15.44 | 40.94 | 33.79 | <0.05 | ||||||||||||||||||||||||||||||||||||||||||||||||||||||||||||||||||||||||||||||||||||||||||||
| 12 | P51575 | P2X purinoceptor 1 | P2RX1 | 13.33 | 44.98 | 15.11 | <0.01 | ||||||||||||||||||||||||||||||||||||||||||||||||||||||||||||||||||||||||||||||||||||||||||||
| 13 | O76074 | cGMP-specific 3,5-cyclic phosphodiesterase | PDE5A | 17.60 | 99.98 | 11.74 | <0.01 | ||||||||||||||||||||||||||||||||||||||||||||||||||||||||||||||||||||||||||||||||||||||||||||
| 14 | Q13642 | Four and a half LIM domains protein 1 | FHL1 | 16.00 | 36.26 | 8.72 | <0.01 | ||||||||||||||||||||||||||||||||||||||||||||||||||||||||||||||||||||||||||||||||||||||||||||
| 15 | Q9BQE5 | Apolipoprotein L2 | APOL2 | 2.9676 | 37.092 | 5.85 | <0.01 | ||||||||||||||||||||||||||||||||||||||||||||||||||||||||||||||||||||||||||||||||||||||||||||
| 16 | P08648 | Integrin alpha-5 | ITGA5 | 10.36 | 114.54 | 5.73 | <0.01 | ||||||||||||||||||||||||||||||||||||||||||||||||||||||||||||||||||||||||||||||||||||||||||||
| 17 | O94804 | Serine/threonine-protein kinase 10 | STK10 | 11.78 | 112.13 | 3.86 | <0.01 | ||||||||||||||||||||||||||||||||||||||||||||||||||||||||||||||||||||||||||||||||||||||||||||
| 18 | P11169 | Solute carrier family 2, facilitated glucose transporter member 3 | SLC2A3 | 76.41 | 53.92 | 3.65 | <0.01 | ||||||||||||||||||||||||||||||||||||||||||||||||||||||||||||||||||||||||||||||||||||||||||||
| 19 | Q15762 | CD226 antigen | CD226 | 23.75 | 38.61 | 3.45 | <0.01 | ||||||||||||||||||||||||||||||||||||||||||||||||||||||||||||||||||||||||||||||||||||||||||||
| 20 | Q93084 | Sarcoplasmic/endoplasmic reticulum calcium ATPase 3 | ATP2A3 | 17.16 | 113.98 | 3.04 | <0.01 | ||||||||||||||||||||||||||||||||||||||||||||||||||||||||||||||||||||||||||||||||||||||||||||
| 21 | O00194 | Ras-related protein Rab-27B | RAB27B | 21.19 | 24.61 | 2.69 | <0.01 | ||||||||||||||||||||||||||||||||||||||||||||||||||||||||||||||||||||||||||||||||||||||||||||
| 22 | Q9NP79 | Vacuolar protein sorting- associated protein VTA1 homolog | VTA1 | 28.89 | 33.88 | 2.63 | <0.01 | ||||||||||||||||||||||||||||||||||||||||||||||||||||||||||||||||||||||||||||||||||||||||||||
| 23 | P14770 | Platelet glycoprotein IX | GP9 | 71.37 | 19.05 | 2.61 | <0.01 | ||||||||||||||||||||||||||||||||||||||||||||||||||||||||||||||||||||||||||||||||||||||||||||
| 24 | Q9UN37 | Vacuolar protein sorting- associated protein 4A | VPS4A | 11.56 | 48.897 | 2.37 | <0.001 | ||||||||||||||||||||||||||||||||||||||||||||||||||||||||||||||||||||||||||||||||||||||||||||
| 25 | Q08830 | Fibrinogen-like protein 1 | FGL1 | 2.9253 | 36.379 | 9.61 | <0.001 | ||||||||||||||||||||||||||||||||||||||||||||||||||||||||||||||||||||||||||||||||||||||||||||
| 26 | P02763 | Alpha-1-acid glycoprotein 1 | ORM1 | 13.49 | 23.51 | 2.12 | <0.01 | ||||||||||||||||||||||||||||||||||||||||||||||||||||||||||||||||||||||||||||||||||||||||||||
| 27 | P02749 | Beta-2-glycoprotein 1 | APOH | 233.67 | 38.30 | 2.11 | <0.01 | ||||||||||||||||||||||||||||||||||||||||||||||||||||||||||||||||||||||||||||||||||||||||||||
| 28 | P55058 | Phospholipid transfer protein | PLTP | 20.08 | 54.74 | 2.10 | <0.01 | ||||||||||||||||||||||||||||||||||||||||||||||||||||||||||||||||||||||||||||||||||||||||||||
| 29 | P30273 | High affinity immunoglobulin epsilon receptor subunit gamma | FCER1G | 10.82 | 9.67 | 2.04 | <0.01 | ||||||||||||||||||||||||||||||||||||||||||||||||||||||||||||||||||||||||||||||||||||||||||||
| 30 | P01624 | Ig kappa chain V-III region POM | IGKV3-15 | 17.61 | 11.92 | 2.03 | <0.01 | ||||||||||||||||||||||||||||||||||||||||||||||||||||||||||||||||||||||||||||||||||||||||||||
| In the title line, Exp. Mr represented the experimental molecular weight of the proteins. | |||||||||||||||||||||||||||||||||||||||||||||||||||||||||||||||||||||||||||||||||||||||||||||||||||
Table 4. The identification results of main 30 down-regulated proteins between the PSCI group and control group.
| No. | Accession No. | Target protein | Symbol | Exp. Mr (KDa) | Protein score | Fold change (PSCI/Control) | P-value | ||||||||||||||||||||||||||||||||||||||||||||||||||||||||||||||||||||||||||||||||||||||||||||
| 1 | P06276 | Cholinesterase | BCHE | 12.41 | 68.42 | 0.41 | <0.05 | ||||||||||||||||||||||||||||||||||||||||||||||||||||||||||||||||||||||||||||||||||||||||||||
| 2 | P01880 | Ig delta chain C region | IGHD | 42.25 | 17.46 | 0.02 | <0.01 | ||||||||||||||||||||||||||||||||||||||||||||||||||||||||||||||||||||||||||||||||||||||||||||
| 3 | P04438 | Ig heavy chain V-II region SESS | 16.32 | 4.15 | 0.18 | <0.01 | |||||||||||||||||||||||||||||||||||||||||||||||||||||||||||||||||||||||||||||||||||||||||||||
| 4 | P01771 | Ig heavy chain V-III region HIL | 13.44 | 39.48 | 0.27 | <0.01 | |||||||||||||||||||||||||||||||||||||||||||||||||||||||||||||||||||||||||||||||||||||||||||||
| 5 | P01778 | Ig heavy chain V-III region ZAP | 12.34 | 6.03 | 0.10 | <0.01 | |||||||||||||||||||||||||||||||||||||||||||||||||||||||||||||||||||||||||||||||||||||||||||||
| 6 | P07357 | Complement component C8 alpha chain | C8A | 65.16 | 22.61 | 0.14 | <0.01 | ||||||||||||||||||||||||||||||||||||||||||||||||||||||||||||||||||||||||||||||||||||||||||||
| 7 | P20618 | Proteasome subunit beta type-1 | PSMB1 | 26.49 | 12.65 | 0.11 | <0.01 | ||||||||||||||||||||||||||||||||||||||||||||||||||||||||||||||||||||||||||||||||||||||||||||
| 8 | Q9P289 | Serine/threonine-protein kinase 26 | STK26 | 46.53 | 2.66 | 0.13 | <0.01 | ||||||||||||||||||||||||||||||||||||||||||||||||||||||||||||||||||||||||||||||||||||||||||||
| 9 | Q99536 | Synaptic vesicle membrane protein VAT-1 homolog | VAT1 | 8.1909 | 41.92 | 0.48 | <0.01 | ||||||||||||||||||||||||||||||||||||||||||||||||||||||||||||||||||||||||||||||||||||||||||||
| 10 | P03952 | Plasma kallikrein | KLKB1 | 71.37 | 7.30 | 0.20 | <0.01 | ||||||||||||||||||||||||||||||||||||||||||||||||||||||||||||||||||||||||||||||||||||||||||||
| 11 | P53396 | ATP-citrate synthase | ACLY | 120.84 | 21.57 | 0.41 | <0.01 | ||||||||||||||||||||||||||||||||||||||||||||||||||||||||||||||||||||||||||||||||||||||||||||
| 12 | Q9NP58 | ATP-binding cassette sub-family B member 6, mitochondrial | ABCB6 | 93.88 | 4.74 | 0.24 | <0.01 | ||||||||||||||||||||||||||||||||||||||||||||||||||||||||||||||||||||||||||||||||||||||||||||
| 13 | P62330 | ADP-ribosylation factor 6 | ARF6 | 20.08 | 11.40 | 0.26 | <0.05 | ||||||||||||||||||||||||||||||||||||||||||||||||||||||||||||||||||||||||||||||||||||||||||||
| 14 | P10809 | 60 kDa heat shock protein, mitochondrial | HSPD1 | 61.05 | 88.42 | 0.47 | <0.01 | ||||||||||||||||||||||||||||||||||||||||||||||||||||||||||||||||||||||||||||||||||||||||||||
| 15 | O15162 | Phospholipid scramblase 1 | PLSCR1 | 35.05 | 10.23 | 0.11 | <0.01 | ||||||||||||||||||||||||||||||||||||||||||||||||||||||||||||||||||||||||||||||||||||||||||||
| 16 | Q99828 | Calcium and integrin-binding protein 1 | CIB1 | 21.70 | 8.13 | 0.11 | <0.01 | ||||||||||||||||||||||||||||||||||||||||||||||||||||||||||||||||||||||||||||||||||||||||||||
| 17 | Q5D862 | Filaggrin-2 | FLG2 | 248.07 | 81.40 | 0.12 | <0.01 | ||||||||||||||||||||||||||||||||||||||||||||||||||||||||||||||||||||||||||||||||||||||||||||
| 18 | Q8WXI7 | Mucin-16 | MUC16 | 2284.30 | 8.38 | 0.13 | <0.01 | ||||||||||||||||||||||||||||||||||||||||||||||||||||||||||||||||||||||||||||||||||||||||||||
| 19 | P56199 | Integrin alpha-1 | CFHR1 | 130.85 | 4.11 | 0.14 | <0.01 | ||||||||||||||||||||||||||||||||||||||||||||||||||||||||||||||||||||||||||||||||||||||||||||
| 20 | P25311 | Zinc-alpha-2-glycoprotein | AZGP1 | 34.26 | 8.18 | 0.15 | <0.01 | ||||||||||||||||||||||||||||||||||||||||||||||||||||||||||||||||||||||||||||||||||||||||||||
| 21 | P02545 | Prelamin-A/C | LMNA | 74.14 | 26.39 | 0.01 | <0.01 | ||||||||||||||||||||||||||||||||||||||||||||||||||||||||||||||||||||||||||||||||||||||||||||
| 22 | P30486 | Class I histocompatibility antigen, B-48 alpha chain | HLA-B | 40.36 | 29.55 | 0.03 | <0.01 | ||||||||||||||||||||||||||||||||||||||||||||||||||||||||||||||||||||||||||||||||||||||||||||
| 23 | Q9NP59 | Solute carrier family 40-member 1 | SLC40A1 | 62.54 | 9.51 | 0.10 | <0.01 | ||||||||||||||||||||||||||||||||||||||||||||||||||||||||||||||||||||||||||||||||||||||||||||
| 24 | P13164 | Interferon-induced transmembrane protein 1 | IFITM1 | 13.96 | 6.85 | 0.10 | <0.01 | ||||||||||||||||||||||||||||||||||||||||||||||||||||||||||||||||||||||||||||||||||||||||||||
| 25 | O14818 | Proteasome subunit alpha type-7 | PSMA7 | 27.89 | 17.47 | 0.17 | <0.01 | ||||||||||||||||||||||||||||||||||||||||||||||||||||||||||||||||||||||||||||||||||||||||||||
| 26 | P22234 | Multifunctional protein ADE2 | PAICS | 47.08 | 10.28 | 0.17 | <0.01 | ||||||||||||||||||||||||||||||||||||||||||||||||||||||||||||||||||||||||||||||||||||||||||||
| 27 | P30153 | Serine/threonine-protein phosphatase 2A 65 kDa regulatory subunit A alpha isoform | PPP2R1A | 65.31 | 10.92 | 0.18 | <0.01 | ||||||||||||||||||||||||||||||||||||||||||||||||||||||||||||||||||||||||||||||||||||||||||||
| 28 | Q9HCM2 | Plexin-A4 | PLXNA4 | 212.45 | 5.19 | 0.18 | <0.05 | ||||||||||||||||||||||||||||||||||||||||||||||||||||||||||||||||||||||||||||||||||||||||||||
| 29 | Q8NG06 | E3 ubiquitin-protein ligase TRIM58 | TRIM58 | 54.77 | 29.55 | 0.18 | <0.05 | ||||||||||||||||||||||||||||||||||||||||||||||||||||||||||||||||||||||||||||||||||||||||||||
| 30 | Q9BS26 | Endoplasmic reticulum resident protein 44 | ERP44 | 46.97 | 3.45 | 0.19 | <0.01 | ||||||||||||||||||||||||||||||||||||||||||||||||||||||||||||||||||||||||||||||||||||||||||||
| In the title line, Exp. Mr represented the experimental molecular weight of the proteins. | |||||||||||||||||||||||||||||||||||||||||||||||||||||||||||||||||||||||||||||||||||||||||||||||||||
Table 5. The molecular function and biological process category of main 30 up-regulated expressed proteins in PSCI.
| No. | Target protein | Molecular function | Biological process |
| 1 | 14-3-3 protein zeta/delta | Cadherin binding; ion channel binding; protein domain specific binding; protein kinase binding | Establishment of Golgi localization; protein insertion into mitochondrial membrane involved in apoptotic signaling pathway; synaptic target recognition |
| 2 | 14-3-3 protein sigma | Cadherin and phosphoprotein binding; protein kinase C inhibitor activity | Intrinsic apoptotic signaling pathway; regulation of protein insertion into mitochondrial membrane involved in apoptotic signaling pathway; release of cytochrome c from mitochondria |
| 3 | Brain-specific angiogenesis inhibitor 1-associated protein 2 | Cadherin binding involved in cell-cell adhesion; identical protein binding; proline-rich region binding; scaffold protein binding; transcription cofactor binding | Axonogenesis; cellular response to L-glutamate; modification of synaptic structure, modulating synaptic transmission; regulation of synaptic plasticity; vascular endothelial growth factor receptor signaling pathway |
| 4 | Glutathione S-transferase omega-1 | Glutathione dehydrogenase (ascorbate) activity; glutathione transferase activity; methylarsonate reductase activity; oxidoreductase activity | L-ascorbic acid metabolic process; cellular response to arsenic-containing substance; glutathione derivative biosynthetic process; interleukin-12 mediated signaling pathway |
| 5 | V-type proton ATPase subunit d 1 | Proton-exporting ATPase activity, phosphorylative mechanism proton-transporting ATPase activity | IRE1-mediated unfolded protein response; cellular iron ion homeostasis; cellular response to increased oxygen levels; phagosome acidification; proton transmembrane transport |
| 6 | Heat shock 70 kDa protein 4 | ATP binding | Chaperone-mediated protein complex assembly; protein insertion into mitochondrial outer membrane; response to unfolded protein |
| 7 | Platelet glycoprotein V | Mediates vWF-dependent platelet adhesion to blood vessels | Blood coagulation, intrinsic pathway; cell adhesion; platelet activation |
| 8 | Hippocalcin-like protein 1 | Calcium ion binding | |
| 9 | GTP-binding protein SAR1b | GTP binding; GTPase activity; metal ion binding | Antigen processing and presentation of exogenous peptide antigen via MHC class I and II; endoplasmic reticulum to Golgi vesicle-mediated transport; intracellular protein transport; |
| 10 | Alpha-soluble NSF attachment protein | Protein containing complex binding; soluble NSF attachment protein activity; syntaxin binding | Endoplasmic reticulum to Golgi vesicle mediated transport; synaptic vesicle priming; synaptic transmission, glutamatergic |
| 11 | P2X purinoceptor 1 | ATP binding; ATP-gated ion channel activity; extracellularly ATP-gated cation channel activity; purinergic nucleotide receptor activity; zinc ion binding | Apoptotic process; calcium ion transport; neuronal action potential; Regulation of presynaptic cytosolic calcium ion concentration; synaptic transmission |
| 12 | cGMP-specific 3,5-cyclic phosphodiesterase | 3′,5′-cyclic-GMP phosphodiesterase activity; cGMP binding; metal ion binding | cGMP catabolic process; MAP kinase activity; regulation of nitric oxide mediated signal transduction |
| 13 | Four and a half LIM domains protein 1 | Ion channel binding; metal ion binding | Cell differentiation; potassium ion transport; membrane depolarization; regulation of potassium ion transmembrane transporter activity |
| 14 | Apolipoprotein L2 | High density lipoprotein particle binding; lipid binding; signaling receptor binding | Cholesterol metabolic process; lipid metabolic process; lipid transport; lipoprotein metabolic process |
| 15 | Tetraspanin-32 | Cytoskeleton organization | Cell-cell signaling; defense response to protozoan; integrin mediated signaling pathway; platelet aggregation; |
| 16 | Integrin alpha-5 | Epidermal growth factor receptor binding; metal ion binding; platelet derived growth factor receptor binding; vascular endothelial growth factor receptor 2 binding | Angiogenesis; cell adhesion; cell substrate junction assembly; endodermal cell differentiation; cell migration; peptidyl tyrosine phosphorylation; |
| 17 | Serine/threonine-protein kinase 10 | ATP binding; identical protein binding; protein homodimerization activity; protein serine/threonine kinase activity | Activation of protein kinase activity; lymphocyte aggregation and migration; neutrophil degranulation; protein autophosphorylation; |
| 18 | Solute carrier family 2, facilitated glucose transporter member 3 | Glucose binding; glucose transmembrane transporter activity | L-ascorbic acid metabolic process; carbohydrate metabolic process; glucose transmembrane transport; neutrophil degranulation |
| 19 | CD226 antigen | Cell adhesion molecule binding; integrin binding; protein kinase binding | Cell recognition; cytokine production; T cell receptor signaling pathway; immunoglobulin mediated immune response; interferon-gamma production |
| 20 | Sarcoplasmic/endoplasmic reticulum calcium ATPase 3 | ATP binding; calcium transmembrane transporter activity; metal ion binding; proton exporting ATPase activity | Calcium ion transmembrane transport; calcium ion transport; cellular calcium ion homeostasis; ion transmembrane transport |
| 21 | Ras-related protein Rab-27B | GDP binding; GTP binding; GTPase activity; myosin V binding; protein domain specific binding | Rab protein signal transduction; anterograde axonal protein transport; intracellular protein transport; multivesicular body sorting pathway; synaptic vesicle endocytosis |
| 22 | Vacuolar protein sorting-associated protein VTA1 homolog | Protein C-terminus binding | ESCRT III complex disassembly; endosomal transport; macroautophagy; multivesicular body assembly; multivesicular body sorting pathway |
| 23 | Platelet glycoprotein IX | Platelet activation apparently involves disruption of the macromolecular complex of GP-Ib with the platelet glycoprotein IX | Blood coagulation, intrinsic pathway; cell adhesion; platelet activation |
| 24 | Vacuolar protein sorting-associated protein 4A | ATP binding; ATPase activity; protein C-terminus binding; protein domain specific binding; protein containing complex binding | Ubiquitin-dependent protein catabolic process via the multivesicular body sorting pathway; exosomal secretion; multivesicular body assembly |
| 25 | Fibrinogen-like protein 1 | Inhibiting inflammatory immune responses and metabolic function | Adaptive immune response |
| 26 | Alpha-1-acid glycoprotein 1 | Functions as transport protein in the blood stream | Inflammatory response; neutrophil degranulation; platelet degranulation; interleukin-1 beta secretion |
| 27 | Beta-2-glycoprotein 1 | Heparin binding; lipid binding; lipoprotein lipase activator activity; phospholipid binding | Angiogenesis; plasminogen activation; platelet degranulation; blood coagulation; regulation of fibrinolysis; triglyceride metabolic process |
| 28 | Phospholipid transfer protein | Ceramide binding and transfer activity; lipid transporter activity; phosphatidic acid binding and transfer activity; | Ceramide transport; high-density lipoprotein particle remodeling; lipid metabolic process; phospholipid transport; cholesterol efflux; vitamin E biosynthetic process |
| 29 | High affinity immunoglobulin epsilon receptor subunit gamma | IgE binding, IgE receptor activity, IgG binding, protein homodimerization activity | Immunoglobulin mediated immune response, innate immune response, neutrophil chemotaxis, T cell differentiation |
| 30 | Ig kappa chain V-III region POM | Antigen binding | Fc-gamma receptor signaling pathway involved in phagocytosis; complement activation, classical pathway; immune response; leukocyte migration; |
Table 6. The molecular function and biological process category of main 27 down-regulated proteins in PSCI.
| No. | Target protein | Molecular function | Biological process |
| 1 | Cholinesterase | Acetylcholinesterase activity; amyloid-beta binding; choline binding; cholinesterase activity; enzyme binding | Choline metabolic process; cocaine metabolic process; neuroblast differentiation; response to alkaloid and folic acid; response to glucocorticoid |
| 2 | Ig delta chain C region | Antigen binding; immunoglobulin receptor binding | B cell receptor signaling pathway; complement activation, classical pathway; innate immune response; positive regulation of interleukin-1 secretion |
| 3 | Complement component C8 alpha chain | Complement binding; protein-containing complex binding | Complement activation, alternative or classical pathway; immune response; regulation of complement activation |
| 4 | Proteasome subunit beta type-1 | Endopeptidase activity; threonine type endopeptidase activity | Proteasomal ubiquitin dependent protein catabolic process; Wnt signaling pathway; post translational protein modification; protein polyubiquitination; |
| 5 | Serine/threonine-protein kinase 26 | ATP binding; magnesium ion binding; protein homodimerization activity; protein kinase activity; protein serine/threonine kinase activity | Activation of protein kinase activity; neuron projection morphogenesis; protein phosphorylation; signal transduction by protein phosphorylation |
| 6 | Angiopoietin-like protein 8 | Hormone activity | cEll maturation; cellular lipid metabolic process; lipid metabolic process; lipoprotein lipase activity; |
| 7 | Plasma kallikrein | Serine-type endopeptidase activity | Factor XII activation; blood coagulation, intrinsic pathway; extracellular matrix disassembly; fibrinolysis; plasminogen activation |
| 8 | ATP-citrate synthase | ATP binding; ATP citrate synthase activity; cofactor binding; metal ion binding | Acetyl-CoA and cholesterol biosynthetic process; citrate metabolic process; coenzyme A metabolic process |
| 9 | ATP-binding cassette sub-family B member 6, mitochondrial | ATP binding; ATPase activity; ATPase-coupled heme transmembrane transporter activity; heme binding | Cellular iron ion homeostasis; heme transport; transmembrane transport |
| 10 | ADP-ribosylation factor 6 | GTP binding; GTPase activity; protein N-terminus binding; thioesterase binding | Intracellular protein transport; maintenance of postsynaptic density structure; protein localization to endosome; synaptic vesicle endocytosis |
| 11 | 60 kDa heat shock protein, mitochondrial | ATP binding; ATPase activity; apolipoprotein binding; chaperone binding | Chaperone-mediated protein complex assembly; B cell activation and cytokine production; protein import into mitochondrial intermembrane space |
| 12 | Phospholipid scramblase 1 | CD4 receptor binding; DNA binding transcription activator activity, calcium ion binding; phospholipid scramblase activity | Apoptotic process; phosphatidylserine biosynthetic process; plasma membrane phospholipid scrambling |
| 13 | Calcium and integrin-binding protein 1 | Ras GTPase binding; calcium ion binding; calcium dependent protein kinase inhibitor activity; protein C-terminus binding; protein kinase binding | Angiogenesis; apoptotic process; cell adhesion; cellular response to DNA damage stimulus and growth factor stimulus; cytoplasmic microtubule organization |
| 14 | Filaggrin-2 | Calcium ion binding; structural constituent of epidermis; transition metal ion binding | Cell adhesion; epidermis morphogenesis; neutrophil degranulation |
| 15 | Mucin-16 | Thought to provide a protective, lubricating barrier against particles and infectious agents at mucosal surfaces | O-glycan processing; cell adhesion; stimulatory C-type lectin receptor signaling pathway |
| 16 | Integrin alpha-1 | Collagen binding; collagen binding involved in cell-matrix adhesion; metal ion binding; protein phosphatase binding; signaling receptor binding | Activation of MAPK activity; neuron projection morphogenesis; neutrophil chemotaxis; neuron apoptotic process; phosphoprotein phosphatase activity; vasodilation |
| 17 | Zinc-alpha-2-glycoprotein | Protein transmembrane transporter activity; ribonuclease activity | Cell adhesion; detection of chemical stimulus involved in sensory perception of bitter taste; retina homeostasis; transmembrane transport |
| 18 | Prelamin-A/C | Identical protein binding; structural molecule activity | Protein localization to nucleus and protein stability; cellular response to hypoxia; nuclear envelope organization; telomere maintenance |
| 19 | class I histocompatibility antigen, B-48 alpha chain | Peptide antigen binding | Antigen processing and presentation of exogenous peptide antigen via MHC class I, TAP-dependent; antigen processing and presentation of exogenous peptide antigen |
| 20 | Solute carrier family 40-member 1 | Iron ion transmembrane transporter activity; peptide hormone binding | Cellular iron ion homeostasis; iron ion export across plasma membrane; iron ion transmembrane transport; lymphocyte homeostasis; spleen trabecula formation |
| 21 | Interferon-induced transmembrane protein 1 | Inhibits the entry of viruses to the host cell cytoplasm, permitting endocytosis, but preventing subsequent viral fusion | Cell surface receptor signaling pathway; response to interferon alpha or beta; type I interferon signaling pathway |
| 22 | Proteasome subunit alpha type-7 | Endopeptidase activity; identical protein binding; threonine-type endopeptidase activity | Ubiquitin dependent protein catabolic process; post translational protein modification; protein deubiquitination; protein polyubiquitination |
| 23 | Multifunctional protein ADE2 | Cadherin binding; phosphoribosylaminoimidazole carboxylase synthase activity | Purine nucleobase biosynthetic process; purine ribonucleoside monophosphate biosynthetic process |
| 24 | Serine/threonine-protein phosphatase 2A 65 kDa regulatory subunit A alpha isoform | Protein antigen binding; protein heterodimerization activity; protein phosphatase regulator activity; protein serine/threonine phosphatase activity | RNA splicing; ceramide metabolic process; peptidyl serine dephosphorylation; protein dephosphorylation |
| 25 | Plexin-A4 | Semaphorin receptor activity | Chemorepulsion of branchiomotor axon; regulation of axonogenesis, axon extension and GTPase activity; semaphorin-plexin signaling pathway involved in axon guidance |
| 26 | E3 ubiquitin-protein ligase TRIM58 | Dynein heavy chain binding; dynein intermediate chain binding; ubiquitin protein ligase activity; zinc ion binding | Protein autoubiquitination; protein polyubiquitination; regulation of nuclear migration along microtubule; ubiquitin dependent protein catabolic process |
| 27 | Endoplasmic reticulum resident protein 44 | Protein disulfide isomerase activity | Cell redox homeostasis; glycoprotein metabolic process; response to endoplasmic reticulum stress and unfolded protein |
GO analysis outcomes of the differentially expressed proteins
A GO analysis was employed to categorize the protein classification, molecular function, cellular composition, biological process, and mechanism.
GO analysis outcomes of the up-regulated proteins
Protein classification results indicated that 7.0%, 5.5%, 4.7%, 4.7%, 5.5%, 3.9% and 4.7% of these 128 up-regulated proteins were cytoskeletal protein, membrane traffic protein, metabolite interconversion enzyme, protein modifying enzyme, protein-binding activity modulator, scaffold/adaptor protein, and transporter, respectively (Figure 4A). Molecular function classification results indicated that 26.6%, 17.2%, 4.7% of these 128 up-regulated proteins were binding, catalytic activity, and transporter activity, respectively (Figure 4B). In biological process classification, the majority of the proteins were identified to be contributed in biological regulation (28.1%), organization of cellular component or biogenesis (18.0%), cellular process (39.8%), localization (18.8%), metabolic process (15.6%), response to stimulus (21.9%), and signaling (16.4%), respectively (Figure 4C). Based on the categorization of pathways, most of these proteins were associated with blood coagulation (4.8%), CCKR signaling map (3.1%), EGF receptor signaling pathway (3.1%), endothelin signaling pathway (3.9%), FGF signaling pathway (3.1%), inflammation induced by chemokine and cytokine signaling pathway (7.0%), integrin signaling pathway (6.3%), PI3 kinase pathway (2.3%) (Figure 5). The blood coagulation pathway included proteinase-activated receptor 4, platelet glycoprotein V, integrin alpha-IIb, platelet glycoprotein Ib alpha chain, platelet glycoprotein Ib beta chain, and platelet glycoprotein IX. The endothelin signaling pathway included endothelin-converting enzyme 1, cAMP-dependent protein kinase catalytic subunit beta, protein kinase C beta type, mitogen-activated protein kinase 1, and guanine nucleotide-binding protein subunit alpha-14.
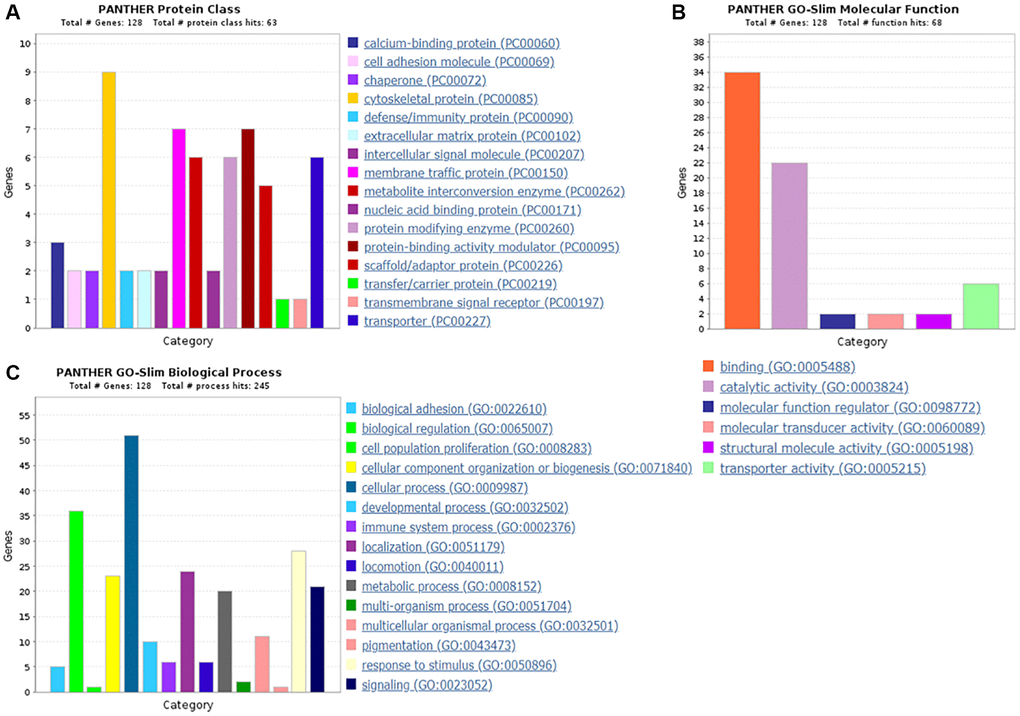
Figure 4. The GO analysis results of up-regulated proteins in the PSCI group. (A) The protein classification of up-regulated proteins. (B) The molecular function of up-regulated proteins. (C) The biological process of up-regulated proteins.
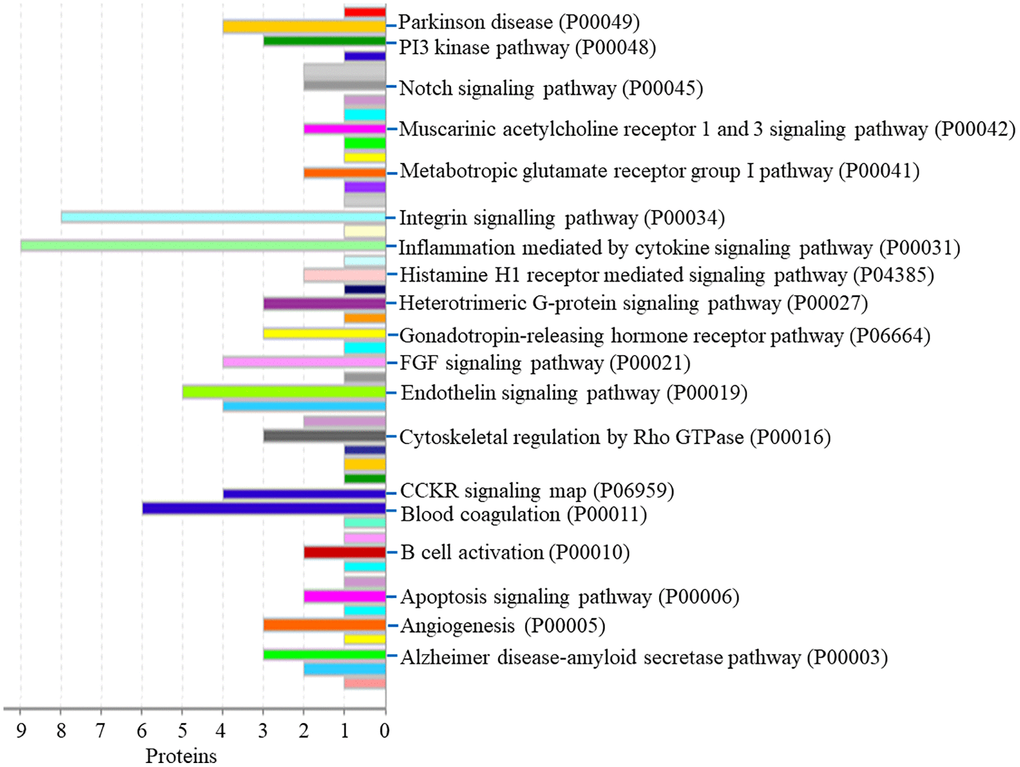
Figure 5. The pathway of up-regulated proteins in the PSCI group.
GO analysis outcomes of the down-regulated proteins
Protein classification results indicated that 5.9%, 5.9%, 8.5%, 3.4%, 10.2% and 4.2% of these 118 down-regulated proteins were cytoskeletal protein, extracellular matrix protein, metabolite interconversion enzyme, nucleic acid binding protein, protein modifying enzyme, and protein-binding activity modulator, respectively (Figure 6A). Molecular function classification results indicated that 28.2%, 24.8%, 5.1%, 2.6% and 5.1% of these down-regulated proteins were binding, catalytic activity, molecular function regulator, molecular transducer activity and transporter activity, respectively (Figure 6B). Throughout the biological process classification, the majority of the proteins were identified to be contributed in biological regulation (20.3%), cellular composition organization or biogenesis (18.6%), cellular process (39.0%), immune system process (6.8%), localization (13.6%), metabolic process (21.2%), multicellular organismal process (9.3%), response to stimulus (16.1%) and signaling (9.3%) (Figure 6C). Based on the categorization of pathways, most of these proteins were connected to gonadotropin-releasing hormone receptor pathway (1.7%) and ubiquitin proteasome pathway (1.7%) (Figure 7). The chemokine and cytokine signaling pathway which induced the inflammation included rho-related GTP-binding protein, platelet factor 4 variant, C5a anaphylatoxin chemotactic receptor 1, and C-X-C chemokine receptor type 2. The integrin signaling pathway included collagen alpha-1(I) chain, collagen alpha-2(I) chain, integrin alpha-1, and ADP-ribosylation factor 6.
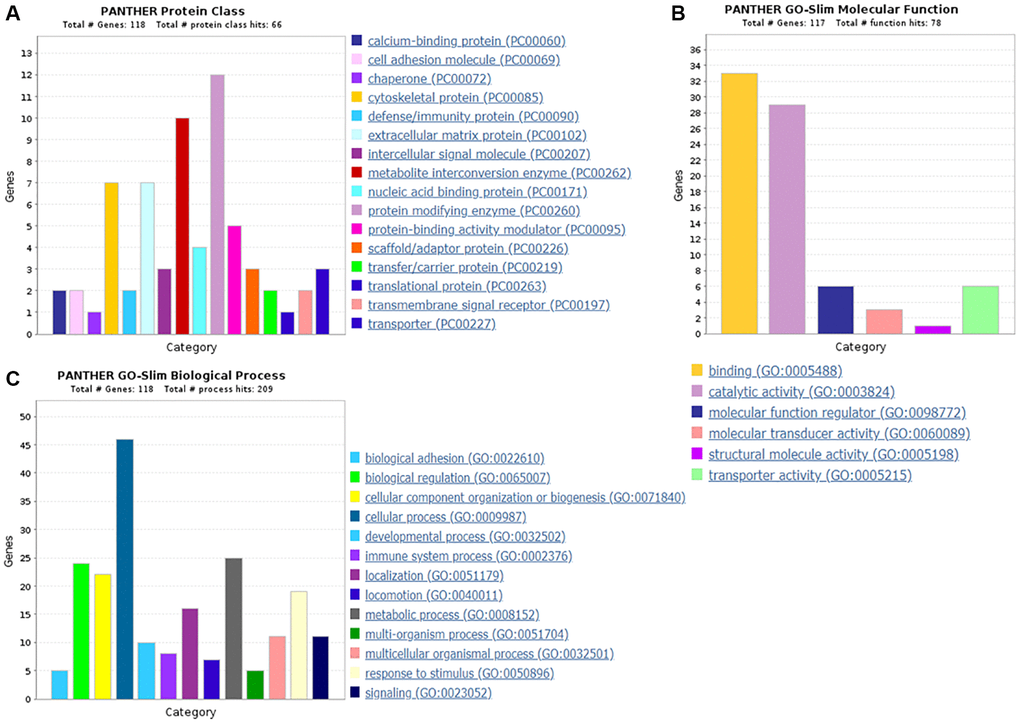
Figure 6. The GO analysis results of down-regulated proteins in the PSCI group. (A) The protein classification of down-regulated proteins. (B) The molecular function of down-regulated proteins. (C) The biological process of down-regulated proteins.
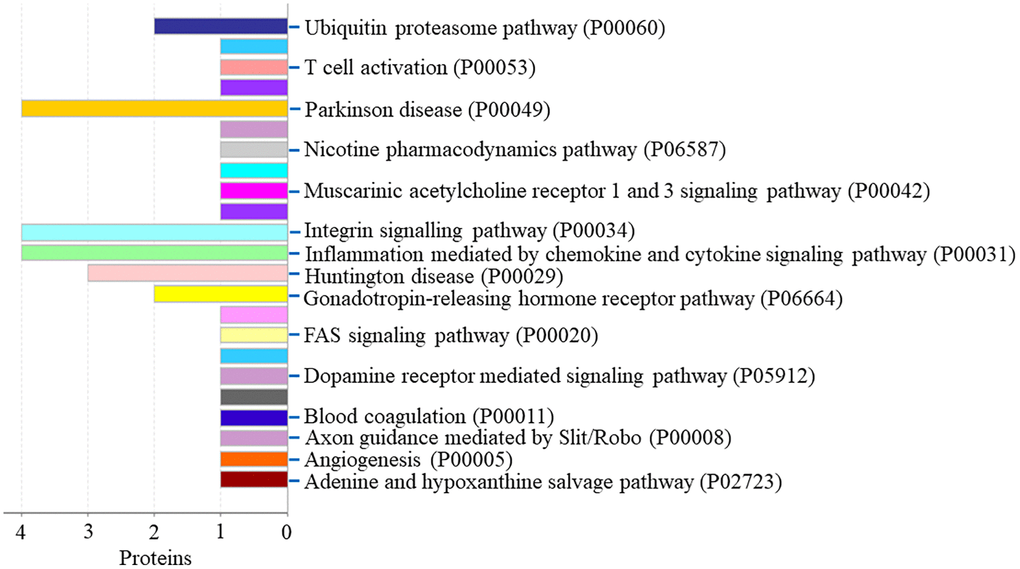
Figure 7. The pathway of down-regulated proteins in the PSCI group.
PPI networks analysis results
PPI networks analysis results of the up-regulated proteins
Utilizing STRING analysis, a controlled PPI network with high-quality was constructed. 127 up-regulated proteins were suitable for PPI network analysis (focus molecule) and PPI networks with high-quality were built according to the STRING database. A complete PPI regulation network with 127 up-regulated proteins were presented in Figure 8. The network clustering results showed that the PPI network consists of six specified function clusters that comprise proteins with similar functions and are expressed by various colors (Figure 9). These six visualized interaction function clusters (sub-networks) were related to degradation of ubiquitinated proteins and folding of proteins (lime green), calcium-dependent protein binding and ESCRT III complex disassembly (yellow), cytoskeleton reorganization and platelet aggregation (green), phospholipid scrambling of phosphatidylserine in platelets and ATP mediates synaptic transmission (purple), lipid binding, signal transduction (red), and blood coagulation, intrinsic pathway (blue), respectively. The PPI network which included the anticipated functional intermediate partners are presented in Table 7.
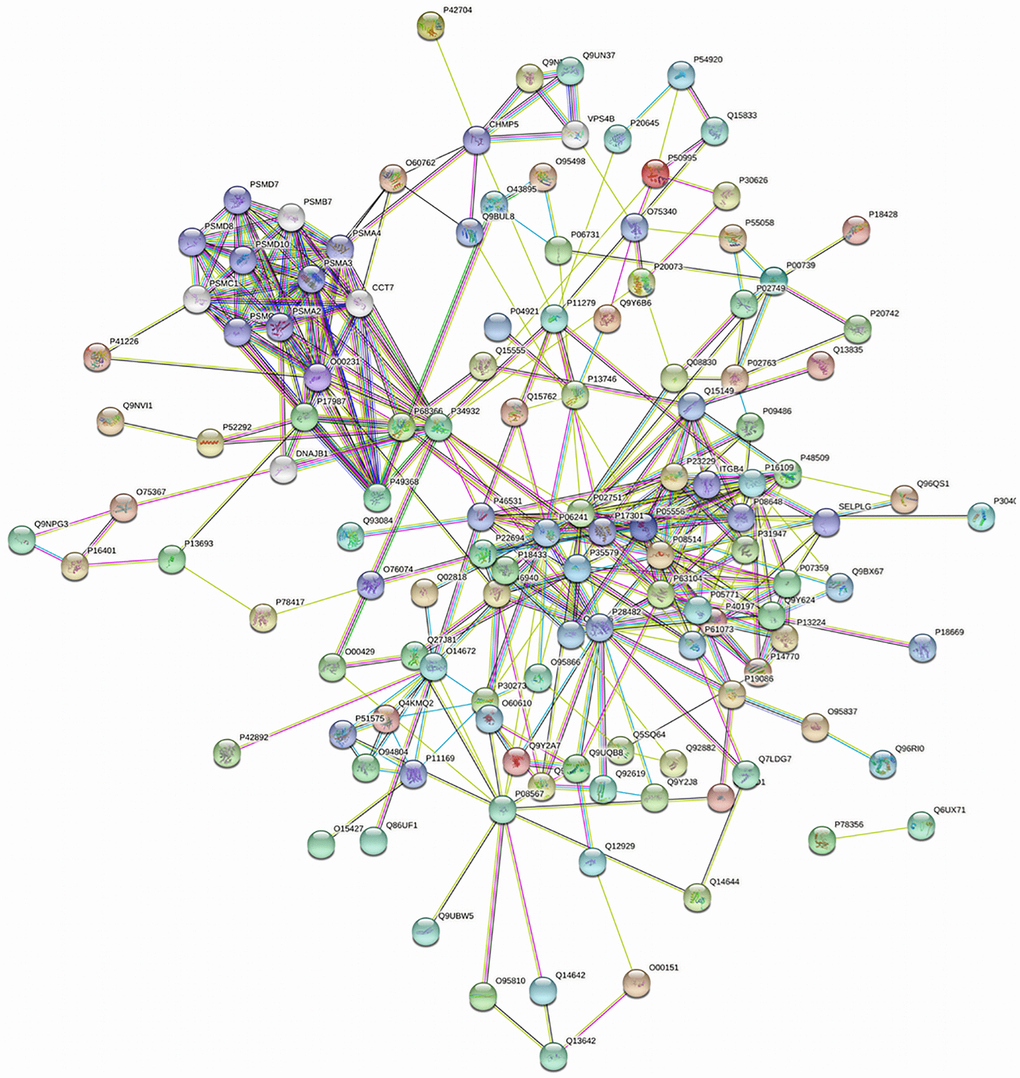
Figure 8. The PPI regulation network of up-regulated proteins in the PSCI group.
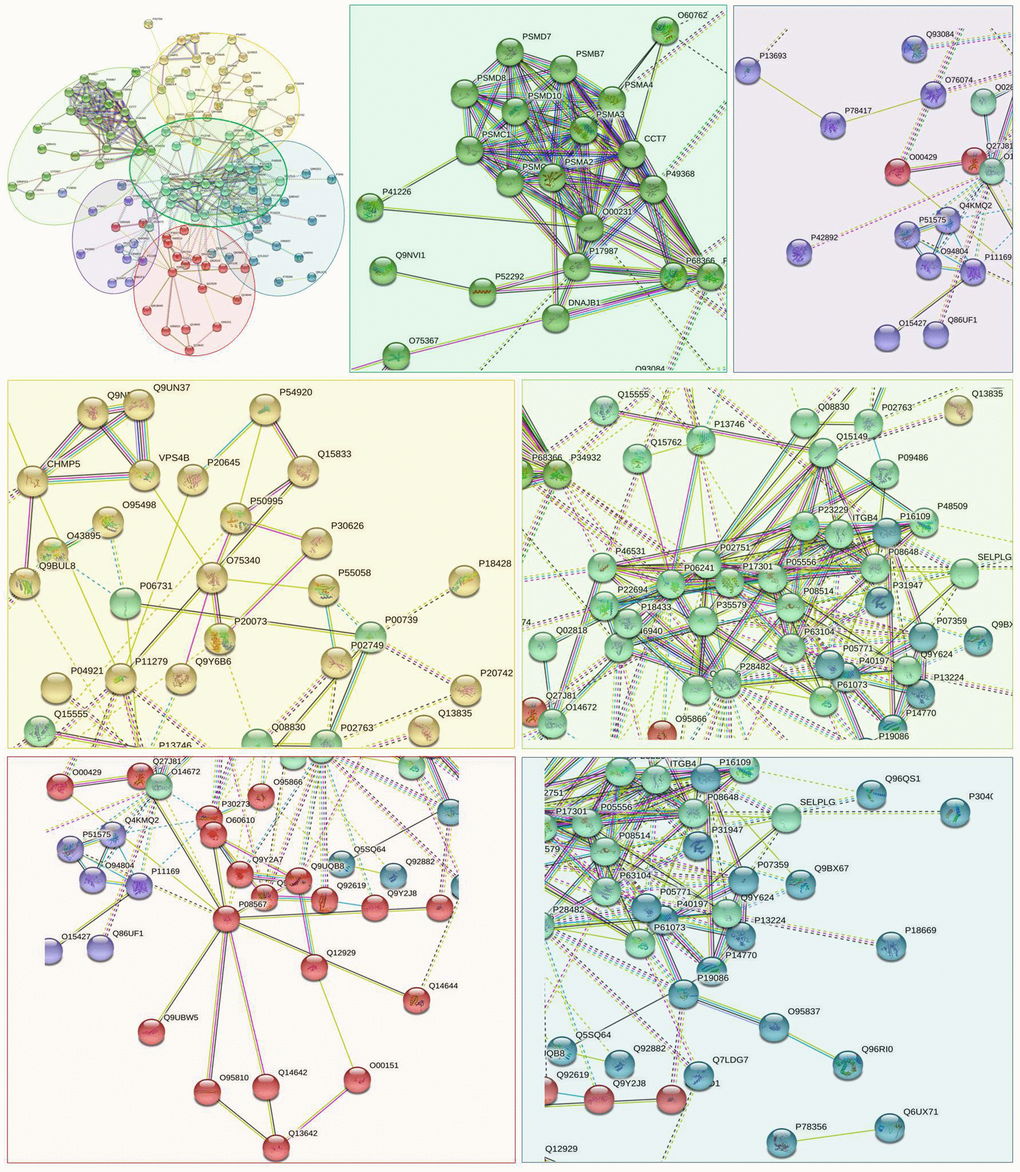
Figure 9. The PPI network means clustering of up-regulated proteins in the PSCI group. The PPI network is clustered to a specified number of clusters.
Table 7. The symbols and full names of the predicted functional intermediate partners in the PPI network of up-regulated expressed proteins shown in Figure 8.
| No. | Accession No. | Symbol | Full name | Molecular function | Number of amino acids |
| 1 | P25787 | PSMA2 | Proteasome subunit alpha type-2 | Component of the 20S core proteasome complex involved in the proteolytic degradation of most intracellular proteins. | 234 |
| 2 | P25789 | PSMA4 | proteasome subunit alpha type-4 | Participates in the ATP-dependent degradation of ubiquitinated proteins and plays a key role in the maintenance of protein homeostasis by removing misfolded or damaged proteins. | 261 |
| 3 | P16144 | ITGB4 | Integrin beta-4 | Binds to NRG1 (via EGF domain) and this binding is essential for NRG1-ERBB signaling | 1822 |
| 4 | P43686 | PRS6B | 26S proteasome regulatory subunit 6B | A multiprotein complex involved in the ATP-dependent degradation of ubiquitinated proteins. | 418 |
| 5 | P51665 | PSMD7 | 26S proteasome non-ATPase regulatory subunit 7 | Plays a key role in the maintenance of protein homeostasis by removing misfolded or damaged proteins. | 324 |
| 6 | O75832 | PSMD10 | 26S proteasome non-ATPase regulatory subunit 10 | Acts as a chaperone during the assembly of the 26S proteasome, specifically of the PA700/19S regulatory complex | 226 |
| 7 | Q9NZZ3 | CHMP5 | Charged multivesicular body protein 5 | Peripherally associated component of the endosomal sorting required for transport complex III which is involved in multivesicular bodies formation and sorting. | 219 |
| 8 | Q14242 | SELPLG | P-selectin glycoprotein ligand 1 | A SLe(x)-type proteoglycan, which through high affinity, calcium-dependent interactions, mediates rapid rolling of leukocytes over vascular surfaces in inflammation. | 428 |
PPI networks analysis results of the down-regulated proteins
118 down-regulated proteins were suitable for PPI network analysis (focus molecule) and a controlled PPI networks with high-quality were constructed according to the STRING database. A complete regulation of PPI network by down-regulated proteins were presented in Figure 10. The network clustering result showed that the PPI network consists of six specified function clusters that comprise proteins with similar functions and are expressed by various colors (Figure 11). These six visualized interaction function clusters (sub-networks) were related to protein localization to juxtaparanode region of axon (yellow), cell adhesive protein binding, Fibrin Clot formation (green), mRNA splicing and RNA recognition (red), complement activation, lipid metabolism (purple), protein trafficking and cytoskeleton remodeling (lime green), and ATP-dependent degradation of ubiquitinated proteins (blue), respectively. The anticipated functional intermediate partners in the PPI network are presented in Table 8.
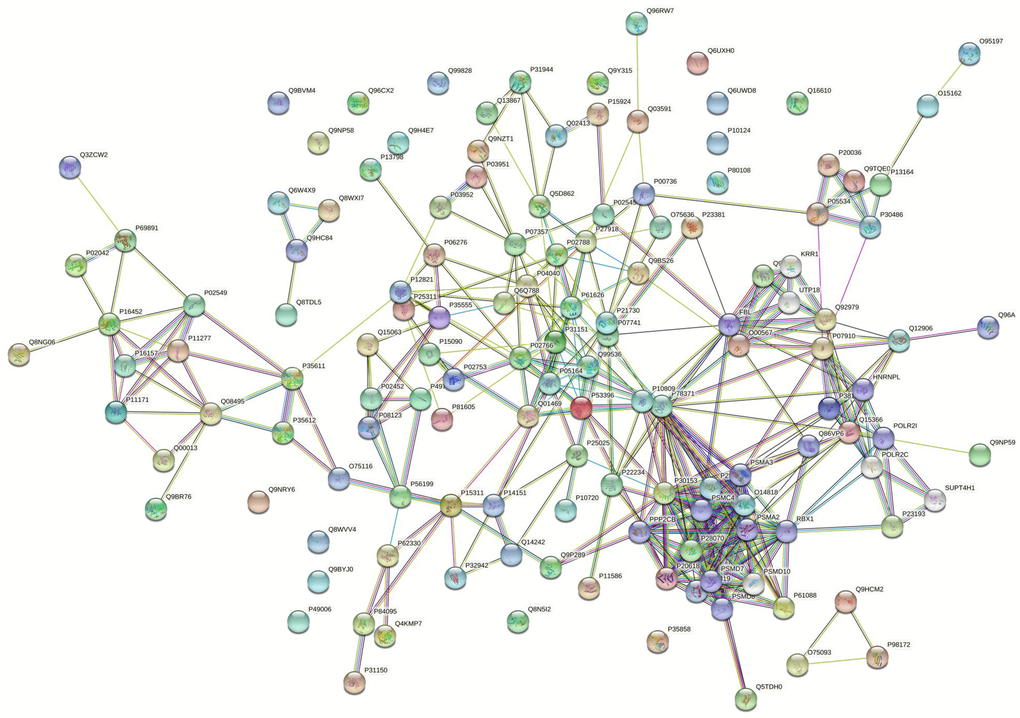
Figure 10. The PPI regulation network of down-regulated proteins in the PSCI group.
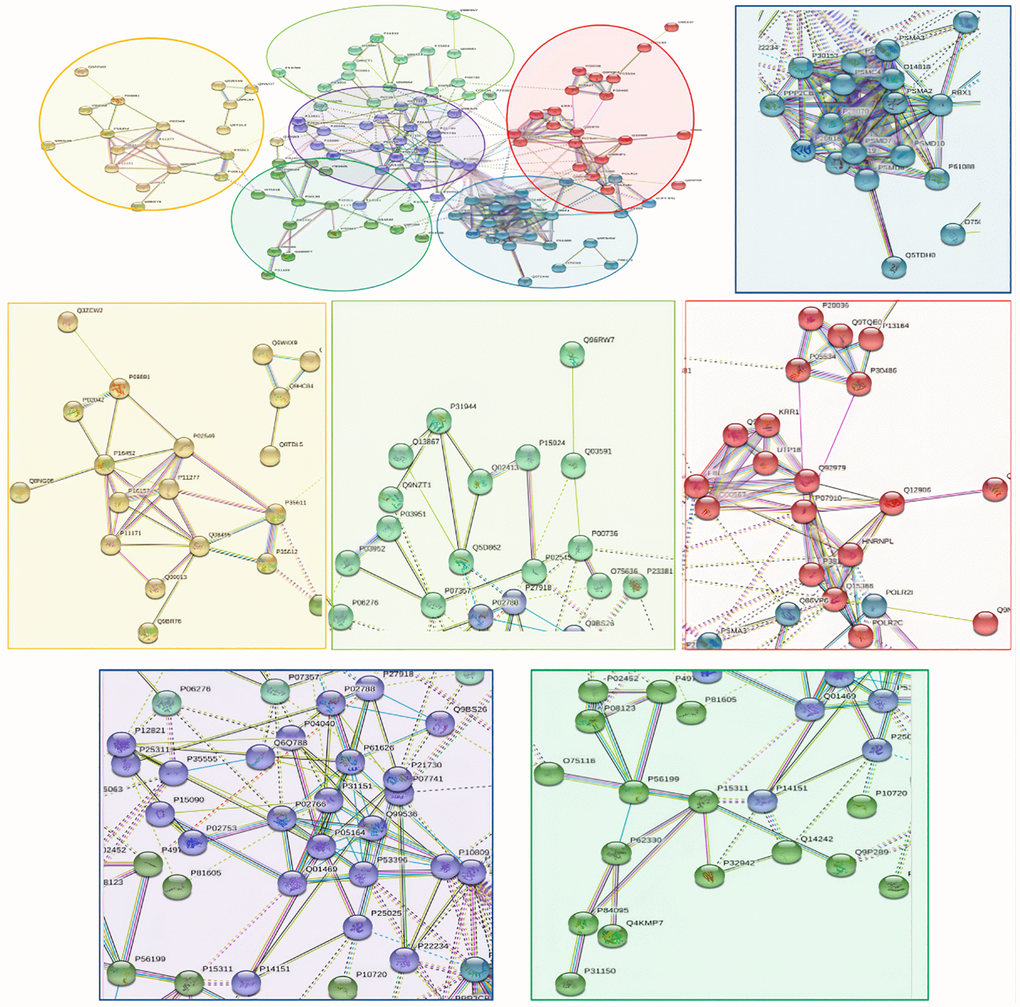
Figure 11. The PPI network means clustering of down-regulated proteins in the PSCI group. The PPI network is clustered to a specified number of clusters.
Table 8. The symbols and full names of the predicted functional intermediate partners in the PPI network of down-regulated expressed proteins shown in Figure 10.
| No. | Accession No. | Symbol | Full name | Molecular function | Number of amino acids |
| 1 | P22087 | FBL | rRNA 2′-O-methyltransferase fibrillarin | S-adenosyl-L-methionine-dependent methyltransferase that has the ability to methylate both RNAs and protein, catalyzing the site-specific 2′-hydroxyl methylation of ribose moieties in pre-ribosomal RNA. | 321 |
| 2 | P14866 | HNRNPL | Heterogeneous nuclear ribonucleoprotein L | Splicing factor binding to exonic or intronic sites and acting as either an activator or repressor of exon inclusion, Exhibiting a binding preference for CA-rich elements. | 589 |
| 3 | P36954 | POLR2I | DNA-directed RNA polymerase II subunit RPB9 | DNA-dependent RNA polymerase catalyzes the transcription of DNA into RNA using the four ribonucleoside triphosphates as substrates. | 125 |
| 4 | P62714 | PPP2CB | Serine/threonine-protein phosphatase 2A catalytic subunit beta isoform | PP2A can modulate the activity of phosphorylase B kinase casein kinase 2, mitogen-stimulated S6 kinase, and MAP-2 kinase. | 309 |
| 5 | P25788 | PSMA3 | Proteasome subunit alpha type-3 | Plays numerous essential roles within the cell by associating with different regulatory particles. | 255 |
| 6 | P48556 | PSMD8 | 26S proteasome non-ATPase regulatory subunit 8 | Component of the 26S proteasome and participates in apoptosis or DNA damage repair. | 350 |
| 7 | P62877 | RBX1 | E3 ubiquitin-protein ligase RBX1 | E3 ubiquitin ligase component of multiple cullin-RING- based E3 ubiquitin-protein ligase (CRLs) complexes which mediate the ubiquitination and subsequent proteasomal degradation of target proteins. | 108 |
ELISA quantitative determination results of plasma proteins
Compared with control group, human 14-3-3 protein zeta/delta (YWHAZ) and human brain-specific angiogenesis suppressor 1 correlated protein 2 (BAIAP2) levels of plasma were significantly increased (P < 0.01) while that of human IgD (IGHD), human ATP binding cassette subfamily B member 6, mitochondrial (ABCB6) and human heat shock protein 60 (HSPD1) were significantly decreased in patients with and without PSCI (P < 0.01) (Figure 12).
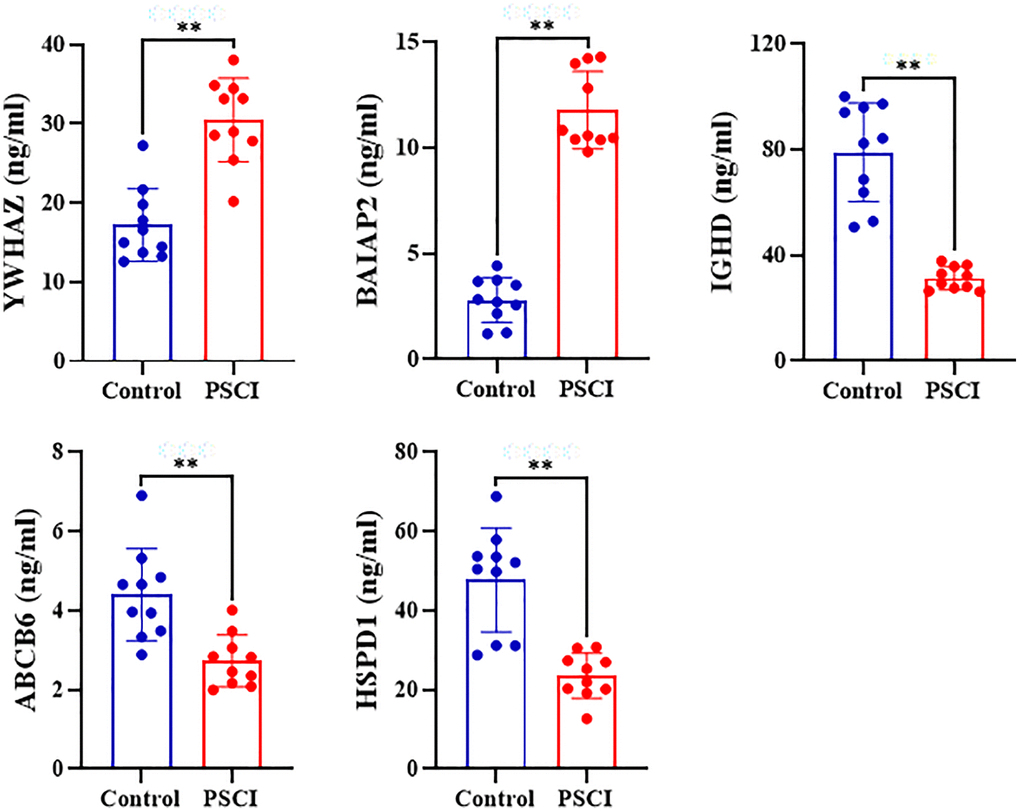
Figure 12. Plasma levels of human 14-3-3 protein zeta/delta (YWHAZ), human Brain-Specific Angiogenesis Inhibitor 1-Associated Protein 2 (BAIAP2), human IgD (IGHD), human ATP Binding Cassette Subfamily B Member 6, Mitochondrial (ABCB6), and human Heat Shock Protein 60 HSPD1 in patients with and without post stroke cognitive impairment.
Discussion
General comments
To further explore the molecular mechanism of cognitive impairment, label-free quantitative proteomics were employed to analyse the differential expressed proteins of plasma exosome in PSCI patients. Proteomics identified 259 differentially expressed proteins, containing 131 upregulated proteins and 128 downregulated proteins. These upregulated proteins are connected to ubiquitinated proteins degradation, calcium dependent protein binding, reorganization of cytoskeleton and platelet aggregation and blood coagulation. These downregulated proteins are related to protein localization to juxtaparanode region of axon, cell adhesive protein binding, fibrin clot formation, complement activation, lipid metabolism and ATP-dependent degradation of ubiquitinated proteins. The mechanisms of cognitive impairment of PSCI are related to blood flow regulation, energy metabolism, protein folding and degradation, cell apoptosis, synaptic plasticity. These were discussed in detail below.
Blood flow regulation associated proteins
Plasma kallikrein, a multifunctional serine protease associated with activation of contact coagulation [12]. Plasma kallikrein mechanisms of action can be utilized to support pro-thrombotic or anti-thrombotic characteristics. The kallikrein-kinin system suppresses thrombin-induced platelet activation, indicating an anti-thrombotic function [13]. Plasma kallikrein decreased collagen-induced platelet activation via binding collagen [14]. Whereas, the effect of pro-thrombotic is suggested by the plasma kallikrein critical role in contact activation by conversion of FXII to FXIIa. Additionally, plasma kallikrein converts prorenin to renin, which then converts angiotensinogen to angiotensin I [15]. Plasma kallikrein had been implicated in contributing to both hematoma expansion and thrombosis in stroke [16]. The outcomes of this investigation revealed that the plasma kallikrein expression was downregulated proteins. Plasma kallikrein may influence the occurrence and development of acute stroke through the activation and transformation pathway of FXII.
Platelet glycoprotein V (gpV), is a membrane constituent which containing an 82 kDa relative molecule mass, correlates with the leucine-rich proteins family. It is only expressed in platelets and megakaryocytes, and is non-covalently correlated with the gpIb-IX complex to develop a receptor for von Willebrand factor and thrombin [17, 18]. Hence, the GPIb-V-IX complex serve as the vWF receptor and modulates adhesion of vWF-dependent platelet to blood vessels. Platelet adhesion to damaged vascular surfaces in the arterial circulation is a crucial initiating event in hemostasis [19]. Platelet glycoprotein V may utilize as a platelet activation in vivo marker in thrombotic conditions. The expression of platelet-glycoprotein V in patients suffering from acute stroke is elevated, which is consistent with the study of Amin HM et al. [20]. Therefore, platelet glycoprotein V may play a protective role in the brain through blood coagulation. Fibrinogen like protein 1 (FGL1) is a released protein having mitogenic effect on primary hepatocytes. FGL1 includes an N-terminal signal recognition peptide, a potential N-terminal coil-coil domain, a C-terminal fibrinogen related domain (FReD) and multiple cysteines presumably utilized for inter and intra molecular disulfide bonds [21]. FGL1 may perform a potential function in these processes such as proliferation, angiogenesis, apoptosis and extracellular matrix modulation like structurally comparable proteins (angiopoietins, tenascins, fibrinogen) [22, 23]. Furthermore, the presence of FGL1 in the serum of rats after cytokine stimulation indicates that it could function as a significant biomarker for systemic inflammation [24]. Therefore, FGL1 may mediate the inflammatory response directly or indirectly in acute stroke. Our result of the increased expression of this protein just confirms this hypothesis.
Energy metabolism
ATP-binding cassette sub-family B member 6 (ABCB6), a member of adenosine triphosphate–binding cassette (ABC) transporter the family. It binds with heme and porphyrins and have a function in their ATP-dependent uptake into the mitochondria and plays a crucial role in the synthesis of heme [25]. Some researches have found that ABCB6 expression is protective against various results elevating oxidative stress, including exposure of arsenite [26, 27]. The outcomes of this investigation revealed that the expression level of ABCB6 reduced in patients suffering from acute stroke. The ABCB6 expression and function of closely related to the oxidation mechanism of mitochondria [25]. Therefore, ABCB6 may serve a protective function in the brain via antioxidant mechanisms.
Synaptic plasticity
Brain-specific angiogenesis inhibitor 1-associated protein 2 (BAIAP2), adapter protein that connects membrane-bound small G-proteins to cytoplasmic effector proteins. Subsequent researches have conclusively proven BAIAP2 serves as an essential regulator of membrane and actin dynamics at subcellular structures rich in actin, such as filopodia and lamellipodia [28–30]. Actin skeleton and its dynamics play an important role in the excitatory synaptic transmission and plasticity regulation [31, 32]. The results of this investigation revealed that the expression level of BAIAP2 increased in individuals with acute stroke. In the brain, BAIAP2 may perform a neuroprotective function by improving synaptic function.
Conclusion
In conclusion, the present study found 259 differentially expressed proteins such as 131 upregulated proteins and 128 downregulated proteins using label-free quantitative proteomics approach in plasma exosome of PSCI patients. The findings suggested that the mechanism of cognitive impairment may be related to blood flow regulation, energy metabolism, protein folding and degradation, cell apoptosis, synaptic plasticity, stress response and protein phosphorylation in PSCI patients. Therefore, these proteins may be target-related proteins and shed light on pathogenesis mechanisms on a global scale of cognitive impairment at plasma exosome proteins level in PSCI patients. The disorders of plasma exosome proteomics may be explained the cognitive impairment in PSCI patients. Further association studies need to be clarified.
Supplementary Materials
Author Contributions
Qi BY and Wei DF designed the research; Qi BY, Wei DF, Kong LB, Lai XX, Wang LS, Fei Liu F and Ji WW performed research and analyzed data; Qi BY and Wei DF wrote the manuscript; Qi BY, Ji WW and Wei DF revised the manuscript. The final manuscript was reviewed and approved by all authors.
Conflicts of Interest
The authors declare no conflicts of interest related to this study.
Ethical Statement and Consent
The study was approved by the Ethics Committee of Dongzhimen Hospital affiliated with Beijing University of Chinese Medicine (approval number: DZMEC-KY-2019-04). The written consent of all participants or their legal guardians has been obtained.
Funding
This work was supported by Scientific and Technological Innovation project of China Academy of Chinese Medical Sciences (grant number: CI2021A01306); the National Natural Science Foundation of China (grant number: 82174210, 81603488); Young Teacher Project of Beijing University of Chinese Medicine (grant number: 2019-BUCMXJKY021); Scientific and Technological Innovation Project of China Academy of Chinese Medical Sciences (grant number: CI2021B003); and the China Academy of Chinese Medical Sciences (grant number: ZZ11-111).
References
- 1. Wu D, Gao Y, Qi Y, Chen L, Ma Y, Li Y. Peptide-based cancer therapy: opportunity and challenge. Cancer Lett. 2014; 351:13–22. https://doi.org/10.1016/j.canlet.2014.05.002 [PubMed]
- 2. Prabhakaran S, Ruff I, Bernstein RA. Acute stroke intervention: a systematic review. JAMA. 2015; 313:1451–62. https://doi.org/10.1001/jama.2015.3058 [PubMed]
- 3. György B, Hung ME, Breakefield XO, Leonard JN. Therapeutic applications of extracellular vesicles: clinical promise and open questions. Annu Rev Pharmacol Toxicol. 2015; 55:439–64. https://doi.org/10.1146/annurev-pharmtox-010814-124630 [PubMed]
- 4. Li DB, Liu JL, Wang W, Luo XM, Zhou X, Li JP, Cao XL, Long XH, Chen JG, Qin C. Plasma Exosomal miRNA-122-5p and miR-300-3p as Potential Markers for Transient Ischaemic Attack in Rats. Front Aging Neurosci. 2018; 10:24. https://doi.org/10.3389/fnagi.2018.00024 [PubMed]
- 5. Haqqani AS, Delaney CE, Tremblay TL, Sodja C, Sandhu JK, Stanimirovic DB. Method for isolation and molecular characterization of extracellular microvesicles released from brain endothelial cells. Fluids Barriers CNS. 2013; 10:4. https://doi.org/10.1186/2045-8118-10-4 [PubMed]
- 6. Zhang Y, Chopp M, Meng Y, Katakowski M, Xin H, Mahmood A, Xiong Y. Effect of exosomes derived from multipluripotent mesenchymal stromal cells on functional recovery and neurovascular plasticity in rats after traumatic brain injury. J Neurosurg. 2015; 122:856–67. https://doi.org/10.3171/2014.11.JNS14770 [PubMed]
- 7. Xin H, Li Y, Cui Y, Yang JJ, Zhang ZG, Chopp M. Systemic administration of exosomes released from mesenchymal stromal cells promote functional recovery and neurovascular plasticity after stroke in rats. J Cereb Blood Flow Metab. 2013; 33:1711–5. https://doi.org/10.1038/jcbfm.2013.152 [PubMed]
- 8. Arba F, Quinn T, Hankey GJ, Ali M, Lees KR, Inzitari D, and VISTA Collaboration. Cerebral small vessel disease, medial temporal lobe atrophy and cognitive status in patients with ischaemic stroke and transient ischaemic attack. Eur J Neurol. 2017; 24:276–82. https://doi.org/10.1111/ene.13191 [PubMed]
- 9. Tu J, Wang LX, Wen HF, Xu YC, Wang PF. The association of different types of cerebral infarction with post-stroke depression and cognitive impairment. Medicine (Baltimore). 2018; 97:e10919. https://doi.org/10.1097/MD.0000000000010919 [PubMed]
- 10. Gao F, Jiao F, Xia C, Zhao Y, Ying W, Xie Y, Guan X, Tao M, Zhang Y, Qin W, Qian X. A novel strategy for facile serum exosome isolation based on specific interactions between phospholipid bilayers and TiO(2). Chem Sci. 2018; 10:1579–88. https://doi.org/10.1039/c8sc04197k [PubMed]
- 11. Szklarczyk D, Morris JH, Cook H, Kuhn M, Wyder S, Simonovic M, Santos A, Doncheva NT, Roth A, Bork P, Jensen LJ, von Mering C. The STRING database in 2017: quality-controlled protein-protein association networks, made broadly accessible. Nucleic Acids Res. 2017; 45:D362–8. https://doi.org/10.1093/nar/gkw937 [PubMed]
- 12. Bird JE, Smith PL, Wang X, Schumacher WA, Barbera F, Revelli JP, Seiffert D. Effects of plasma kallikrein deficiency on haemostasis and thrombosis in mice: murine ortholog of the Fletcher trait. Thromb Haemost. 2012; 107:1141–50. https://doi.org/10.1160/th-11-10-0682 [PubMed]
- 13. Schmaier AH, Smith PM, Purdon AD, White JG, Colman RW. High molecular weight kininogen: localization in the unstimulated and activated platelet and activation by a platelet calpain(s). Blood. 1986; 67:119–30. [PubMed]
- 14. Liu J, Gao BB, Clermont AC, Blair P, Chilcote TJ, Sinha S, Flaumenhaft R, Feener EP. Hyperglycemia-induced cerebral hematoma expansion is mediated by plasma kallikrein. Nat Med. 2011; 17:206–10. https://doi.org/10.1038/nm.2295 [PubMed]
- 15. Ceravolo GS, Montezano AC, Jordão MT, Akamine EH, Costa TJ, Takano AP, Fernandes DC, Barreto-Chaves ML, Laurindo FR, Tostes RC, Fortes ZB, Chopard RP, Touyz RM, Carvalho MH. An interaction of renin-angiotensin and kallikrein-kinin systems contributes to vascular hypertrophy in angiotensin II-induced hypertension: in vivo and in vitro studies. PLoS One. 2014; 9:e111117. https://doi.org/10.1371/journal.pone.0111117 [PubMed]
- 16. Simão F, Ustunkaya T, Clermont AC, Feener EP. Plasma kallikrein mediates brain hemorrhage and edema caused by tissue plasminogen activator therapy in mice after stroke. Blood. 2017; 129:2280–90. https://doi.org/10.1182/blood-2016-09-740670 [PubMed]
- 17. Lanza F, Morales M, de La Salle C, Cazenave JP, Clemetson KJ, Shimomura T, Phillips DR. Cloning and characterization of the gene encoding the human platelet glycoprotein V. A member of the leucine-rich glycoprotein family cleaved during thrombin-induced platelet activation. J Biol Chem. 1993; 268:20801–7. [PubMed]
- 18. Hickey MJ, Hagen FS, Yagi M, Roth GJ. Human platelet glycoprotein V: characterization of the polypeptide and the related Ib-V-IX receptor system of adhesive, leucine-rich glycoproteins. Proc Natl Acad Sci U S A. 1993; 90:8327–31. https://doi.org/10.1073/pnas.90.18.8327 [PubMed]
- 19. Moog S, Mangin P, Lenain N, Strassel C, Ravanat C, Schuhler S, Freund M, Santer M, Kahn M, Nieswandt B, Gachet C, Cazenave JP, Lanza F. Platelet glycoprotein V binds to collagen and participates in platelet adhesion and aggregation. Blood. 2001; 98:1038–46. https://doi.org/10.1182/blood.v98.4.1038 [PubMed]
- 20. Amin HM, Ahmad S, Walenga JM, Hoppensteadt DA, Leitz H, Fareed J. Soluble P-selectin in human plasma: effect of anticoagulant matrix and its levels in patients with cardiovascular disorders. Clin Appl Thromb Hemost. 2000; 6:71–6. https://doi.org/10.1177/107602960000600204 [PubMed]
- 21. Demchev V, Malana G, Vangala D, Stoll J, Desai A, Kang HW, Li Y, Nayeb-Hashemi H, Niepel M, Cohen DE, Ukomadu C. Targeted deletion of fibrinogen like protein 1 reveals a novel role in energy substrate utilization. PLoS One. 2013; 8:e58084. https://doi.org/10.1371/journal.pone.0058084 [PubMed]
- 22. Procopio WN, Pelavin PI, Lee WM, Yeilding NM. Angiopoietin-1 and -2 coiled coil domains mediate distinct homo-oligomerization patterns, but fibrinogen-like domains mediate ligand activity. J Biol Chem. 1999; 274:30196–201. https://doi.org/10.1074/jbc.274.42.30196 [PubMed]
- 23. Sahni A, Francis CW. Vascular endothelial growth factor binds to fibrinogen and fibrin and stimulates endothelial cell proliferation. Blood. 2000; 96:3772–8. [PubMed]
- 24. El-Karef A, Yoshida T, Gabazza EC, Nishioka T, Inada H, Sakakura T, Imanaka-Yoshida K. Deficiency of tenascin-C attenuates liver fibrosis in immune-mediated chronic hepatitis in mice. J Pathol. 2007; 211:86–94. https://doi.org/10.1002/path.2099 [PubMed]
- 25. Kiss K, Brozik A, Kucsma N, Toth A, Gera M, Berry L, Vallentin A, Vial H, Vidal M, Szakacs G. Shifting the paradigm: the putative mitochondrial protein ABCB6 resides in the lysosomes of cells and in the plasma membrane of erythrocytes. PLoS One. 2012; 7:e37378. https://doi.org/10.1371/journal.pone.0037378 [PubMed]
- 26. Chavan H, Oruganti M, Krishnamurthy P. The ATP-binding cassette transporter ABCB6 is induced by arsenic and protects against arsenic cytotoxicity. Toxicol Sci. 2011; 120:519–28. https://doi.org/10.1093/toxsci/kfr008 [PubMed]
- 27. Lynch J, Fukuda Y, Krishnamurthy P, Du G, Schuetz JD. Cell survival under stress is enhanced by a mitochondrial ATP-binding cassette transporter that regulates hemoproteins. Cancer Res. 2009; 69:5560–7. https://doi.org/10.1158/0008-5472.CAN-09-0078 [PubMed]
- 28. Ahmed S, Goh WI, Bu W. I-BAR domains, IRSp53 and filopodium formation. Semin Cell Dev Biol. 2010; 21:350–6. https://doi.org/10.1016/j.semcdb.2009.11.008 [PubMed]
- 29. Scita G, Confalonieri S, Lappalainen P, Suetsugu S. IRSp53: crossing the road of membrane and actin dynamics in the formation of membrane protrusions. Trends Cell Biol. 2008; 18:52–60. https://doi.org/10.1016/j.tcb.2007.12.002 [PubMed]
- 30. Suetsugu S, Toyooka K, Senju Y. Subcellular membrane curvature mediated by the BAR domain superfamily proteins. Semin Cell Dev Biol. 2010; 21:340–9. https://doi.org/10.1016/j.semcdb.2009.12.002 [PubMed]
- 31. Calabrese B, Wilson MS, Halpain S. Development and regulation of dendritic spine synapses. Physiology (Bethesda). 2006; 21:38–47. https://doi.org/10.1152/physiol.00042.2005 [PubMed]
- 32. Cingolani LA, Goda Y. Actin in action: the interplay between the actin cytoskeleton and synaptic efficacy. Nat Rev Neurosci. 2008; 9:344–56. https://doi.org/10.1038/nrn2373 [PubMed]