


Introduction
Endometrial cancer (EC) is one of the most common gynecological tumors in the United States, Europe, and other developed countries. Most patients with EC are diagnosed at an early stage and have enhanced survival with effective treatment. However, most patients with advanced EC are incurable [1, 2]. Therefore, identifying novel molecular players that function as diagnostic and prognostic biomarkers and potential therapeutic targets for EC is crucial.
The tumor microenvironment (TME), comprising cancer cells, non-tumor cells, and the extracellular matrix, plays significant roles in intra-tumoral crosstalk [3]. Cancer stem cells (CSCs), capable of self-renewal and differentiation [4], contribute to cancer recurrence, chemotherapy resistance, and tumor progression [5].
The inflammatory response is an important feature of tumors [6]. Both local and systemic inflammation contribute to tumor-related inflammation. Local inflammation promotes immune evasion and chemotherapeutic drug resistance by forming an inflammatory microenvironment, thereby promoting angiogenesis and metastasis to advance tumor progression [7]. The increased tumor mutational burden contributes to a chronic inflammatory response [8]. Our team previously developed the Naples score using blood inflammatory and nutritional indicators and demonstrated that this score could predict survival in patients with EC [9, 10]. However, only a few studies have investigated the role of inflammation in EC [11, 12]. Thus, the role of inflammatory response-related genes (IRGs) in EC prognosis remains unclear.
Herein, we hypothesized that IRGs could affect EC progression and patient prognosis. Thus, this study aimed to build an IRGs-based signature to predict patient prognosis and the effects of immunotherapy and chemotherapy. We also experimentally verified the effects of IRGs on the malignant biological behavior of EC cells to provide novel insights regarding the prognosis and efficacy of immunotherapy and precision medicine in EC.
Results
In this study (Supplementary Figure 1), an IRG-based gene signature was constructed to predict patient prognosis better than the existing models. This signature can also predict the curative effect of patients with EC to immunotherapy and commonly used chemotherapeutic drugs. Finally, we verified that the characteristic genes (LAMP3, MEP1A, and ROS1) in the IRGs could affect the malignant behavior of EC.
Construction of a prognostic model
Univariate Cox regression analysis showed that 39 of the 200 IRGs were associated with overall survival (OS; OS was the duration from surgery to death expressed in months) (Figure 1A). We screened 39 prognostic IRGs using LASSO-Cox regression analysis (Figure 1B, 1C). Risk score = e(0.1286 × Exp [GABBR1]) + (0.0212 × Exp [LAMP3]) + (−0.1382 × Exp [LCK]) + (−0.1231 × Exp [LPAR1]) + (0.0951 × Exp [MEP1A]) + (0.3928 × Exp [MXD1]) + (−0.0676 × Exp [NDP]) + (−0.2482 × Exp [P2RX4]) + (0.0128 × Exp [P2RY2]) + (−0.2786 × Exp [PSEN1]) + (0.1288 × Exp [ROS1]) + (−0.1594 × Exp [SLC11A2]) + (0.1905 × Exp [TNFSF10]). Kaplan−Meier (KM) analysis of the training group showed differences in survival between the high- and low- risk groups (Figure 1D). In the training group, the areas under the receiver operating characteristic curves (AUCs) for 1-, 3-, and 5-year OS were 0.715, 0.801, and 0.805, respectively (Figure 1D). Patient survival status and risk score distribution in the training group are shown in Figure 1E. This model exhibits a certain predictive ability. The same formula was used for the test group. This risk score also showed a good predictive ability in the test group (Figure 1F, 1G).
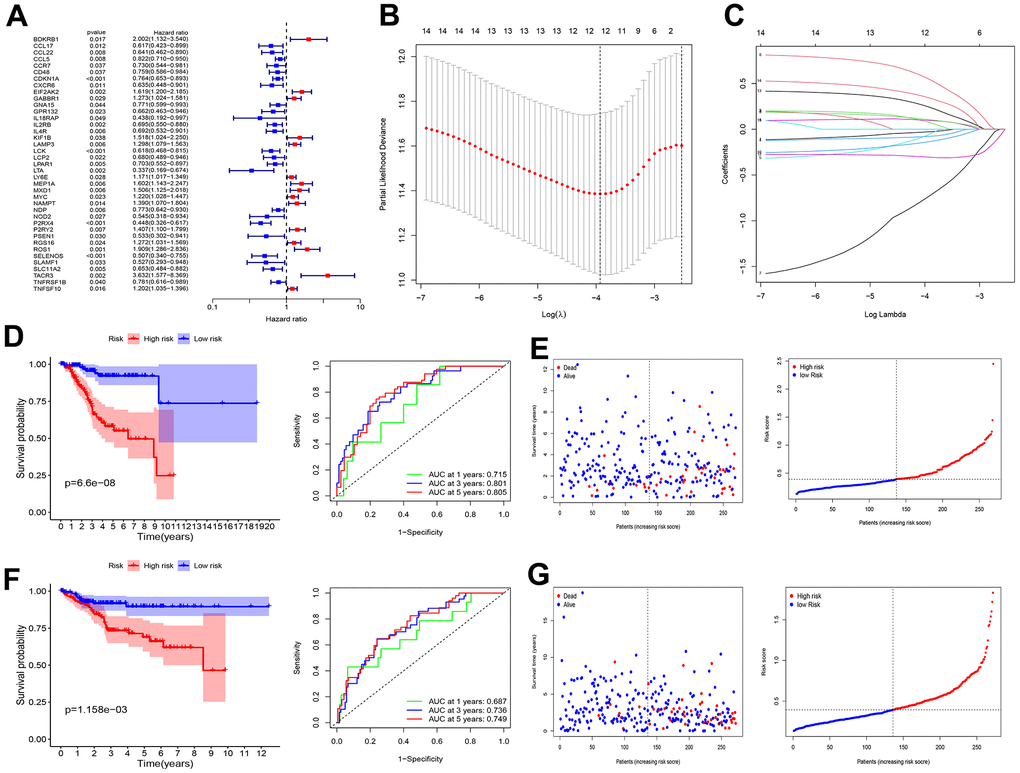
Figure 1. Screening of prognosis RBP and construction of prognosis model. (A) Univariate Cox regression analysis to identify the candidate prognosis-related hub IRGS in UCEC. (B) Partial likelihood deviation was plotted relative to the logarithm of lambda in 13-fold cross-validation. (C) The trajectory graph of each variable. (D) Survival curves and ROC curves of high and low risk groups in the training group. (E) The risk score value of each sample, the survival status ranked from low to high-risk scores in the training group. (F) Survival curves and ROC curves of high and low risk groups in the test group. (G) The risk score value of each sample, the survival status ranked from low to high-risk scores in the test group.
Establishment of the nomogram
The risk score was an independent prognostic factor (Figure 2A, 2B). We then built a nomogram to quantitatively predict the prognosis patients with EC (Figure 2C). Calibration curves showed high accuracy and validity (Figure 2D). The AUCs for 1-, 3-, and 5-year OS were 0.778, 0.793, and 0.814, respectively (Figure 2E).
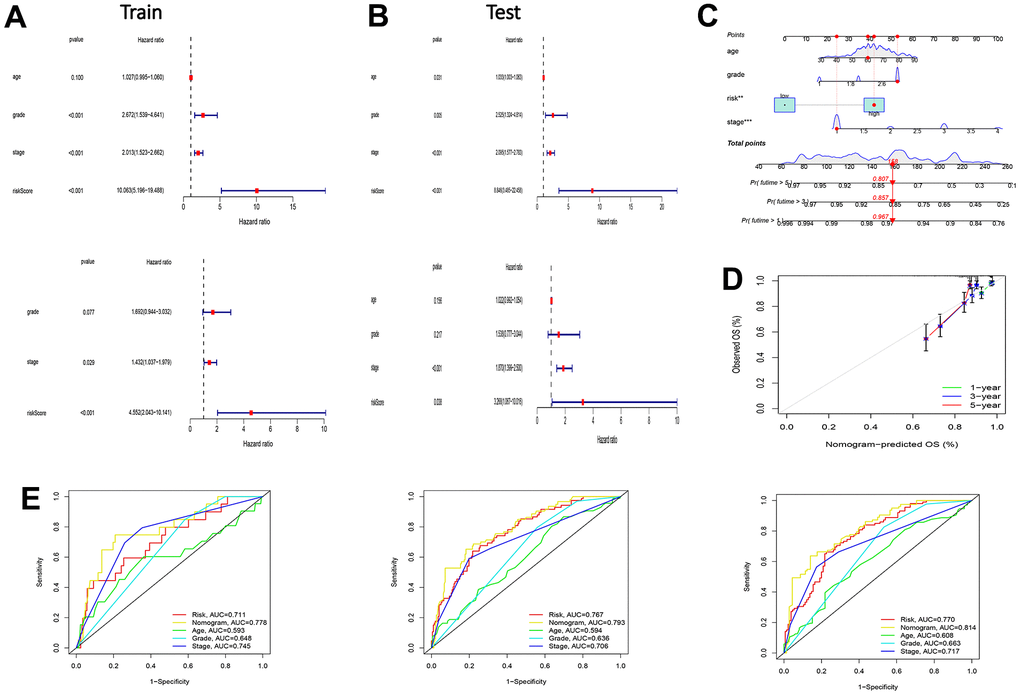
Figure 2. Test of risk prediction model for UCEC patients and nomogram quantitative prediction of survival time and correction of UCEC patients. (A) Univariate and multivariate analysis were performed to assess the clinicopathological prognostic value of the prediction model in the training group. (B) Univariate and multivariate analysis were performed to assess the clinicopathological prognostic value of the prediction model in the test group. (C) Nomogram for predicting the 1-, 3-, and 5-year OS of UCEC patients. (D) Calibration curves for the prediction of 1-, 3- or 5-year overall survival of UCEC patients. (E) ROC curves for predicting the 1-, 3-, and 5-year OS of UCEC patients.
Comparison between models
To verify the effectiveness of the constructed model, we also compared it with existing models. Figure 3A, 3B displays the models constructed by our group. The C-index results showed that the model constructed using the IRGs was superior to the models constructed by Cai, Liu, and Liu J [13–15] (Figure 3C).
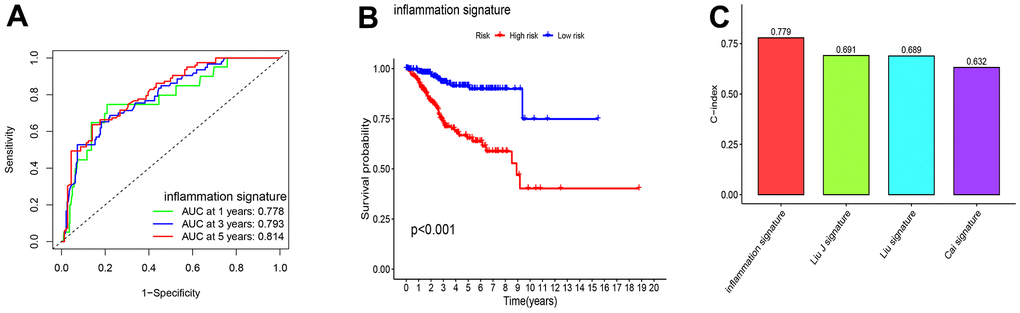
Figure 3. The comparison between model for IRGs and the existing model for signatures. (A, B) Survival curves and ROC curves of high and low risk groups in the model constructed by us. (C) C-index comparison of inflammatory models with other models.
Association analysis between functional characteristics and risk score
Association analysis between risk score and clinical characteristics showed that the risk score was higher in the >65 age groups (P < 0.001), tumor stage III–IV (P < 0.001), or tumor grade 3–4 (P < 0.001) than in the ≤65 age groups, tumor stage I–II, or tumor grade 1–2 (Figure 4A–4C). Moreover, this risk score was higher in the immune subtypes (C2) with a poorer prognosis (Figure 4D).
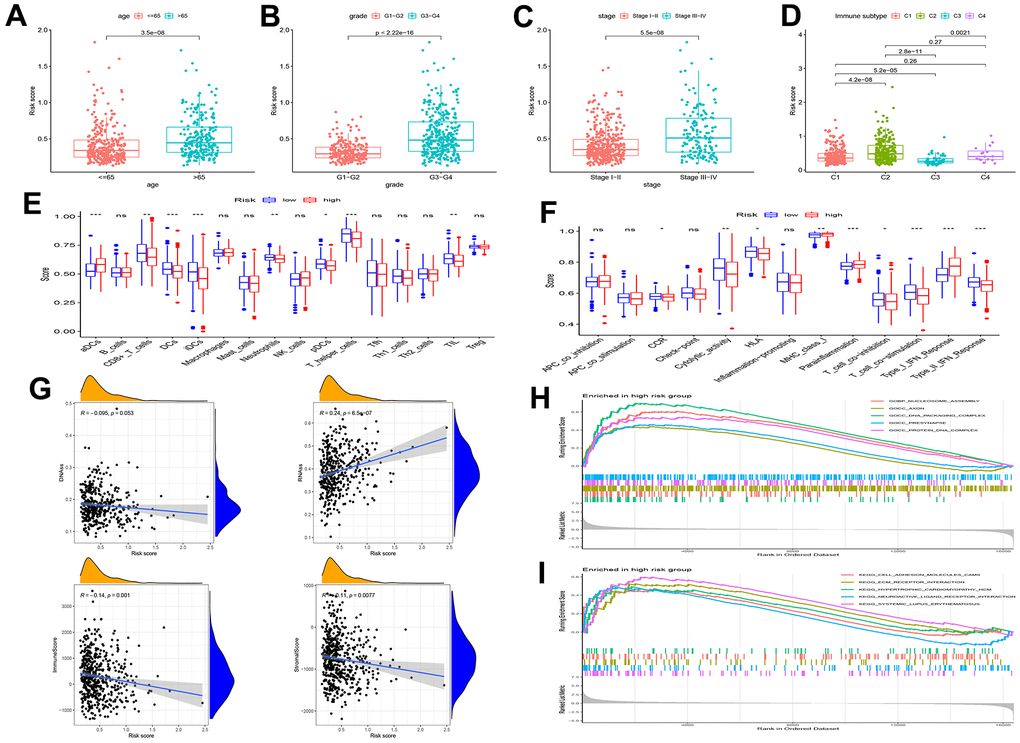
Figure 4. Gene set enrichment analysis (GSEA) of biological functions and the association between risk score and tumor microenvironment. The risk score in different groups divided by age (A), grade (B), stage (C) and immune subtype (D). Comparison of the risk score in different immune infiltration. (E, F) The relationship between risk score and the scores of 16 immune cells and 13 immune-related functions were showed in boxplots. (G) The relationship between risk score and DNAss, RNAss, Stromal Score and Immune Score. (H, I) GSEA showed eleven pathways enriched in the high-risk group. P values were showed as: ns, not significant; *P < 0.05; **P < 0.01; ***P < 0.001.
Single-sample Gene Set Enrichment Analysis (ssGSEA) revealed that the fractions of CD8+T cells, DCs, iDCs, pDCs, T helper cells, and TIL were significantly decreased in the high-risk group (Figure 4E). Moreover, CCR, type II IFN response score, and T cell co-stimulation were significantly decreased in the high-risk group (Figure 4F).
RNA stemness scores (RNAss) and DNA stemness scores (DNAss) were used to evaluate CSCs [16]. The results revealed that the risk score significantly positively correlated with RNAss, but negatively correlated with immune and stromal scores (Figure 4G). In addition, we assessed the relationship between pathway enrichment and risk scores. GO and KEGG enrichment analyses showed that nucleosome assembly, DNA packaging complex, presynapse, protein-DNA complex, ECM receptor interaction, and cell adhesion molecules were significantly enriched in the high-risk group (Figure 4H, 4I).
Predicting the effects of anti-cancer treatment and immunotherapy sensitivity
To further verify the relationship between risk score and immunotherapy sensitivity, we downloaded the dataset from the IMvigor210 database. Figure 5A shows that the risk scores were significantly higher in patients with progressive diseases (PD) or stable disease (SD) than in those with complete response (CR) or partial response (PR). Figure 5B–5F showed that the high-risk group was more sensitive to the chemotherapeutic drugs cisplatin, dasatinib, doxorubicin, gefitinib, and gemcitabine than the low-risk group. Therefore, those patients with EC in the low-scoring group were more likely to benefit from immunotherapy. Although patients in the high-risk group have a poor survival prognosis, we can use more sensitive chemotherapy drugs in the high-risk group to improve their prognosis.
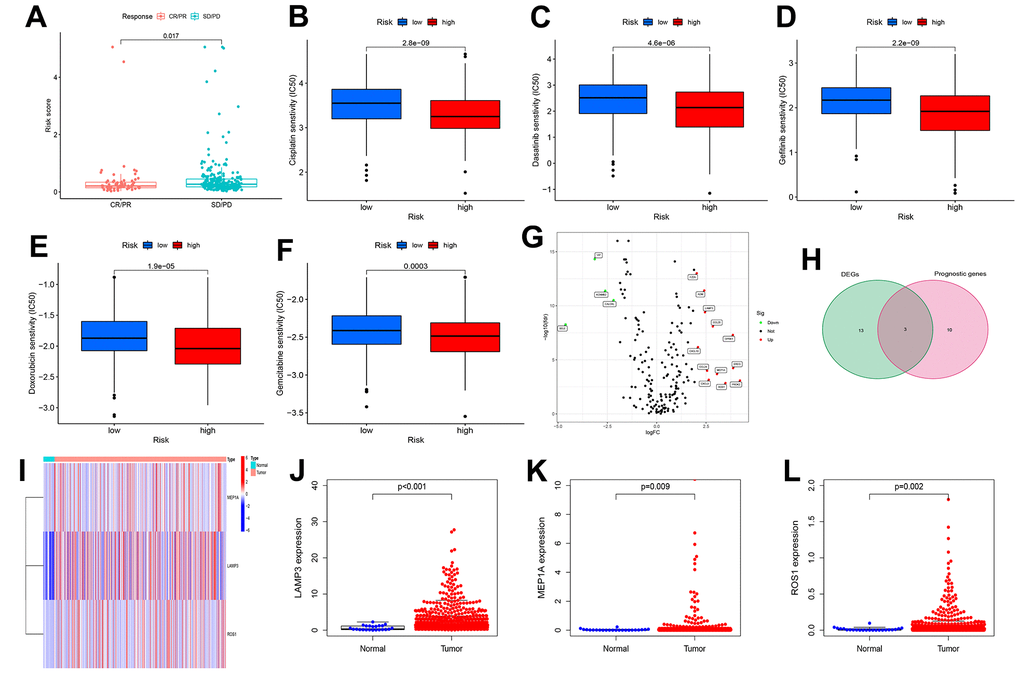
Figure 5. Risk scores are associated with immunotherapy and chemotherapeutic drug response and identification of differentially expressed genes. (A) The correlation between risk scores and immunotherapy response. (B–F) The correlation between risk scores and Chemotherapeutic drug sensitivity. (G) volcano plot of Differentially expressed IRGs (DEIRGs): upregulated DEIRGs are indicated by red dots, and downregulated DEIRGs are indicated by green dots. (H) The DEIRGs were intersected with the genes included in the model. (I) Heat map of LAMP3, MEP1A and ROS1 between tumor and normal tissues. Box plots showed the expression of LAMP3 (J), MEP1A (K) and ROS1 (L) in normal and UCEC tissues from TCGA.
Identification of differential genes
We identified 16 differentially expressed IRGs (DEIRGs) (Figure 5G). Figure 5H, 5I shows that the intersection of the DEIRGs and 13 IRGs (in the prognostic model) yielded three common genes (MEP1A, LAMP3, and ROS1). The expression of MEP1A, LAMP3, and ROS1 was upregulated in the uterine corpus EC (UCEC) tissue-based TCGA datasets (Figure 5J, 5K). The qRT-PCR results showed that MEP1A, LAMP3, and ROS1 (Supplementary Figure 2A–2C) were highly expressed in human EC tissues, which is consistent with our analysis of the TCGA-UCEC dataset. Analysis of clinicopathological parameters of EC patients showed that the expression of the three genes (LAMP3: Supplementary Figure 2D–2F, MEP1A: Supplementary Figure 2G–2I, and ROS1: Supplementary Figure 2J–2L) were higher in the >65 age (P > 0.05), tumor stage III–IV (P < 0.05), or lymph node (LN) metastasis (P < 0.05) groups than in the ≤65 age groups, tumor stage I–II, or no LN metastasis groups.
Cell functional experimental validation of three key genes
To further verify the role of LAMP3, MEP1A, and ROS1 in EC, we knocked down the expression of LAMP3 (Figure 6A), MEP1A (Figure 6E), and ROS1 (Figure 7A) in EC cells (Ishikawa cells) and examined their siRNA effects on the cells using PCR. Silencing of these three genes inhibited proliferation (LAMP3: Figure 6B, 6C, MEP1A: Figure 6F, 6G, and ROS1: Figure 7B, 7C) and invasion (LAMP3: Figure 6D, MEP1A: Figure 6H, and ROS1: Figure 7D) of ECs. In Ishikawa cells, LAMP3 and ROS1 knockdown promoted apoptosis, whereas MEP1A knockdown did not (Figure 7E). These results suggested that LAMP3, MEP1A, and ROS1 function as oncogenes in EC.
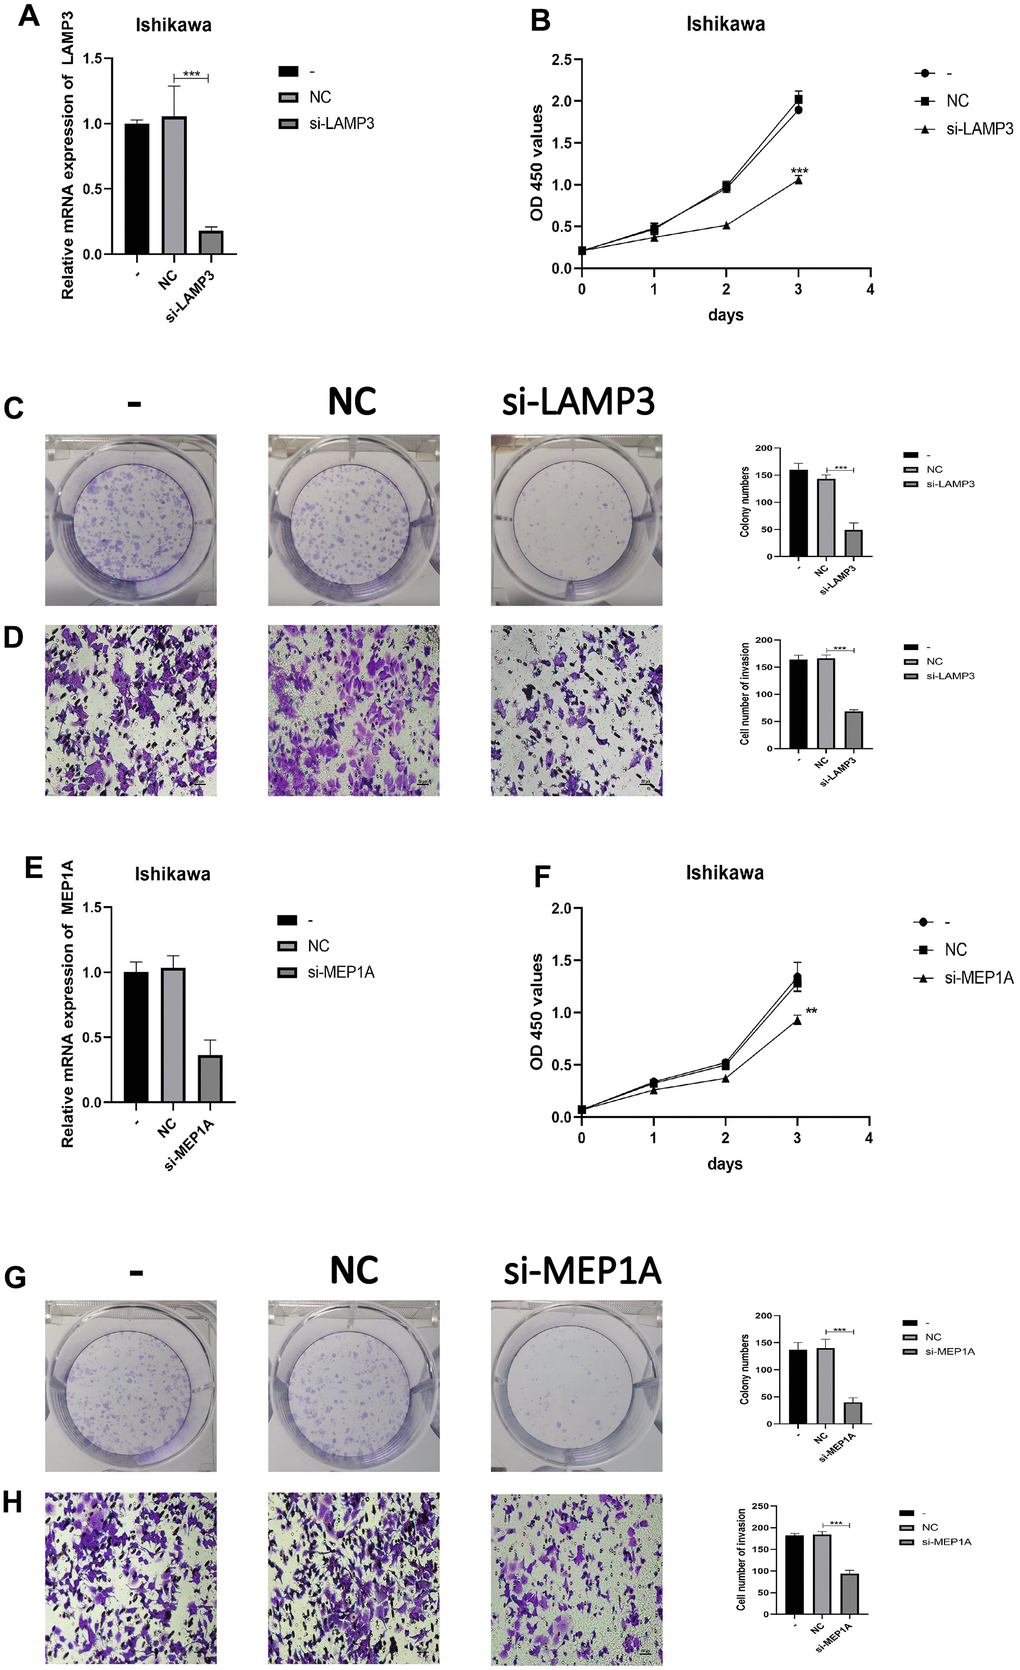
Figure 6. LAMP3 and MEP1A regulates the biological behavior of Ishikawa cell lines. (A) PCR was used to verify knockdown efficiency of LAMP3. (B, C) CCK-8 and colony formation assays were used to evaluate the proliferation effect of LAMP3. (D) Effect of LAMP3 on invasion assessed using the Transwell assay. (E) PCR was used to verify knockdown efficiency of MEP1A. (F, G) CCK-8 and colony formation assays were used to evaluate the proliferation effect of MEP1A. (H) Effect of MEP1A on invasion assessed using the Transwell assay.
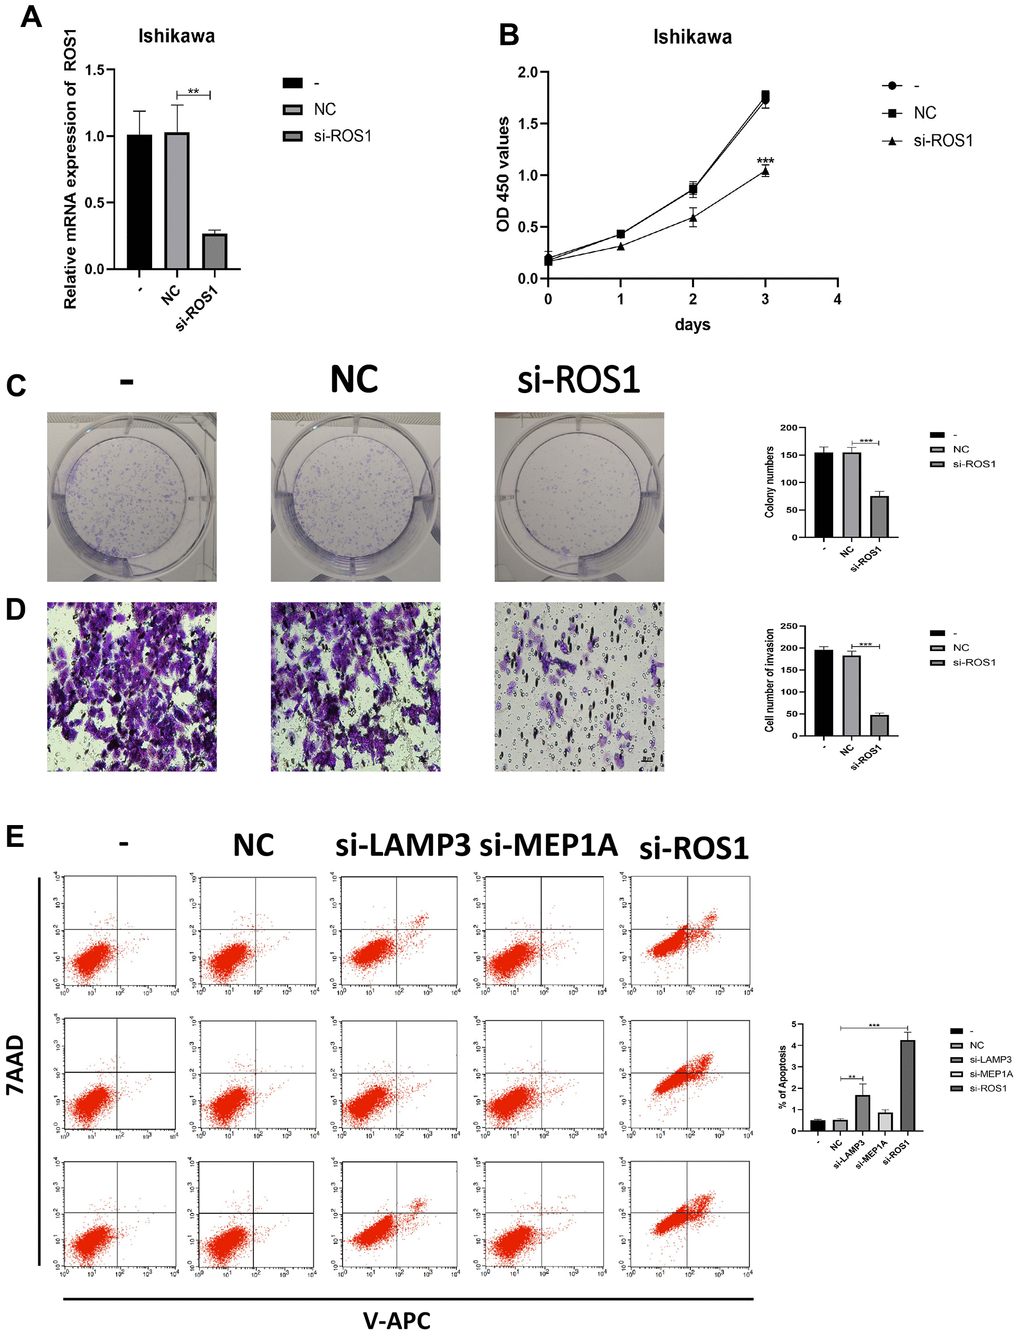
Figure 7. IRGs regulates the biological behavior of Ishikawa cell lines. (A) PCR was used to verify knockdown efficiency of ROS1. (B, C) CCK-8 and colony formation assays were used to evaluate the proliferation effect of ROS1. (D) Effect of ROS1 on invasion assessed using the Transwell assay. (E) Cell apoptosis assay was used to determine the effect of LAMP3, MEP1A and ROS1.
Discussion
EC is one of the most common tumors affecting the female reproductive system. Currently, EC treatment mainly employs surgical intervention alone in the early stages and combines surgery with other adjuvant treatments in advanced stages [17]. However, last-stage EC is highly invasive and migratory, and the efficacy of treatments is low [18]. If EC is not effectively diagnosed and treated in its early stages, the five-year survival rate for advanced endometrial cancer drops to 16–45% compared with 95% in its early stages [1, 2]. Therefore, it is important to explore novel prognostic biomarkers and druggable targets for EC.
The main risk factors for EC are exposure to endogenous and exogenous estrogen, diabetes, obesity, late-onset menopause, nulliparity, and older age [19]. However, recent research has suggested that inflammation is an important risk factor for EC [20–23]. Interestingly, in our independent retrospective cohort study, we reached similar conclusions, suggesting that inflammatory markers in the blood are strongly associated with EC prognosis [10, 24]. Although multiple clinical cohorts and retrospective studies have revealed that inflammation is a risk factor for EC, there are few studies on the underlying mechanisms of the inflammatory response in the occurrence and development of EC. Using second-generation sequencing technology, it is now possible to reveal the association between the inflammatory response and EC at the gene level. Precision medicine requires new and improved models to predict the survival and efficacy of immunotherapy and chemotherapy drugs in patients with EC.
The TCGA-UCEC dataset was downloaded for this study. Univariate analysis of TCGA-UCEC dataset identified 39 prognostic IRGs, and LASSO regression was used to build a new gene signature containing 13 IRGs. We then constructed a nomogram based on the clinical information of UCEC patients (age, stage, and grade) and compared this signature with the models constructed by Cai [13], Liu [14], and Liu J [15]. The results showed that our model is superior to the existing models. The survival of EC patients is dependent on predictive factors such as age, stage, and grade [25, 26]. Therefore, our final nomogram, based on these clinical data and risk scores, had a better predictive power. Furthermore, we analyzed the risk score and clinical information of the patients, and the results revealed that patients with clinical risk factors (> 65, grade 3–4, stage III–IV) also had higher risk scores, proving that risk scores were consistent with clinical risk factors. A study based on TCGA database categorized tumors into six immune infiltration subtypes (C1–C6) [27]. Immune subtypes were closely related to progression-free survival (PFS) and OS; C1 and C2 had poor prognoses, C3 had the best survival, and C4 and C6 had the worst prognoses. In this study, high-risk scores with worse prognoses were associated with immunotypes C1, C2, and C4.
Inflammation and the inflammatory TME drive tumor growth, metastasis, progression, and initiation [28]. However, there have been few studies on inflammation in EC, and the mechanisms of IRGs in EC remains unclear. The effects of the risk scores and IRGs included in the model on the prognostic mechanism of patients with EC have not been clarified. Therefore, we further explored this model. Results of ssGSEA showed that the fractions of TIL, T helper cells, pDCs, DCs, iDCs, and CD8+T cells, and were significantly decreased in the high-risk group. This suggests that our model is sensitive to changes in immune function. Previous studies have shown that changes in these immune-related cells affect the prognosis of cancer patients [29, 30]. CSCs are resistant to therapeutic drugs, and their presence may affect patient outcomes [31–33]. Our results showed that the risk score was negatively correlated with the immune and stromal scores and significantly positively correlated with RNAss. This suggests that the risk score may predict EC patient prognosis by analyzing their stemness characteristics. Previous studies have shown that T and B cells affect tumor progression in EC by activating the IFN and TFN inflammatory pathways via the IgA pathway [34, 35]. These findings suggest that immune cells in the TME may function by influencing inflammatory pathways in EC tumor cells.
Currently, clinical treatments exist for only some types of endometrial carcinomas [36, 37]; however, only a few studies have evaluated the sensitivity of patients with EC to chemotherapeutic agents and immunotherapy [38]. Interestingly, in this study, patients in the high-risk group had a lower response rate to immunotherapy, but more sensitive to chemotherapy drugs (cisplatin, dasatinib, doxorubicin, gefitinib, and gemcitabine) than the low-risk group. To date, cyclophosphamide, doxorubicin, and cisplatin (CAP) combination chemotherapy is used as a first-line treatment for treating patients with EC [19, 39–42]. Therefore, in our model, conventional CAP chemotherapy regiments are recommended over expensive immunotherapy for high-risk groups. These data can guide clinical chemotherapeutic drug application and predict drug sensitivity in advance. Although immunotherapy is not the preferred treatment for patients with EC, it has shown great therapeutic potential in Food and Drug Administration-approved phase I immunotherapy trials [43]. The high-risk group in our model was more likely to be unresponsive to immunotherapy, which may be related to the disturbance of inflammatory pathways downstream of the immunotherapy targets. In summary, the risk scores constructed in this study show great potential for predicting immunotherapy responses and chemotherapeutic drug sensitivity. This suggests that the risk scores can be used to predict the efficacy of chemotherapy drugs and immunotherapy in patients with EC, thereby contributing to the development of precision therapy.
However, this study has some limitations. There was no external validation due to the lack of other datasets with UCEC clinical data. In addition, the effectiveness of the model in clinical practice is unknown, and we intend to conduct further research in the future. Nonetheless, our exploration of IRGs also provides a reference for studying inflammatory responses in UCEC. Thus, these findings might have potential clinical application for better prognostic management of patients with EC. Additionally, the genes in this model may serve as molecular targets for EC therapy.
Conclusions
The IRGs-based model that we constructed for the first time have stable predictive power for patient prognosis. This model can be used as a potential prognostic index for patients with EC. Meanwhile, we also provide a theoretical basis for the future studies on inflammatory response in EC. Overall, this study could help reveal the role of IRGs in TME, immunotherapy response, and chemotherapeutic drug resistance, which is crucial for personalized tumor treatment and precision medicine. These findings might have potential clinical application for better prognostic management of patients with EC.
Materials and Methods
Data acquisition
The clinical information and RNA sequencing datasets (FPKM) of patients with UCEC were downloaded from TCGA (https://portal.gdc.cancer.gov/) database. We obtained an RNA sequencing dataset of 552 UCEC and 35 normal tissues (23 tumors had matching adjacent normal tissues). After excluding patients with EC with incomplete clinical information or who were lost to follow-up, 541 patients with EC were enrolled. The IRGs were selected from the Molecular Signatures database (HALLMARK_INFLAMMATORY_RESPONSE (gsea-msigdb.org)). Immunotherapy data were obtained from IMvigor210.
Construction of model and nomogram
We used univariate Cox regression analysis to analyze the 200 IRGs from the Molecular Signatures database to identify prognostic IRGs associated with OS. Because only TCGA contained prognostic information for patients with EC, we could only test our model internally. The TCGA-UCEC patients were randomly and equally divided into training (n = 272) and test (n = 269) groups. We then used LASSO-penalized Cox regression analysis on the training set [44]. Risk score was calculated as esum(expression of each gene × corresponding coefficient). The UCEC patient prognostic data in the training group were divided into high- and low-risk subgroups based on the median risk score as the cutoff value. The test group was used to verify the validity of the proposed model. R packages “regplot” and “rms” were used to build a nomogram by combining the clinical information of patients with EC and compared with previously established models. GSEA was used to analyze KEGG and GO enrichment in this model. Correlation analysis of immune function was based on ssGSEA [45].
Tumor microenvironment analysis
The R (version 4.1.1) package “ESTIMATE” was used to analyze infiltration of immune and stromal cells [46]. We extracted Cancer stem cells (CSCs) data for each patient from their epigenomic and transcriptomic data to measure CSCs characteristics. Spearman analysis was used for statistical analysis.
Predicting the chemotherapeutic immunotherapy response
The packages in R were used to evaluate the sensitivity of patients to chemotherapy drugs. Half-maximal inhibitory concentration (IC50) was calculated to compare drug sensitivity. Wilcoxon rank test and the “ggplot” package was used to visualize the result. Data sets from IMvigor210 were used to evaluate the efficacy of immunotherapy in cancer patients.
Screening of key genes in the model
We utilized the “limma” package in R software to identify the differentially expressed IRGs (DEIRGs) among the 200 selected genes. Our selection criteria for DEIRGs were |log2 fold change (FC)| ≥ 2 and false discovery rate < 0.05. Subsequently, we generated heatmaps and volcano plots using the “pheatmap” package. We then overlapped the DEIRGs with the genes in the model to identify the key genes. These key genes not only play a significant role in the model but may also contribute to tumor development, and further experiments will be conducted to verify their importance.
Human tissue specimens
We obtained 43 samples of normal endometrial tissues and 37 samples of uterine corpus EC tissues from Shengjing Hospital of China Medical University, China, between 2019 to 2021. Complete clinicopathological information was obtained for 32 patients with EC. All patients provided informed consent. The pathologic type of all cases of EC was endometrial adenocarcinoma, and the pathological diagnosis was made by two experienced pathologists in accordance with the International Federation of Gynecology and Obstetrics (FIGO 2009). None of the patients received any form of hormone, radiotherapy, chemotherapy, or treatment prior to surgery.
Transfection of cells
SiRNA sequences targeting LAMP3, MEP1A and ROS1, along with their respective negative control (NC) counterparts, were procured from GenePharma (Shanghai, China). Lipofectamine 3000 (Invitrogen) was used to transfect cells with the siRNA according to the manufacturer’s instructions for subsequent experiments. Sequences of siRNA are listed in Supplementary Table 1.
qRT-PCR
Total RNA was extracted using TRIzol reagent (Vazyme, Nanjing, China). Subsequently, cDNAs were synthesized using Prime Script RT-polymerase (Vazyme). SYBR Green Premix (Vazyme) with specific PCR primers (Sangon Biotech, Shanghai, China) were used to detect the expression level of corresponding gene RNA. The primer sequences are provided in Supplementary Table 2. The fold-changes were calculated using the 2−ΔΔCT method.
Cell culture
The Ishikawa cells were cultured in RPMI 1640 medium (Gibco, Carlsbad, CA, USA), supplemented with 10% fetal bovine serum (FBS) (Gibco) and 1% penicillin–streptomycin. The cells were maintained in a humidified incubator at 37° C with 5% CO2.
Colony formation assay
To investigate the impact of LAMP3, MEP1A and ROS1 expression on cell proliferation, Ishikawa cells were transfected with NC-siRNA or siRNA targeting the genes of LAMP3, MEP1A, and ROS1. Additionally, a blank group without siRNA was included. Following transfection, 1000 cells were seeded to each well of 6-well culture plates and incubated for two weeks. Afterward, the cells were stained with 0.1% crystal violet, and the number of colonies was counted using light microscopy.
CCK-8 assay
Ishikawa cells were seeded in 96-well plates, and to each well, CCK-8 reagent (10 μL) (Dojindo, Kumamoto Japan) was added. The cells were then incubated at 37° C with 5% CO2 for 3 h. The OD 450 nm was measured using a microplate reader at 0, 24, 48, and 72 hours after treatment to determine the cell viability.
Cell invasion assay
Transwell chambers (Corning, NY, USA) (pore size:8μm) were utilized to evaluate cell invasion ability. Prior to seeding cells, the chambers were coated with Matrigel solution (BD, Franklin Lakes, NJ, USA), and the upper chamber was filled with 200μl serum-free medium. The lower chamber was supplemented with 10%FBS serum. After incubation for 24 hours, the invading cells that penetrated the Matrigel and reached the lower surface of the membrane were fixed with 4% paraformaldehyde and stained with 0.1% crystal violet. Images were obtained using a fluorescence inversion microscope (200× magnification) and subsequently analyzed.
Apoptosis assay
After cell transfection, 106 cells from each group were washed and stained Annexin V-APC and 7AAD (Elabscience, Wu Han, China) at room temperature for 15 min. Flow cytometry (BD FACSCalibur, New Jersey, USA) was used to evaluate the proportion of apoptotic cells (low right corner of the flow cytometry graph regarded as apoptotic cells).
Statistical analysis
The GraphPad Prism 8 (GraphPad Software, CA, United States) were used for statistical analysis. Each experiment was repeated three times independently. Data are presented as mean ± standard deviation (SD). Two-way comparisons between groups were analyzed using the t-test, and multiple group comparisons were analyzed using one-way ANOVA. Statistical significance was set at p < 0.05.
Availability of data and materials
All data generated or analyzed during this study are included in this article.
Consent for publication
We have obtained consent to publish this paper from all the participants of this study.
Abbreviations
EC: endometrial cancer; UCEC: uterine corpus endometrial cancer; IRGs: inflammatory response-related genes; DEIRGs: differentially expressed inflammatory response-related genes; TCGA: The Cancer Genome Atlas; TME: the tumor microenvironment; CSCs: Cancer stem cells; LASSO: Least absolute shrinkage and selection operator; KM: Kaplan-Meier; ROC: receiver operating characteristic; AUCs: areas under the ROC curves; ssGSEA: Single-sample Gene Set Enrichment Analysis; RNAss: RNA stemness scores; DNAss: DNA stemness scores; qRT-PCR: quantitative real-time PCR; mRNA: messenger RNA; OS: overall survival; GO: Gene Ontology; KEGG: Kyoto Encyclopedia of Genes and Genomes; CAMs: cell adhesion molecules; LAMP3: lysosomal associated membrane protein 3; MEP1A: meprin A subunit alpha; ROS1: ROS proto-oncogene 1.
Author Contributions
YW and XM designed the study. YW drafted the manuscript. YW and BW were involved in collating the data. All authors participated in the manuscript editing. All authors read and approved the final manuscript.
Acknowledgments
The authors thank members of their laboratory and collaborators for supporting this research.
Conflicts of Interest
The authors declare that they have no conflicts of interest.
Ethical Statement and Consent
This study was approved by the Institutional Review Committee (Ethical No. 2018PS251K, 2018PS136K) of the Shengjing Hospital affiliated to China Medical University, and experimentation was conducted based on the approved guidelines. All patients provided informed consent.
Funding
Our study was supported by the National Natural Science Foundation of China (No. 81872123), Liaoning Provincial Higher Education Innovation Team, Distinguished Professor of Liaoning Province, China Medical University’s 2018 Discipline Construction “Major Special Construction Plan” (No. 3110118029), and Outstanding Scientific Fund of Shengjing Hospital (No. 201601).
Editorial Note
This corresponding author has a verified history of publications using a personal email address for correspondence
References
- 1. Bray F, Ferlay J, Soerjomataram I, Siegel RL, Torre LA, Jemal A. Global cancer statistics 2018: GLOBOCAN estimates of incidence and mortality worldwide for 36 cancers in 185 countries. CA Cancer J Clin. 2018; 68:394–424. https://doi.org/10.3322/caac.21492 [PubMed]
- 2. Weiderpass E, Antoine J, Bray FI, Oh JK, Arbyn M. Trends in corpus uteri cancer mortality in member states of the European Union. Eur J Cancer. 2014; 50:1675–84. https://doi.org/10.1016/j.ejca.2014.02.020 [PubMed]
- 3. Stein Y, Aloni-Grinstein R, Rotter V. Mutant p53-a potential player in shaping the tumor-stroma crosstalk. J Mol Cell Biol. 2019; 11:600–4. https://doi.org/10.1093/jmcb/mjz071 [PubMed]
- 4. Visvader JE, Lindeman GJ. Cancer stem cells: current status and evolving complexities. Cell Stem Cell. 2012; 10:717–28. https://doi.org/10.1016/j.stem.2012.05.007 [PubMed]
- 5. Atashzar MR, Baharlou R, Karami J, Abdollahi H, Rezaei R, Pourramezan F, Zoljalali Moghaddam SH. Cancer stem cells: A review from origin to therapeutic implications. J Cell Physiol. 2020; 235:790–803. https://doi.org/10.1002/jcp.29044 [PubMed]
- 6. Hanahan D, Weinberg RA. Hallmarks of cancer: the next generation. Cell. 2011; 144:646–74. https://doi.org/10.1016/j.cell.2011.02.013 [PubMed]
- 7. Neagu M, Constantin C, Caruntu C, Dumitru C, Surcel M, Zurac S. Inflammation: A key process in skin tumorigenesis. Oncol Lett. 2019; 17:4068–84. https://doi.org/10.3892/ol.2018.9735 [PubMed]
- 8. Kiely M, Lord B, Ambs S. Immune response and inflammation in cancer health disparities. Trends Cancer. 2022; 8:316–27. https://doi.org/10.1016/j.trecan.2021.11.010 [PubMed]
- 9. Galizia G, Lieto E, Auricchio A, Cardella F, Mabilia A, Podzemny V, Castellano P, Orditura M, Napolitano V. Naples Prognostic Score, Based on Nutritional and Inflammatory Status, is an Independent Predictor of Long-term Outcome in Patients Undergoing Surgery for Colorectal Cancer. Dis Colon Rectum. 2017; 60:1273–84. https://doi.org/10.1097/DCR.0000000000000961 [PubMed]
- 10. Li Q, Cong R, Wang Y, Kong F, Ma J, Wu Q, Ma X. Naples prognostic score is an independent prognostic factor in patients with operable endometrial cancer: Results from a retrospective cohort study. Gynecol Oncol. 2021; 160:91–8. https://doi.org/10.1016/j.ygyno.2020.10.013 [PubMed]
- 11. Zhang L, Zhang B, Wei M, Xu Z, Kong W, Deng K, Xu X, Zhang L, Zhao X, Yan L. TRIM22 inhibits endometrial cancer progression through the NOD2/NF-κB signaling pathway and confers a favorable prognosis. Int J Oncol. 2020; 56:1225–39. https://doi.org/10.3892/ijo.2020.5004 [PubMed]
- 12. Lu W, He F, Lin Z, Liu S, Tang L, Huang Y, Hu Z. Dysbiosis of the endometrial microbiota and its association with inflammatory cytokines in endometrial cancer. Int J Cancer. 2021; 148:1708–16. https://doi.org/10.1002/ijc.33428 [PubMed]
- 13. Cai L, Hu C, Yu S, Liu L, Zhao J, Zhao Y, Lin F, Du X, Yu Q, Xiao Q. Identification of EMT-Related Gene Signatures to Predict the Prognosis of Patients With Endometrial Cancer. Front Genet. 2020; 11:582274. https://doi.org/10.3389/fgene.2020.582274 [PubMed]
- 14. Liu J, Li S, Feng G, Meng H, Nie S, Sun R, Yang J, Cheng W. Nine glycolysis-related gene signature predicting the survival of patients with endometrial adenocarcinoma. Cancer Cell Int. 2020; 20:183. https://doi.org/10.1186/s12935-020-01264-1 [PubMed]
- 15. Liu J, Mei J, Li S, Wu Z, Zhang Y. Establishment of a novel cell cycle-related prognostic signature predicting prognosis in patients with endometrial cancer. Cancer Cell Int. 2020; 20:329. https://doi.org/10.1186/s12935-020-01428-z [PubMed]
- 16. Malta TM, Sokolov A, Gentles AJ, Burzykowski T, Poisson L, Weinstein JN, Kamińska B, Huelsken J, Omberg L, Gevaert O, Colaprico A, Czerwińska P, Mazurek S, et al, and Cancer Genome Atlas Research Network. Machine Learning Identifies Stemness Features Associated with Oncogenic Dedifferentiation. Cell. 2018; 173:338–54.e15. https://doi.org/10.1016/j.cell.2018.03.034 [PubMed]
- 17. Kitson SJ, Evans DG, Crosbie EJ. Identifying High-Risk Women for Endometrial Cancer Prevention Strategies: Proposal of an Endometrial Cancer Risk Prediction Model. Cancer Prev Res (Phila). 2017; 10:1–13. https://doi.org/10.1158/1940-6207.CAPR-16-0224 [PubMed]
- 18. Njoku K, Abiola J, Russell J, Crosbie EJ. Endometrial cancer prevention in high-risk women. Best Pract Res Clin Obstet Gynaecol. 2020; 65:66–78. https://doi.org/10.1016/j.bpobgyn.2019.12.005 [PubMed]
- 19. Morice P, Leary A, Creutzberg C, Abu-Rustum N, Darai E. Endometrial cancer. Lancet. 2016; 387:1094–108. https://doi.org/10.1016/S0140-6736(15)00130-0 [PubMed]
- 20. Ellis PE, Barron GA, Bermano G. Adipocytokines and their relationship to endometrial cancer risk: A systematic review and meta-analysis. Gynecol Oncol. 2020; 158:507–16. https://doi.org/10.1016/j.ygyno.2020.05.033 [PubMed]
- 21. Wang T, Rohan TE, Gunter MJ, Xue X, Wactawski-Wende J, Rajpathak SN, Cushman M, Strickler HD, Kaplan RC, Wassertheil-Smoller S, Scherer PE, Ho GY. A prospective study of inflammation markers and endometrial cancer risk in postmenopausal hormone nonusers. Cancer Epidemiol Biomarkers Prev. 2011; 20:971–7. https://doi.org/10.1158/1055-9965.EPI-10-1222 [PubMed]
- 22. Trabert B, Eldridge RC, Pfeiffer RM, Shiels MS, Kemp TJ, Guillemette C, Hartge P, Sherman ME, Brinton LA, Black A, Chaturvedi AK, Hildesheim A, Berndt SI, et al. Prediagnostic circulating inflammation markers and endometrial cancer risk in the prostate, lung, colorectal and ovarian cancer (PLCO) screening trial. Int J Cancer. 2017; 140:600–10. https://doi.org/10.1002/ijc.30478 [PubMed]
- 23. Fortner RT, Hüsing A, Kühn T, Konar M, Overvad K, Tjønneland A, Hansen L, Boutron-Ruault MC, Severi G, Fournier A, Boeing H, Trichopoulou A, Benetou V, et al. Endometrial cancer risk prediction including serum-based biomarkers: results from the EPIC cohort. Int J Cancer. 2017; 140:1317–23. https://doi.org/10.1002/ijc.30560 [PubMed]
- 24. Chen H, Wu Q, Zhang Y, Li Q, Ma J, Kong F, Ma X. Nomograms based on the novel platelet index score predict postoperative prognosis in endometrial cancer. Gynecol Oncol. 2020; 158:689–97. https://doi.org/10.1016/j.ygyno.2020.05.040 [PubMed]
- 25. AlHilli MM, Podratz KC, Dowdy SC, Bakkum-Gamez JN, Weaver AL, McGree ME, Keeney GL, Cliby WA, Mariani A. Risk-scoring system for the individualized prediction of lymphatic dissemination in patients with endometrioid endometrial cancer. Gynecol Oncol. 2013; 131:103–8. https://doi.org/10.1016/j.ygyno.2013.06.037 [PubMed]
- 26. AlHilli MM, Mariani A, Bakkum-Gamez JN, Dowdy SC, Weaver AL, Peethambaram PP, Keeney GL, Cliby WA, Podratz KC. Risk-scoring models for individualized prediction of overall survival in low-grade and high-grade endometrial cancer. Gynecol Oncol. 2014; 133:485–93. https://doi.org/10.1016/j.ygyno.2014.03.567 [PubMed]
- 27. Thorsson V, Gibbs DL, Brown SD, Wolf D, Bortone DS, Ou Yang TH, Porta-Pardo E, Gao GF, Plaisier CL, Eddy JA, Ziv E, Culhane AC, Paull EO, et al, and Cancer Genome Atlas Research Network. The Immune Landscape of Cancer. Immunity. 2018; 48:812–30.e14. https://doi.org/10.1016/j.immuni.2018.03.023 [PubMed]
- 28. Greten FR, Grivennikov SI. Inflammation and Cancer: Triggers, Mechanisms, and Consequences. Immunity. 2019; 51:27–41. https://doi.org/10.1016/j.immuni.2019.06.025 [PubMed]
- 29. Zhang Q, He Y, Luo N, Patel SJ, Han Y, Gao R, Modak M, Carotta S, Haslinger C, Kind D, Peet GW, Zhong G, Lu S, et al. Landscape and Dynamics of Single Immune Cells in Hepatocellular Carcinoma. Cell. 2019; 179:829–45.e20. https://doi.org/10.1016/j.cell.2019.10.003 [PubMed]
- 30. Fu J, Xu D, Liu Z, Shi M, Zhao P, Fu B, Zhang Z, Yang H, Zhang H, Zhou C, Yao J, Jin L, Wang H, et al. Increased regulatory T cells correlate with CD8 T-cell impairment and poor survival in hepatocellular carcinoma patients. Gastroenterology. 2007; 132:2328–39. https://doi.org/10.1053/j.gastro.2007.03.102 [PubMed]
- 31. Bao S, Wu Q, McLendon RE, Hao Y, Shi Q, Hjelmeland AB, Dewhirst MW, Bigner DD, Rich JN. Glioma stem cells promote radioresistance by preferential activation of the DNA damage response. Nature. 2006; 444:756–60. https://doi.org/10.1038/nature05236 [PubMed]
- 32. Huang Z, Cheng L, Guryanova OA, Wu Q, Bao S. Cancer stem cells in glioblastoma--molecular signaling and therapeutic targeting. Protein Cell. 2010; 1:638–55. https://doi.org/10.1007/s13238-010-0078-y [PubMed]
- 33. Schonberg DL, Lubelski D, Miller TE, Rich JN. Brain tumor stem cells: Molecular characteristics and their impact on therapy. Mol Aspects Med. 2014; 39:82–101. https://doi.org/10.1016/j.mam.2013.06.004 [PubMed]
- 34. Mandal G, Biswas S, Anadon CM, Yu X, Gatenbee CD, Prabhakaran S, Payne KK, Chaurio RA, Martin A, Innamarato P, Moran C, Powers JJ, Harro CM, et al. IgA-Dominated Humoral Immune Responses Govern Patients’ Outcome in Endometrial Cancer. Cancer Res. 2022; 82:859–71. https://doi.org/10.1158/0008-5472.CAN-21-2376 [PubMed]
- 35. Osorio JC, Zamarin D. Beyond T Cells: IgA Incites Immune Recognition in Endometrial Cancer. Cancer Res. 2022; 82:766–8. https://doi.org/10.1158/0008-5472.CAN-21-4385 [PubMed]
- 36. Cavaliere AF, Perelli F, Zaami S, D’Indinosante M, Turrini I, Giusti M, Gullo G, Vizzielli G, Mattei A, Scambia G, Vidiri A, Signore F. Fertility Sparing Treatments in Endometrial Cancer Patients: The Potential Role of the New Molecular Classification. Int J Mol Sci. 2021; 22:12248. https://doi.org/10.3390/ijms222212248 [PubMed]
- 37. Tanos P, Dimitriou S, Gullo G, Tanos V. Biomolecular and Genetic Prognostic Factors That Can Facilitate Fertility-Sparing Treatment (FST) Decision Making in Early Stage Endometrial Cancer (ES-EC): A Systematic Review. Int J Mol Sci. 2022; 23:2653. https://doi.org/10.3390/ijms23052653 [PubMed]
- 38. Rochigneux P, Garcia AJ, Chanez B, Madroszyk A, Olive D, Garon EB. Medical Treatment of Lung Cancer: Can Immune Cells Predict the Response? A Systematic Review. Front Immunol. 2020; 11:1036. https://doi.org/10.3389/fimmu.2020.01036 [PubMed]
- 39. Susumu N, Sagae S, Udagawa Y, Niwa K, Kuramoto H, Satoh S, Kudo R, and Japanese Gynecologic Oncology Group. Randomized phase III trial of pelvic radiotherapy versus cisplatin-based combined chemotherapy in patients with intermediate- and high-risk endometrial cancer: a Japanese Gynecologic Oncology Group study. Gynecol Oncol. 2008; 108:226–33. https://doi.org/10.1016/j.ygyno.2007.09.029 [PubMed]
- 40. Maggi R, Lissoni A, Spina F, Melpignano M, Zola P, Favalli G, Colombo A, Fossati R. Adjuvant chemotherapy vs radiotherapy in high-risk endometrial carcinoma: results of a randomised trial. Br J Cancer. 2006; 95:266–71. https://doi.org/10.1038/sj.bjc.6603279 [PubMed]
- 41. Randall ME, Filiaci VL, Muss H, Spirtos NM, Mannel RS, Fowler J, Thigpen JT, Benda JA, and Gynecologic Oncology Group Study. Randomized phase III trial of whole-abdominal irradiation versus doxorubicin and cisplatin chemotherapy in advanced endometrial carcinoma: a Gynecologic Oncology Group Study. J Clin Oncol. 2006; 24:36–44. https://doi.org/10.1200/JCO.2004.00.7617 [PubMed]
- 42. Crosbie EJ, Kitson SJ, McAlpine JN, Mukhopadhyay A, Powell ME, Singh N. Endometrial cancer. Lancet. 2022; 399:1412–28. https://doi.org/10.1016/S0140-6736(22)00323-3 [PubMed]
- 43. Voelker R. Immunotherapy Approved for Endometrial Cancer. JAMA. 2021; 325:2143. https://doi.org/10.1001/jama.2021.8319 [PubMed]
- 44. Simon N, Friedman J, Hastie T, Tibshirani R. Regularization Paths for Cox’s Proportional Hazards Model via Coordinate Descent. J Stat Softw. 2011; 39:1–13. https://doi.org/10.18637/jss.v039.i05 [PubMed]
- 45. Subramanian A, Tamayo P, Mootha VK, Mukherjee S, Ebert BL, Gillette MA, Paulovich A, Pomeroy SL, Golub TR, Lander ES, Mesirov JP. Gene set enrichment analysis: a knowledge-based approach for interpreting genome-wide expression profiles. Proc Natl Acad Sci USA. 2005; 102:15545–50. https://doi.org/10.1073/pnas.0506580102 [PubMed]
- 46. Yoshihara K, Shahmoradgoli M, Martínez E, Vegesna R, Kim H, Torres-Garcia W, Treviño V, Shen H, Laird PW, Levine DA, Carter SL, Getz G, Stemke-Hale K, et al. Inferring tumour purity and stromal and immune cell admixture from expression data. Nat Commun. 2013; 4:2612. https://doi.org/10.1038/ncomms3612 [PubMed]