


Introduction
Aging is an unavoidable age-associated physiological decline caused by a progressive dysregulation of certain cellular and organismal processes [1]. Cancer is the leading cause of death worldwide and was regarded as an aging-related disease as most individuals are diagnosed after they reach fifty [2]. Mortality statistics also reflected the age dependency of cancers. According to the data from Global Burden of Disease Study (GBD 2019), elders ≥70 years old had the largest burden of cancer mortality [3]. Moreover, the underlying biological process of cancers hallmarks are overlapped with aging such as corrupted proteostasis, genomic instability, telomere attrition, aggravated inflammation and heightened cellular senescence [2]. Noteworthy, renal cell carcinoma (RCC) has a high occurrence in aged 65 years or older and an average first diagnosed age at 64, making it one of cancer types strongly correlated with aging [4]. As such aging and cancer are considered as two tightly interconnected biological phenomena; however, the studies of aging risk factors in cancer animal models and cancer patients are rare and insufficient to be represented in cancer clinical trials.
Long noncoding RNA (lncRNA) represents a large group of noncoding RNA that is generally classified as transcripts ≥ 200bp without coding potential [5, 6]. With the significantly important and indispensable roles in various biological processes and dynamic expression patterns in tissues and cells, lncRNAs have been implicated promising diagnostic and prognostic biomarkers in human diseases especially in cancers [7]. In our previous study of deciphering lncRNA features in 171 individuals from centenarian (CEN) families, 8 candidate aging related lncRNAs (CarLncs) were identified including THBS1-IT1, THBS1-AS1, DCHS1-AS1, LINC01871, LEF1-AS1-201, WDR11-AS1-201 and GRAPLDR. Comparing with normal elders, these 8 CarLncs displayed consistent and significant dysregulation in the healthy aging models – CENs and their offsprings (8). In vitro functional assays validated that these lncRNAs especially THBS1-IT1 and THBS1-AS1 are involved in cellular senescence process and may act as anti-cellular aging protective elements in the healthy aging of CENs [8]. THBS1-AS1 was positively related with cardiac fibrosis and regulates the expression of Tgfbr1 through sponging with mir-221/222 [9]. To gain a better knowledge of potential function of aging related factors in cancer ontogeny and cancer treatment, we analyzed the expression signatures of 8 CarLncs in kidney renal clear cell carcinoma (KIRC) as KIRC is a histopathological subtype of RCC that represents 80% to 90% of all RCC tumors. Analyses such as co-efficient correlation analysis, Wilcoxon test, random forest (RF) algorithms and support vector machine (SVM) were used for screening and validating the prognostic risk-related factors. Five genes were finally selected and employed for KIRC prognosis, among which, THBS1-IT1 was further evaluated for a pan-cancer analysis as it exhibited significant dysregulation in 12 cancers. Our results demonstrated that THBS1-IT1 possesses potential capacity for the prognosis of multiple cancers. Taken together, this study provided new insights into the complicated and underlying associations between aging and cancers.
Materials and Methods
Data availability
The KIRC cohort data which contain 541 tumor samples and 72 para-cancer samples were downloaded from TCGA data portal (https://portal.gdc.cancer.gov). Gene expression profiles, survival values, clinicopathological information and somatic mutation data of 33 tumor types, as well as the gene expression levels of 31 tissues in GTEx database, were obtained from UCSC Xena browser (https://xena.ucsc.edu).
Identification of AR-subgroup using the expression profiles of CarLncs
The Wilcoxon test was used to determine the variation of 8 CarLncs’ expression among 541 KIRC patients. Using their expression profiles, we employed consensus clustering to define distinct aging-related subgroups (AR-subgroup) by k-means algorithms in R platform [10]. The quantity and consistency of clusters were evaluated by “ConsensusClusterPlus” R package with default parameters [11]. To ensure the stability of the categories, 50 iterations and 80% resampling rate Pearson correlation analysis was performed.
Characterization of TME in two AR-subgroups
Principal component analysis (PCA) analysis was performed to demonstrate the internal distribution of each AR-subgroup. To investigate the differences of biological function of 8 CarLncs, gene set variation analysis (GSVA) was conducted using the KEGG gene set (c2.cp.kegg.v7.4) [12]. The infiltrating fractions of immune cells were identified via single-sample gene set enrichment analysis (ssGSEA) algorithm with default parameters [10].
Correlation between AR-subgroups and clinical characteristics
To determine the clinical significance of AR-subgroups, we investigated the association among molecular patterns, clinical features, and survival outcomes. Age, gender, grade, stage, T-stage, M-stage, and N-stage were included as the clinical variables.
Comparisons of OS between AR-subgroups in KIRC
Kaplan–Meier (KM) analysis was used to evaluate the difference of OS between two AR-subgroups via “survival” and “survminer” R packages.
Construction of the CarLnc-miRNA-mRNA network
The CarLnc-miRNA-mRNA network was conducted following an optimized method described in previous studies [13, 14]. Firstly, differentially expressed mRNAs (DE-mRNA) and miRNAs (DE-miRNA) between AR-subgroups were identified by “limma” R package with parameters of |log2(fold change) | > 0 and p value < 0.05. MiRNA targets that potentially bound to CarLncs (miRNA-Tgt) were predicted by lncBase Predicted v.2 database [15]. Subsequently, three databases include miRDB [16], miRTarBase [17] and TargetScan [18] were used to predict mRNA targets of miRNA-Tgt (mRNA-Tgt). Finally, only the overlapped miRNA/mRNA between miRNAs-Tgt and DE-miRNAs/mRNAs-Tgt and DE-mRNAs were retained and their interplays with CarLncs were visualized using Cytoscape 3.9.0 software [19].
Functional enrichment analysis
Gene Ontology (GO) [20] and Kyoto Encyclopedia of Genes and Genomes (KEGG) [21] analyses were conducted by “clusterProfiler” R package [22].
Screening feature genes of AR-subgroups
Feature genes are genes that can be used to distinguish the two AR-subgroups. The molecules within CarLnc-miRNA-mRNA network were used to determine the feature genes by random forest (RF) algorithm and support vector machine - recursive feature elimination (SVM-RFE). At the first step, “e1071” [23] and “caret” [24] R packages were utilized for screening the optimal gene sets as the signature of AR-Subgroups using SVM-RFE method [25] as SVM-RFE is an iterative backward elimination procedure for feature selection [24]. Secondly, “randomForest” R package was used to construct the optimal random forest classification model (ntree=500), and then to evaluate the correlation weight of genes within the network to characterize the effect of the gene on aging-related classification (indicator “MeanDecreaseGini”) [26]. Finally, the intersected genes between the optimal gene set screened by the SVM-RFE algorithm and the top-ranked genes with “MeanDecreaseGini” ≥2.0 were regarded as aging-related feature genes in KIRC patients.
Establishment of a predictive nomogram
The “rms” R package [27] was used to depict a nomogram to provide clinical predictions for KIRC patients using their LncAging_scores and clinicopathological characteristics such as age, gender, stage, 1-, 3-, and 5-year OS. Next, we performed calibration curve, decision curve analysis (DCA) and concordance index (C-index) to verify the clinical reliability of the established nomogram. Finally, we performed Kaplan–Meier (KM) analysis and ROC curve analysis on the risk score of the nomogram (Nomo-risk) to evaluate the accuracy of prognostic prediction.
Pan-cancer analysis of the association among THBS1-IT1, prognosis and clinical phenotype
Survival and clinical phenotype data were downloaded from TCGA. Four indicators include disease-specific survival (DSS), overall survival (OS), progression-free interval (PFI), and disease-free interval (DFI) were selected to explore the correlation between THBS1-IT1 expression and the prognostic status of patients. The effects of THBS1-IT1 expression on survival was evaluated by KM analysis and log-rank test using R packages “survival” and “survminer” as well as COX analysis by “survival” and “forestplot” methods [28].
Two clinical phenotypes consisting of tumor stage and age were selected and their relationships with THBS1-IT1 expression were explored. Patients were divided into two groups based on their ages, with 65 years old as the threshold. The correlation analyses were conducted using “limma” and “ggpubr” R-packages [29].
Correlation analysis of THBS1-IT1 with tumor mutation burden and tumor microsatellite instability in pan-cancer
Tumor Mutation Burden (TMB) scores were calculated following a published method which utilized Perl scripts for correction via dividing by the total length of exons [30]. Tumor Microsatellite Instability (MSI) scores in all samples were calculated using the somatic mutation data downloaded from TCGA (https://tcga.xenahubs.net). The correlations between THBS1-IT1 expression and TMB/MSI scores were analyzed by Spearman’s rank correlation coefficient.
Evaluation of the association between THBS1-IT1 and immunity in pan-cancer
The degree of infiltration of stromal or immune cells into tumors was assessed by estimating the immune scores and stromal scores using “estimate” and “limma” R packages as previously described [31]. The associations between THBS1-IT1 expression and the two scores were calculated by Spearman’s correlation co-efficient analysis [32]. Additionally, TIMER (Tumor Immune Estimation Resource) database [33] was utilized to analyze the infiltration of immune cells including Dendritic cells, B cells, Neutrophils, Macrophages, CD4+ T cells and CD8+ T cells in tumor tissues.
Statistical analysis
α = 0.05 was taken as the significance standard. Comparisons between groups were performed by Wilcoxon rank-sum test, independent samples T-test, chi-square test, Fisher’s exact test, etc. The correlation coefficient was analyzed by Spearman’s or Pearson’s correlation co-efficient analysis. All the R packages used in this study were operated by R (version 4.2.1).
Data availability statement
All the raw data in this study are available from the corresponding author upon reasonable request.
Results
Classification of aging related subgroups (AR-subgroups) in KIRC using CarLncs
The 8 CarLncs identified by our previous study were used as signatures genes to investigate their potential roles in KIRC (5). To gain the potential expression patterns and roles of 8 CarLncs in fields other than aging and cancer, we added the expression profiles of 8 CarLncs through the comprehensive human lncRNA database – LncExpDB (https://ngdc.cncb.ac.cn/lncexpdb/). Probably due to the genome annotation files used by LncExpDB database (Hg38) was different from our version (Hg19), only 5 lncRNAs were detected. It showed that the 5 CarLncs (THBS1-IT1, DCHS1-IT1, LINC01871, LEF1-AS1-201 and WDR11-DT-201) exhibit dynamic expression from early organogenesis to adulthood and display extinct tissue specificity and circadian rhythmicity (Supplementary Figure 1). For a better understanding of the aging related expression patterns in KIRC, a total of 514 tumor patients with both expression profiles and survival/clinicopathological data were enrolled to reveal the relationship between aging and tumorigenesis (Supplementary Table 1). The flowchart of this study was shown in Supplementary Figure 2. Firstly, we compared the expression levels of 8 CarLncs between tumor and adjacent tissues and found that THBS1-IT1, LINC01871, LEF1-AS1-201, CCL3-AS1-202, GRAPLDR and WDR11-DT-201 were significantly differentially expressed (Supplementary Figure 3, P<0.05), suggesting these 6 lncRNAs are related with both aging and KIRC. Using the expression profiles of the 6 dysregulated CarLncs (DS-CarLncs) as the candidate signatures, patients (n=514) were then subjected for classification using consensus clustering analysis. K-means clustering showed that the optimal clustering variable was 2 (Figure 1A) and patients were classified into two clusters (Figure 1B). A significant difference (P<0.05) of overall survival (OS) was observed between the two subgroups by KM analysis (Figure 1C). PCA analysis was used to display the intergroup distribution, which further confirmed that two clusters (cluster A and B) were well generated by CarLncs expression data (Figure 1D). As shown in Supplementary Figure 4, the comparisons of the expression level of 8 CarLncs and clinicopathological variables also suggested a substantial difference between these two groups. These results suggested the enrolled KIRC patients may possibly possess two different models of aging.
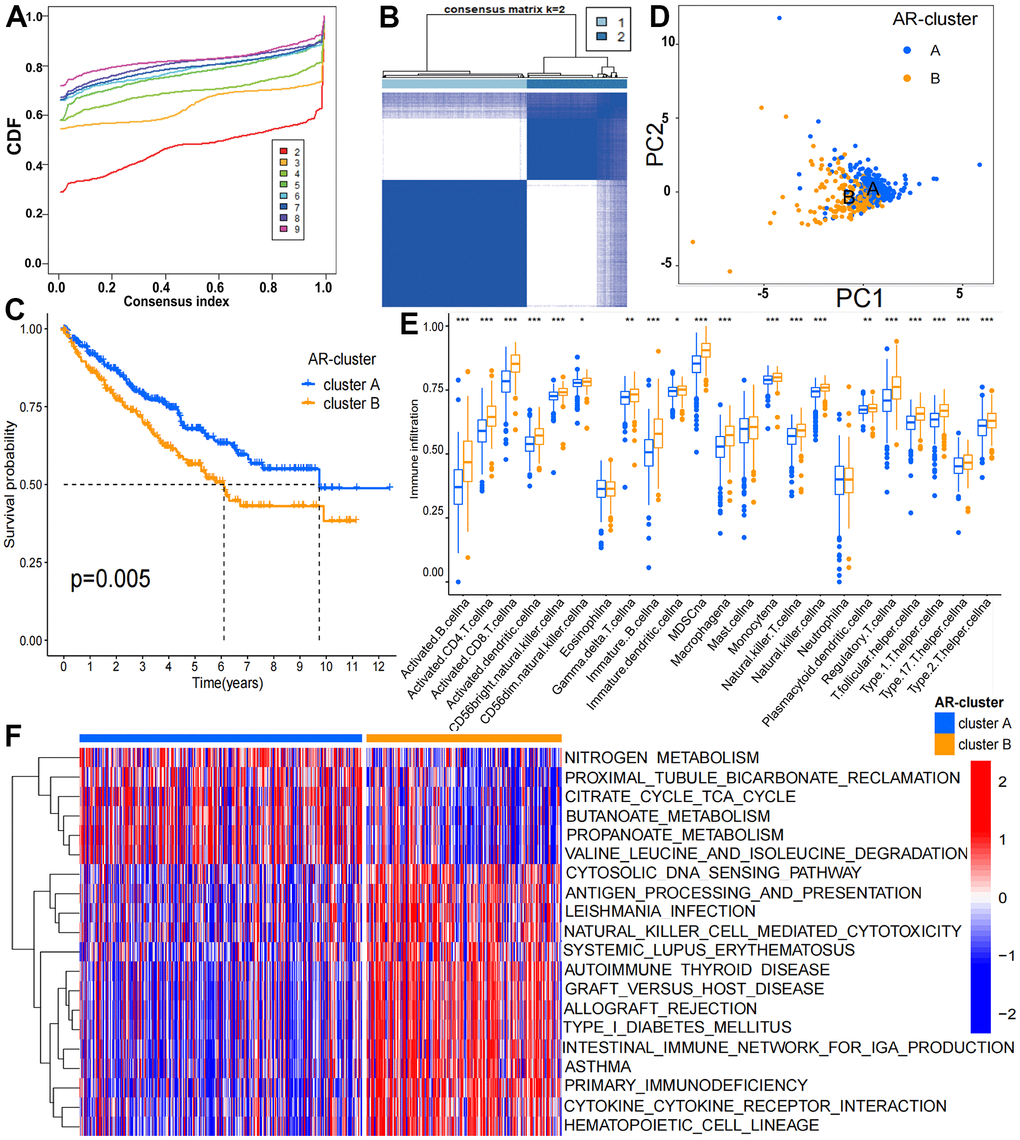
Figure 1. Clinicopathological and biological features of the two ARL subgroups divided by consistent clustering. (A) Consensus matrix CDFs from 2 to 9; (B) Two distinct clusters (k = 2) and their correlation area were identified by consensus matrix heatmap; (C) OS between cluster A and B is significantly different by KM analysis; (D) PCA analysis showed the transcriptome of the two subgroups is apparently different; (E) The abundance of 19 infiltrating immune cells is significantly different in two KIRC subgroups; (F) Biological pathways of the two distinct subgroups by GSVA analysis (p < 0.05 *; p < 0.01 **; p < 0.001 ***).
We noticed that the abundance of 24 immune cells between two clusters was substantially different (Figure 1E). The enrichment levels of 19 immune cell types were remarkably higher in cluster B (n = 211) than cluster A (n= 303), which include activated B cell, macrophage, activated CD4 T cell, MDSC, activated CD8 T cell, NK T cell, activated dendritic cell, NK cell, CD56 bright natural killer cell, type 17 T helper cell, CD56 dim natural killer cell, gamma delta T cell, type 1 T helper cell, immature B cell, immature dendritic cell, monocyte, regulatory T cell, T follicular helper cell, plasmacytoid dendritic cell and type 2 T helper cell. GSVA analysis suggested that cluster B was enriched in immune-associated pathways including intestinal immune network for IgA production (hsa04672), primary immunodeficiency (hsa05340) and autoimmune thyroid disease (hsa05320) while cluster A (n= 303) was enriched in metastasis-associated pathways consisting pyruvate metabolism (hsa00620), fatty acid metabolism and histidine metabolism (hsa01212) (Figure 1F and Supplementary Table 2). The results indicated the tumor immune environment of cluster A and B may be different.
Construction the CarLnc-miRNA-mRNA network
To elucidate the potential regulatory function of CarLncs in aging and KIRC tumorigenesis, a CarLnc-miRNA-mRNA network (Figure 2A) was constructed. Firstly, the potential miRNA targets of the 6 DS-CarLncs (miRNA-Tgt) and the candidate mRNA targets of miRNA-Tgt (mRNA-Tgt) were predicted using online web tools. Considering the AR-subgroups of KIRC were generated based on the expression patterns of 6 DS-CarLncs, differentially expressed mRNA (DE-mRNA) and miRNA (DE-miRNA) between two subgroups were identified as these mRNAs/miRNAs may also associated with these two aging models. Only 8 miRNAs are overlapped between DE-miRNA and miRNA-Tgt which include miR-199b-5p, miR-3200-3p, miR-138-5p, miR-23b-3p, miR-365a-3p, miR-365b-3p, miR-625-5p and miR-27a-3p. These 8 overlapped miRNAs are potential targets of 3 DS-CarLncs, which is THBS1-AS1, LEF1-AS1-201 and WDR11-DT-201. Comparing DE-mRNA and mRNA-Tgt,148 mRNAs were intersected and were retained for further analysis. Finally, a lncRNA-miRNA-mRNA regulatory network was constructed using the 148 mRNAs, the 8 miRNA and the 3 CarLnc (Figure 2A and Supplementary Table 3).
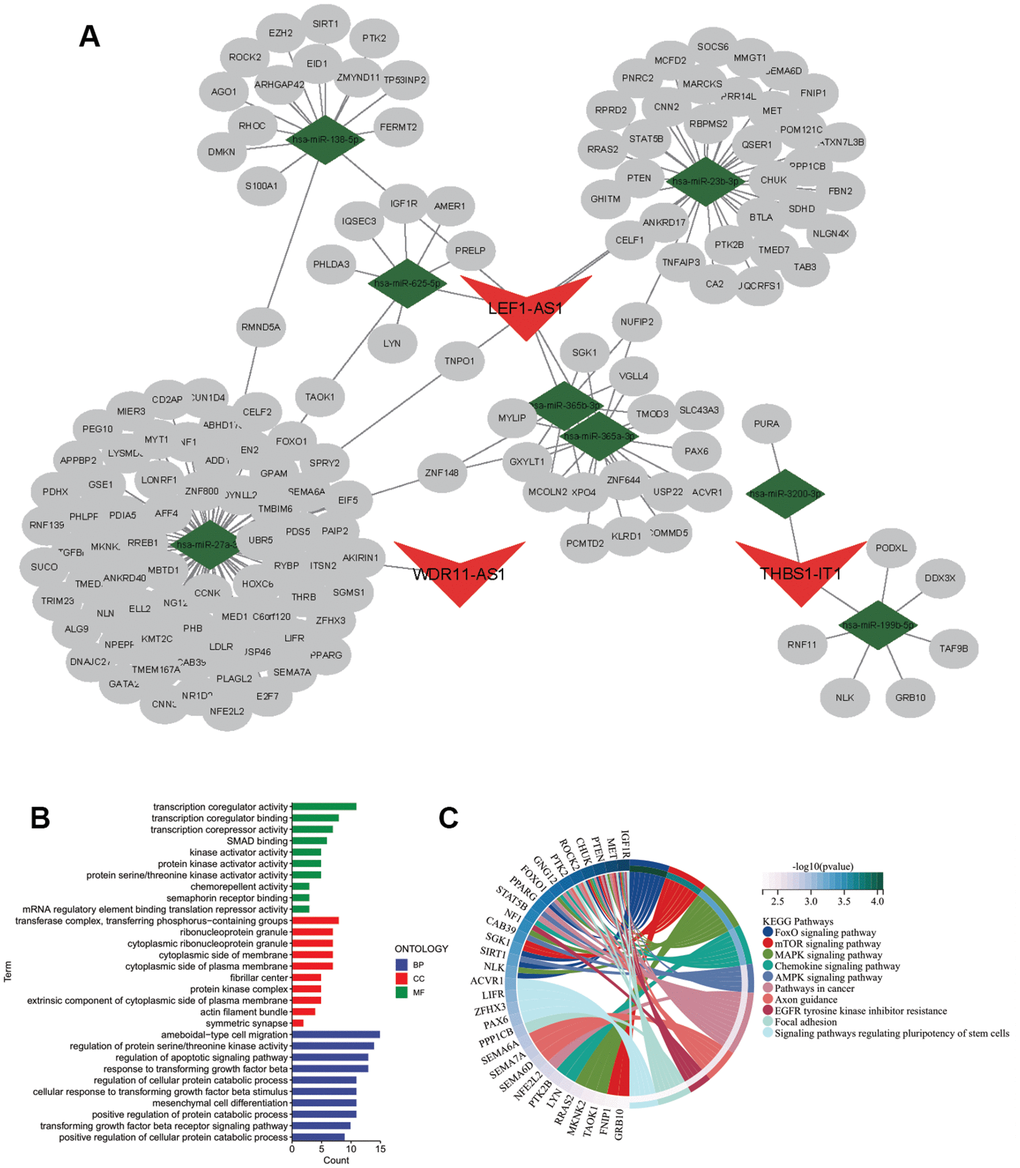
Figure 2. Regulatory network of CarLnc-miRNA-mRNA. (A) Visualization of CarLnc-miRNA-mRNA network by Cytoscape; (B) The top GO terms of the 148 mRNAs within the network by gene enrichment analysis; (C) The top enriched pathways of 148 mRNAs by KEGG enrichment analysis.
As the 148 mRNAs were differentially expressed between 2 AR-subgroups of KIRC, they were also predicted as targets of CarLncs related miRNAs; therefore, we hypothesized that they may be involved in both aging process and KIRC. To explore their potential function and association with aging/KIRC, functional enrichment analysis was employed. GO analysis showed that they were primarily associated with protein serine/threonine kinase activator activity (GO:0043539), serine/threonine protein kinase complex (GO:1902554) and positive regulation of protein catabolic process (GO:0045732) (q<0.05, Figure 2B). The pathway enrichment analysis revealed that they were associated with FoxO signaling pathway (hsa04068), MAPK signaling pathway (hsa04010) and mTOR signaling pathway (hsa04150) (q<0.05, Figure 2C).
Development of KIRC prognostic model using aging-related feature genes
SVM-RFE and RF algorithms were utilized to reduce the dimensionality of 159 genes within the network for feature genes identification. We obtained 19 genes with an optimal RMSE (Figure 3A) by SVM-RFE and 26 genes with “MeanDecreaseGini” index >2.0 by RF (Figure 3B). Among the two gene sets, 13 are overlapped in which THBS1-IT1 was included (Figure 3C). KIRC patients (n=514) were randomly assigned into the training cohort (n=345) and the validation cohort (n=169). Four selected clinical terms (age, gender, grade and stage) of the training and validation groups were subjected to Chi-square tests to evaluate the randomness between two AR-subgroups and non-significant difference was observed (Supplementary Table 4). After steps of filtering by multi-Cox analysis, five genes were selected as the variables for model construction. We developed CarLncs-based aging score (LncAging_score) prognostic model to predict prognosis of KIRC patients. By multivariate stepwise regression (Figure 3D), an optimal prognostic model using the TPM values (transcript per million) of 5 selected feature genes was constructed using the training dataset (Figure 3D), the formula was described as follows:
LncAging_score = 0.008* MMP11 + 0.066* THBS1-IT1 + (-0.014)* DYNLL2 + (-0.030)* RMND5A+ 0.008* PEG10.
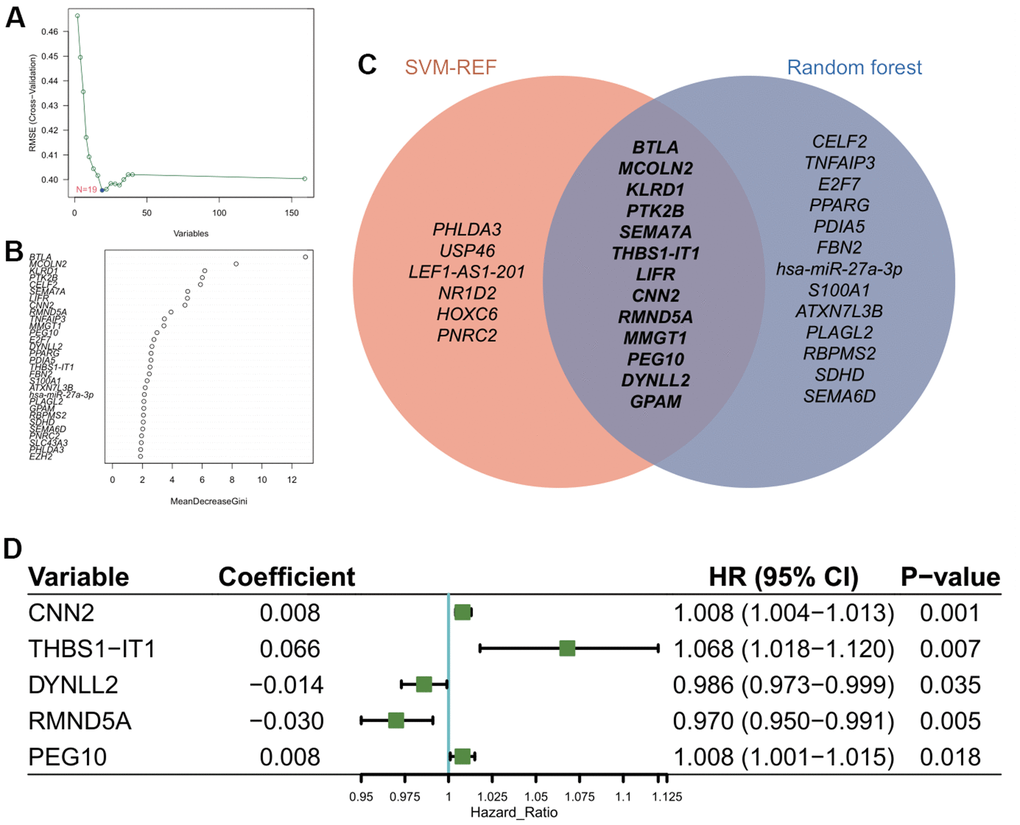
Figure 3. Construction of prognostic model using feature genes. (A) Identification of optimal gene set for the signature of CarLncs subgroups based on the SVM-RFE algorithm. (B) Top thirty genes with the highest “MeanDecreaseGini” for the optimal RF model. (C) Venn diagram of the overlapped genes of the two algorithms; (D) Independent prognostic factors for developing the aging related prognostic model were identified by Cox HR model.
Based on the aging-related prognostic model, CNN2, THBS1-IT1, DYNLL2, RMND5A and PEG10 were predicted as independent prognostic factors (Figure 3D, P<0.05), among which CNN2, THBS1-IT1 and PEG10 are risk factors (Figure 3D, hazard ratio (HR) >1). In the training cohort, Kaplan-Meier analysis indicated that low-risk patients had a better OS or PFI than high-risk patients (Figure 4A, 4B), and the AUCs of 1-, 3-, and 5-years OS were 0.727, 0.696, and 0.726, respectively (Figure 4C). The risk plot showed that OS was negatively while mortality was positively related with LncAging_score (Figure 4D, 4E). The correlation between risk power and gene expression level of 5 selected genes was shown in Figure 4F.
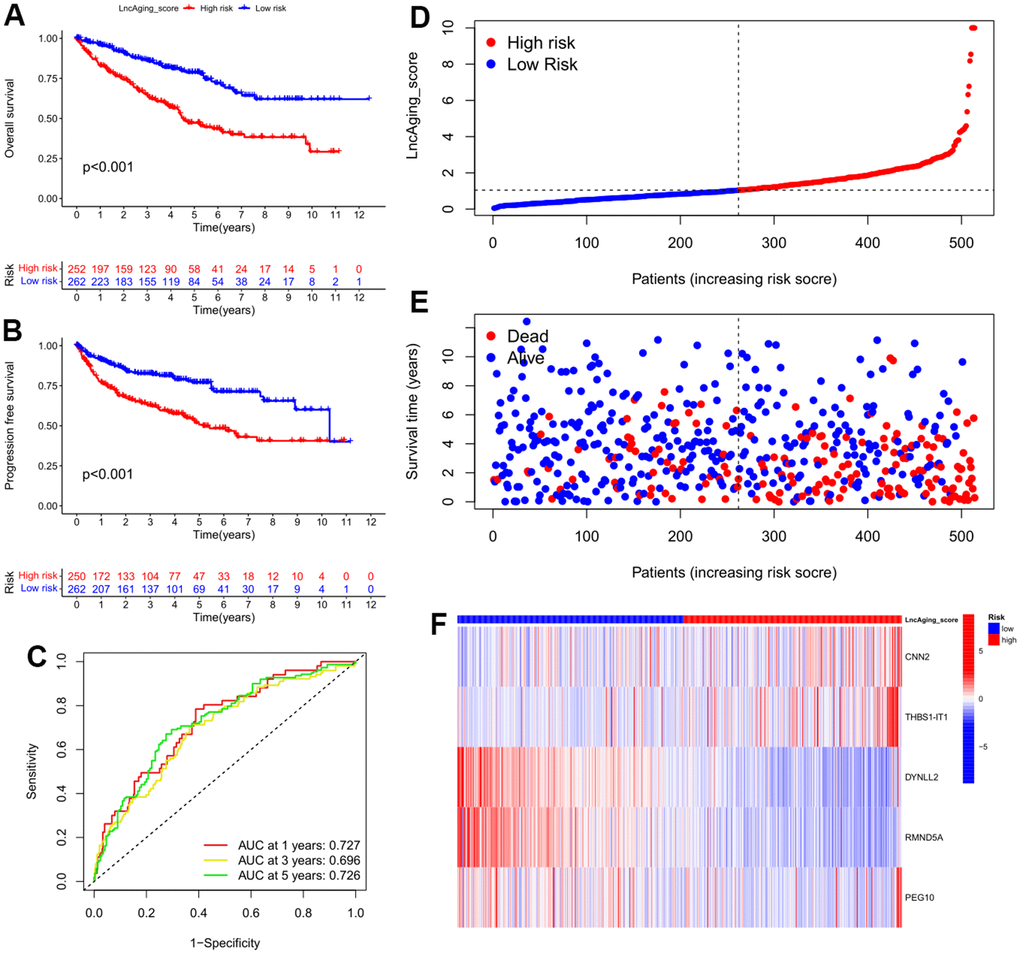
Figure 4. Features of LncAging_score as the prognostic model in the training cohort. (A) The sensitivity and specificity of 1-, 3-, and 5-year overall survival in two groups were predicted by ROC curves according to the LncAging_score; OS (B) and PFI (C) were compared between two groups by KM analysis; The distribution of LncAging_score (D) and survival status (E) in low- and high-risk patients was displayed by ranked dots and scatter plots; (F) The expression levels of 5 selected prognostic genes in two groups.
To assess the predictive robustness of the model, the LncAging_scores of validation group individuals were calculated. Using the median value LncAging_score of training cohort as the threshold, patients of validation group, training group as well as the entire cohort were separately assigned into 2 subgroups, which are low-risk (LncAging_score < median value) and high-risk (LncAging_score ≥ median value). Meanwhile, a superior OS was found in low-risk than high-risk patients by survival analysis and the 1-, 3-, and 5-year survival probability predicted by AUC value implied that LncAging_scores had a great performance in assessing the prognosis of KIRC patients (Supplementary Figure 5). The prognostic independence of LncAging_score and four clinical factors including age, disease grading, stage in the entire cohort demonstrated that LncAging_score, age, grade and stage are independent prognostic factors of KIRC (P<0.05, HR>1) (Supplementary Figure 6).
Nomogram analysis suggests LncAging_score is a good model for KIRC prognostic
To further assess the significance of LncAging_score in KIRC prognosis, LncAging_score together with three clinical parameters (age, sex and stage information) were incorporated as variables to predict 1-, 3-, and 5-year OS for the entire KIRC cohort by nomogram (Figure 5A). Calibration curves of the established nomogram presented good consistency between actual observations and predicted values (Figure 5B). LncAging_score combined with the three clinical factors presented the best net benefits than single variable for predicting prognosis (Figure 5C, 5D). The AUC values of Nomo-risk at 1-, 3-, and 5-year risks were presented in Figure 5E. ROC curves of the nomogram as well as four clinical factors (age, gender, grade and stage) for 1-year risk were shown in Figure 5F. The range of AUC values of Nomo-risk was 0.796-0.872, which suggested that our nomogram achieves a good degree of accuracy for KIRC prognosis. Additionally, survival analysis based on the risk score of the nomogram showed that high Nomo-risk is related with poor prognosis (Figure 5G, P < 0.001).
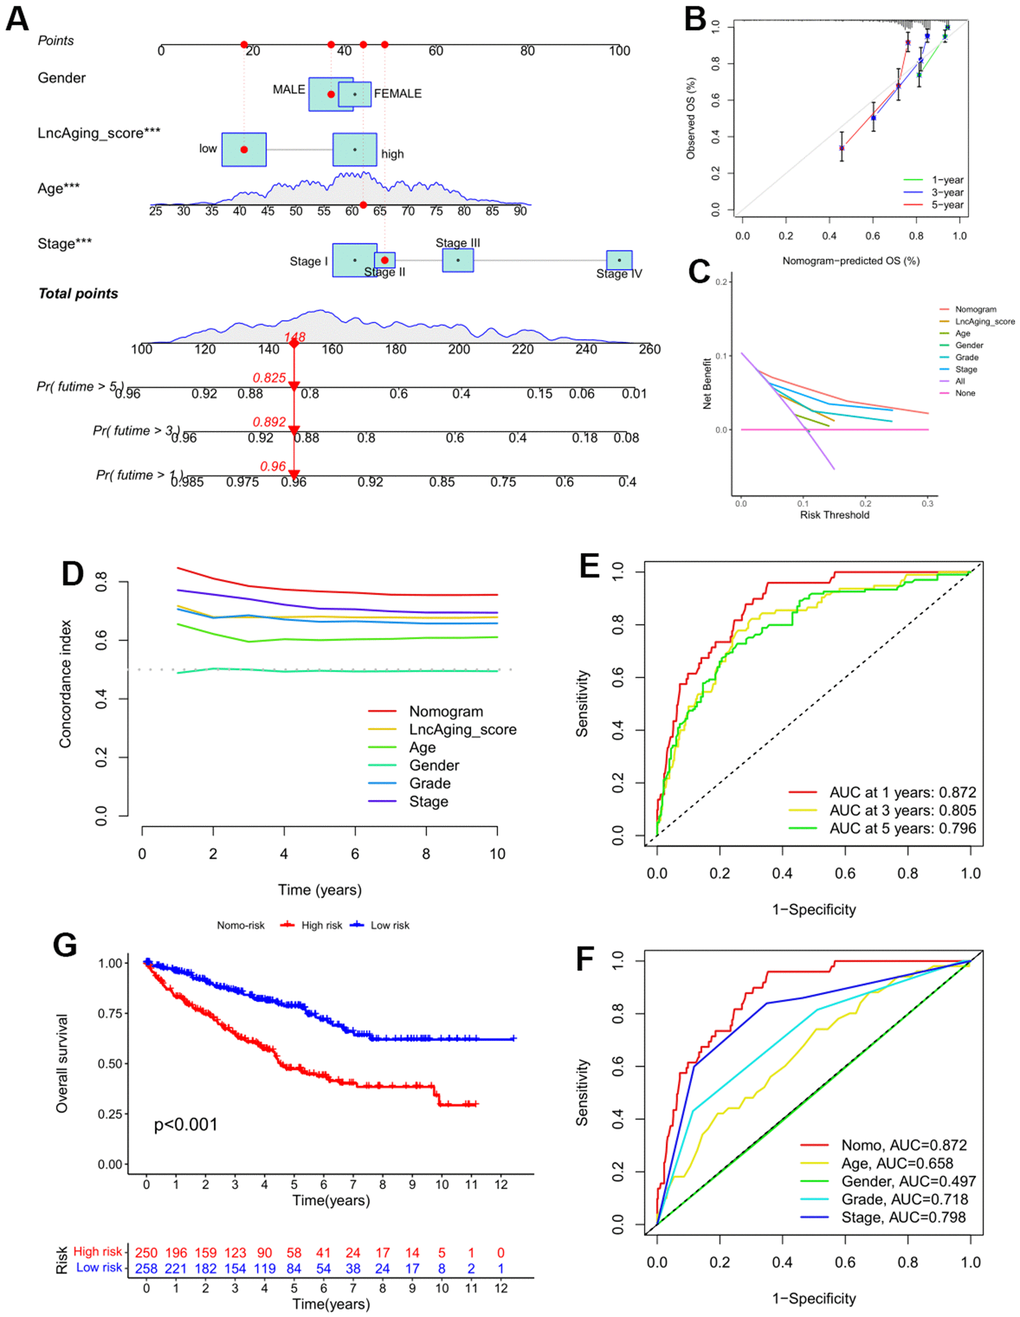
Figure 5. A nomogram was constructed for validating the prognostic model in the entire KIRC cohort. (A) The 1-, 3-, and 5-year OS in KIRC patients of the entire cohort was predicted by Nomogram; (B) Calibration curve of the nomogram and actual OS; Comparisons of DCA curve (C) and C-index (D) among the nomogram, LncAging_score model and 5 clinical variables for 1−year OS prediction; (E) ROC curves of the Nomo-risk at 1-, 3-, and 5-year; (F) ROC curves of Nomogram and 4 clinical variables for 1-year risk prediction; (G) KM survival analysis for KIRC patients with high- or low-Nomo-risk.
THBS1-IT1 displayed abnormal expression in multiple cancer types
Our previous study has implicated that overexpression of THBS1-IT1 affects endoplasmic reticulum (ER) stress signaling and decreases p53 express [8]. Considering ER stress and p53 are broadly involved in the ontogeny and progression of pan-cancer, we hypothesized that THBS1-IT1 may associate with the tumorigenesis of multiple cancers other than KIRC. Gene expression data of THBS1-IT1 in 31 normal tissues and 33 types of tumor tissues were separately acquired from GTEx and TCGA databases, it showed THBS1-IT1 is a widely expressed lncRNA gene in the majority of normal tissues (n=31) and all the tumor types (Figure 6A). Breast invasive carcinoma (BRCA), pancreatic adenocarcinoma (PAAD) and KIRC ranked the top three tumor types that expressed highest THBS1-IT1 (Figure 6B). Comparing with normal controls, THBS1-IT1 showed significant different expression in BRCA, cervical squamous cell carcinoma and endocervical adenocarcinoma (CESC), head and neck squamous cell carcinoma (HNSC), KIRC, kidney chromophobe (KICH), kidney renal papillary cell carcinoma (KIRP), lung squamous cell carcinoma (LUSC), lung adenocarcinoma (LUAD), stomach adenocarcinoma (STAD), rectum adenocarcinoma (READ), thymoma (THYM) and uterine corpus endometrial carcinoma (UCEC) (Figure 6C, P<0.05).
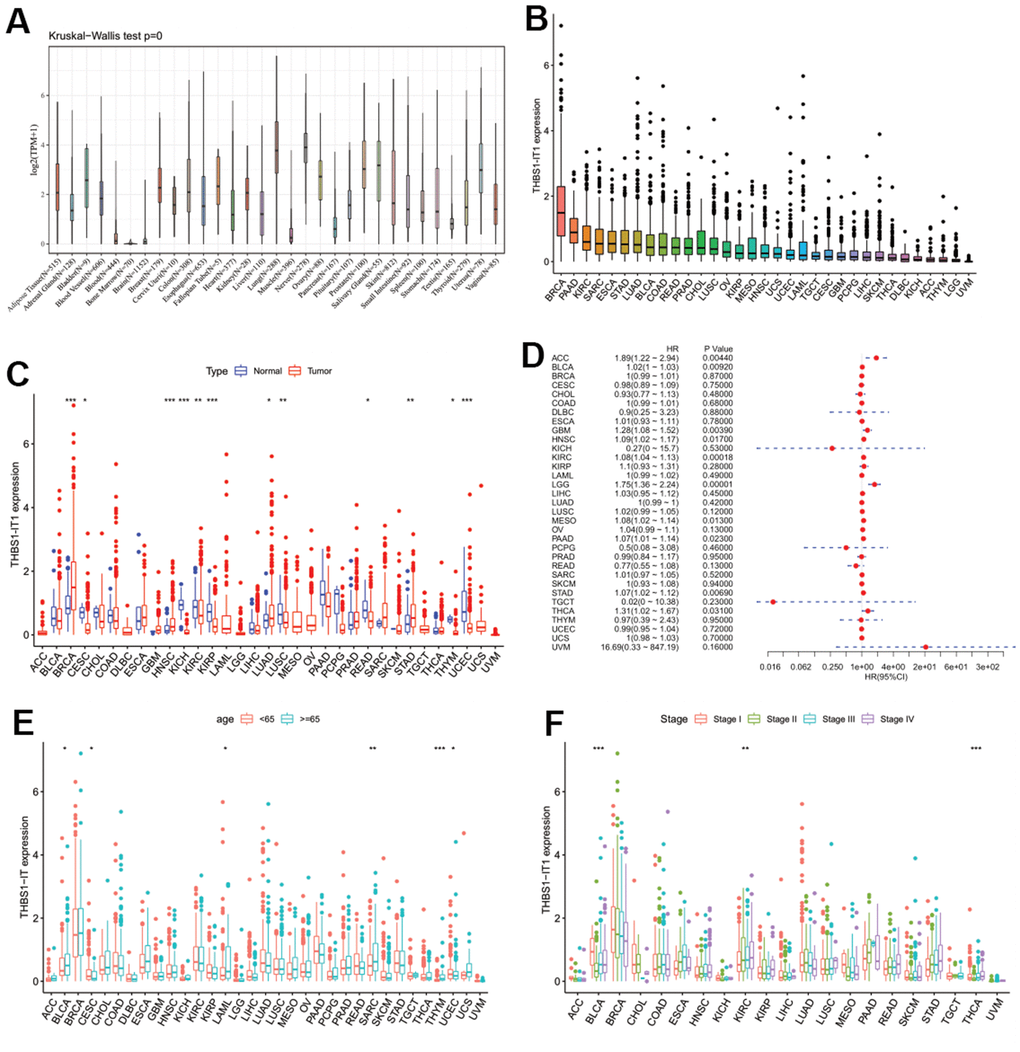
Figure 6. Pan-cancer analysis of THBS1-IT1. (A) Distribution of THBS1-IT1 expression in normal tissues; (B) THBS1-IT1 expression in 33 cancers; (C) Comparisons of THBS1-IT1 expression between tumor and normal samples suggested it was dysregulated in 12 cancer types; (D) The association between THBS1-IT1 expression and OS in 33 types of tumors by forest plot; (E) Correlation between THBS1-IT1 gene expression and age; (F) The relevance of tumor stage and THBS1-IT1 expression. *P < 0.05, **P < 0.01, ***P < 0.001.
Evaluation of the predictive potential of THBS1-IT1 in pan-cancer prognosis
To evaluate the effects of THBS1-IT1 expression level on tumor prognosis, a series of survival association analyses using four indicators including overall survival (OS), disease-specific survival (DSS), disease-free interval (DFI) and progression-free interval (PFI) were performed in each cancer type by Cox proportional hazards model (Cox) and KM survival analysis. Cox-OS analysis showed that THBS1-IT1 expression levels were associated with OS in adrenocortical carcinoma (ACC), bladder urothelial carcinoma (BLCA), glioblastoma multiforme (GBM), KIRC, brain lower grade glioma (LGG), mesothelioma (MESO), PAAD, STAD and THCA (Figure 6D, P < 0.05), and its high expression is a risk factor in these tumor types (HR>1). KM-OS analysis showed that among the patients of ACC, BLCA, GBM, HNSC, KIRC, LGG, MESO, PAAD, STAD and thyroid carcinoma (THCA), those who expressed higher levels of THBS1-IT1 had shorter survival time; in addiction, it also demonstrated a negative correlation was observed between THBS1-IT1 expression level and outcome in ACC, BLCA, GBM, HNSC, KIRC, LGG and PAAD (Supplementary Figure 7 log-rank test P < 0.05). Cox-DSS data revealed that low THBS1-IT1 expression had relative better prognosis in patients of ACC, BLCA, GBM, HNSC, KIRC, LGG, ovarian serous cystadenocarcinoma (OV), PAAD and STAD (Supplementary Figure 8, HR > 1, P < 0.05). KM-DSS displayed a correlation between THBS1-IT1 and poor prognosis in ACC, BLCA, GBM, HNSC, KIRC LGG and PAAD patients (Supplementary Figure 9, log-rank test P<0.05). Both Cox and KM survival analysis showed that high expression of THBS1-IT1 in LUAD, LUSC and sarcoma (SARC) was associated with shorter DFI (Supplementary Figures 10, 11). Forest plots showed upper expression of THBS1-IT1 was associated with poor PFI in BLCA, GBM, HNSC, KIRC, LGG, LUAD, LUSC, PAAD, SARC and uveal melanoma (UVM) (Supplementary Figure 12). The same result was also found in GBM, LGG, HNSC, KIRC, LUSC, PAAD, LUAD and UVM patients by KM analysis (Supplementary Figure 13). Taken together, these survival analyses lead to a consistent conclusion that high expression of THBS1-IT1 in tumors is related with poor outcome.
Correlation of THBS1-IT1 expression with clinical phenotypes in pan-cancer
As THBS1-IT1 is an aging-related lncRNA, we further investigated the association between age and THBS1-IT1 expression levels in pan-cancer. We found that elder patients (≥ 65 years) of BLCA, CESC, LAML, SARC, and THYM expressed higher THBS1-IT1 than patients of < 65 years; on the contrary, elder UCEC patients expressed lower levels (Figure 6E). The relevance of tumor stage and THBS1-IT1 expression was explored and we found that THBS1-IT1 was significantly correlated with tumor stage in 13 types of cancer such as BLCA, KIRC and THCA (Figure 6F).
Relationship between THBS1-IT1 expression and the tumor microenvironment and tumor immune cell infiltration
Tumor immune microenvironment (TME) and tumor immune cell infiltration (TICI) are closely related to clinical outcome, they played as critical roles in tumor occurrence, tumor progression and cancer therapeutic response [34–36]. To further test the prognostic potential of THBS1-IT1 in pan-cancer, the ESTIMATE algorithm [31] was used to calculate the stromal and immune cell scores in 33 types of cancer. It showed that THBS1-IT1 was positively correlated with immune scores (r > 0.5, P < 0.001) in esophageal carcinoma (ESCA), KICH and pheochromocytoma and paraganglioma (PCPG) (Supplementary Figure 14). THBS1-IT1 also exhibited strong connection with stromal scores in BLCA, KICH, ESCA, LUSC, READ, PAAD, MESO, OV, PCPG and STAD by pan-cancer analysis (r > 0.5, P < 0.001) (Supplementary Figure 15). In addition, THBS1-IT1 is related with the infiltration of 6 immune cell types including B cells, Macrophages, CD4+ T cells, CD8+ T cells, Neutrophils and Dendritic cells in ESCA, liver hepatocellular carcinoma (LIHC) and LUSC (r > 0.3, P < 0.001) (Supplementary Figure 16). In the majority of the 33 tumor types, degree of macrophage infiltration was correlated with THBS1-IT1 (r > 0.4, P < 0.001).
Correlations of THBS1-IT1 expression levels with tumor mutation burden and tumor microsatellite instability
Increasing evidence has implicated that tumor mutation burden (TMB) and tumor microsatellite instability (MSI) are potential markers associated with the efficacy of immunotherapy and/or chemotherapy and thus involving with tumor survival [37, 38]. To investigate the correlations between THBS1-IT1 expression levels and TMB/MSI, Spearman’s rank correlation coefficient analysis was applied. Our results demonstrated that THBS1-IT1 is related with TMB in 7 types of tumors including BLCA, BRCA, GBM, LIHC, LUSC, STAD and THYM (Supplementary Figure 17, P<0.05). In ESCA, HNSC, PRAD, STAD and THCA, THBS1-IT1 was related to MSI (Supplementary Figure 18, P<0.05).
Discussion
Over the past decades, great efforts have been made to propel a better understanding of the driving forces that lead to aging and cancer [39]. To discipline the vital and complex links between aging, cellular senescence and cancer, the prognostic power of 8 candidate aging related lncRNAs (CarLncs) in KIRC were evaluated. Among these CarLncs, THBS1-IT1, LEF1-AS1-201 and WDR11-DT-201 showed significant variations between KIRC and tumor-adjacent tissues in TCGA data while THBS1-AS1 and DCHS1-AS1 displayed non-significant changes. DCHS1-AS1 is sequence conserved and transcribed from the antisense of dachsous cadherin-related (DCHS1) [8]. Although the function of these dysregulated lncRNAs in KIRC remains to be explored, our results summarized a broad overview of their expression patterns in KIRC, which provided new insights into aging, cancer and lncRNA studies. Comparing with previous model that utilized m6A-Related lncRNA as signatures [14], we estimated the predictive power of 8 aging related lncRNAs in KIRC prognosis via a series of analyses, which enhanced the understanding of the associations between aging and cancers.
THBS1-IT1 and THBS1-AS1 are two lncRNAs that separately transcribed from the intronic and antisense regions of protein coding gene Thrombospondin 1 (THBS1). THBS1 is a matricellular protein that has been shown to accelerate the production and modulation of relative oxidative stress (ROS) in vasoreactivity and in the peripheral circulation, making it an aging marker that contributes to the aging progress [40]. In addition, increasing studies suggest that THBS1 is a prognostic biomarker of cancers and/or plays complex roles in various cancer types, such as glioblastoma [41, 42], papillary thyroid cancer [43], gastric cancer [44, 45], esophageal squamous cell carcinoma [46], and acute myeloid leukemia [47]. It is well documented that many lncRNAs can in cis control the expression of their nearby genes [48]. Previous study found that THBS1-IT1 and THBS1-AS1 are anti-aging lncRNAs and their expression was strongly correlated with the nearest gene THBS1, negatively or positively, suggesting they may be involved in the regulation of THBS1 expression [8]. The faceted functions of THBS1 in both aging and cancers as well as the regulation between THBS1-IT1 and ER-stress/p53 signaling, we hypothesized THBS1-IT1 may act as prognostic biomarkers in not only KIRC but also in a pan-cancer manner. We surprisingly found that THBS1-IT1 was dysregulated in 12 tumors and its high expression is associated with poor prognosis in multiple tumors, which suggests THBS1-IT1 may act as a predominant factor involved in both aging and cancer regulatory empires although the deeper mechanisms remain to be explored.
Conclusions
In this study, we seek for providing new connections between aging and cancers from the perspective of lncRNAs. An integrated regulatory network of CarLncs, miRNAs and mRNAs was constructed. Five aging-related signature genes within the network were identified by analyses such as SVM and RF, and they were utilized for developing the aging related model of KIRC. The robustness and efficiency of our model was evaluated by Nomogram, which suggested that LncAging_scores is a powerful predictive model for KIRC prognosis. Our next-step pan-cancer analysis found that one of the signature genes, THBS1-IT1, is a potential prognostic biomarker for multiple cancers. A series of survival analysis consistently refers to a strong correlation between its high expression and poor outcome.
Supplementary Materials
Author Contributions
J.J. conceived and designed this study; Y.T. Y.W. and G.W. performed data collection, analyses and figure plotting; J.J. and Y.T. wrote and revised the manuscript.
Acknowledgments
We acknowledge the generous supports from Mr. Ri-Ming He, Prof. Shu-Dong Yang and Prof. Zi-Cheng Zhang in The Fourth Clinical Medical College of Guangzhou University of Chinese Medicine, Shenzhen, China.
Conflicts of Interest
The authors declare there is no commercial and/or financial conflicts of interest for this study.
Funding
This work was financially supported by Shenzhen Science and Technology Program (Grant No. RCBS20210706092341003) to J.J., and Research Start-up Fund to J.J. awarded from Shenzhen High Level Hospital Construction Fund.
References
- 1. Titorenko VI. Molecular and Cellular Mechanisms of Aging and Age-related Disorders. Int J Mol Sci. 2018; 19:2049. https://doi.org/10.3390/ijms19072049 [PubMed]
- 2. The importance of aging in cancer research. Nat Aging. 2022; 2:365–6. https://doi.org/10.1038/s43587-022-00231-x [PubMed]
- 3. Fan X, Zhang B, He Y, Zhou X, Zhang Y, Ma L, Li X, Wu J. Burden of Disease Due to Cancer - China, 2000-2019. China CDC Wkly. 2022; 4:306–11. https://doi.org/10.46234/ccdcw2022.036 [PubMed]
- 4. Capitanio U, Bensalah K, Bex A, Boorjian SA, Bray F, Coleman J, Gore JL, Sun M, Wood C, Russo P. Epidemiology of Renal Cell Carcinoma. Eur Urol. 2019; 75:74–84. https://doi.org/10.1016/j.eururo.2018.08.036 [PubMed]
- 5. Jiang JJ, Cheng LH, Wu H, He YH, Kong QP. Insights into long noncoding RNAs of naked mole rat (Heterocephalus glaber) and their potential association with cancer resistance. Epigenetics Chromatin. 2016; 9:51. https://doi.org/10.1186/s13072-016-0101-5 [PubMed]
- 6. Jiang JJ, Kong QP. Comparative analysis of long noncoding RNAs in long-lived mammals provides insights into natural cancer-resistance. RNA Biol. 2020; 17:1657–65. https://doi.org/10.1080/15476286.2020.1792116 [PubMed]
- 7. Peinado P. Chapter 6 - Long Noncoding RNAs as Cancer Biomarkers, in Cancer and Noncoding RNAs, D.J.Chakrabarti and D.S.Mitra, Editors. Academic Press: Boston. 2018; 95–114.
- 8. Jiang J, Cheng L, Yan L, Ge M, Yang L, Ying H, Kong Q. Decoding the role of long noncoding RNAs in the healthy aging of centenarians. Brief Bioinform. 2021; 22:bbaa439. https://doi.org/10.1093/bib/bbaa439 [PubMed]
- 9. Zhou J, Tian G, Quan Y, Kong Q, Huang F, Li J, Wu W, Tang Y, Zhou Z, Liu X. The long noncoding RNA THBS1-AS1 promotes cardiac fibroblast activation in cardiac fibrosis by regulating TGFBR1. JCI Insight. 2023; 8:e160745. https://doi.org/10.1172/jci.insight.160745 [PubMed]
- 10. He Y, Jiang Z, Chen C, Wang X. Classification of triple-negative breast cancers based on Immunogenomic profiling. J Exp Clin Cancer Res. 2018; 37:327. https://doi.org/10.1186/s13046-018-1002-1 [PubMed]
- 11. Seiler M, Huang CC, Szalma S, Bhanot G. ConsensusCluster: a software tool for unsupervised cluster discovery in numerical data. OMICS. 2010; 14:109–13. https://doi.org/10.1089/omi.2009.0083 [PubMed]
- 12. Hänzelmann S, Castelo R, Guinney J. GSVA: gene set variation analysis for microarray and RNA-seq data. BMC Bioinformatics. 2013; 14:7. https://doi.org/10.1186/1471-2105-14-7 [PubMed]
- 13. Huang J, Jiang S, Liang L, He H, Liu Y, Cong L, Jiang Y. Analysis of PANoptosis-Related LncRNA-miRNA-mRNA Network Reveals LncRNA SNHG7 Involved in Chemo-Resistance in Colon Adenocarcinoma. Front Oncol. 2022; 12:888105. https://doi.org/10.3389/fonc.2022.888105 [PubMed]
- 14. Yu J, Mao W, Sun S, Hu Q, Wang C, Xu Z, Liu R, Chen S, Xu B, Chen M. Identification of an m6A-Related lncRNA Signature for Predicting the Prognosis in Patients With Kidney Renal Clear Cell Carcinoma. Front Oncol. 2021; 11:663263. https://doi.org/10.3389/fonc.2021.663263 [PubMed]
- 15. Paraskevopoulou MD, Vlachos IS, Karagkouni D, Georgakilas G, Kanellos I, Vergoulis T, Zagganas K, Tsanakas P, Floros E, Dalamagas T, Hatzigeorgiou AG. DIANA-LncBase v2: indexing microRNA targets on non-coding transcripts. Nucleic Acids Res. 2016; 44:D231–8. https://doi.org/10.1093/nar/gkv1270 [PubMed]
- 16. Chen Y, Wang X. miRDB: an online database for prediction of functional microRNA targets. Nucleic Acids Res. 2020; 48:D127–31. https://doi.org/10.1093/nar/gkz757 [PubMed]
- 17. Huang HY, Lin YC, Li J, Huang KY, Shrestha S, Hong HC, Tang Y, Chen YG, Jin CN, Yu Y, Xu JT, Li YM, Cai XX, et al. miRTarBase 2020: updates to the experimentally validated microRNA-target interaction database. Nucleic Acids Res. 2020; 48:D148–54. https://doi.org/10.1093/nar/gkz896 [PubMed]
- 18. Slack FJ, Chinnaiyan AM. The Role of Non-coding RNAs in Oncology. Cell. 2019; 179:1033–55. https://doi.org/10.1016/j.cell.2019.10.017 [PubMed]
- 19. Shannon P, Markiel A, Ozier O, Baliga NS, Wang JT, Ramage D, Amin N, Schwikowski B, Ideker T. Cytoscape: a software environment for integrated models of biomolecular interaction networks. Genome Res. 2003; 13:2498–504. https://doi.org/10.1101/gr.1239303 [PubMed]
- 20. Ashburner M, Ball CA, Blake JA, Botstein D, Butler H, Cherry JM, Davis AP, Dolinski K, Dwight SS, Eppig JT, Harris MA, Hill DP, Issel-Tarver L, et al. Gene ontology: tool for the unification of biology. The Gene Ontology Consortium. Nat Genet. 2000; 25:25–9. https://doi.org/10.1038/75556 [PubMed]
- 21. Ogata H, Goto S, Sato K, Fujibuchi W, Bono H, Kanehisa M. KEGG: Kyoto Encyclopedia of Genes and Genomes. Nucleic Acids Res. 1999; 27:29–34. https://doi.org/10.1093/nar/27.1.29 [PubMed]
- 22. Yu G, Wang LG, Han Y, He QY. clusterProfiler: an R package for comparing biological themes among gene clusters. OMICS. 2012; 16:284–7. https://doi.org/10.1089/omi.2011.0118 [PubMed]
- 23. Wang Q, Liu X. Screening of feature genes in distinguishing different types of breast cancer using support vector machine. Onco Targets Ther. 2015; 8:2311–7. https://doi.org/10.2147/OTT.S85271 [PubMed]
- 24. Lu X, Yang Y, Wu F, Gao M, Xu Y, Zhang Y, Yao Y, Du X, Li C, Wu L, Zhong X, Zhou Y, Fan N, et al. Discriminative analysis of schizophrenia using support vector machine and recursive feature elimination on structural MRI images. Medicine (Baltimore). 2016; 95:e3973. https://doi.org/10.1097/MD.0000000000003973 [PubMed]
- 25. Liu Z, Mi M, Li X, Zheng X, Wu G, Zhang L. A lncRNA prognostic signature associated with immune infiltration and tumour mutation burden in breast cancer. J Cell Mol Med. 2020; 24:12444–56. https://doi.org/10.1111/jcmm.15762 [PubMed]
- 26. Li Y, Qi D, Zhu B, Ye X. Analysis of m6A RNA Methylation-Related Genes in Liver Hepatocellular Carcinoma and Their Correlation with Survival. Int J Mol Sci. 2021; 22:1474. https://doi.org/10.3390/ijms22031474 [PubMed]
- 27. Zhang JA, Zhou XY, Huang D, Luan C, Gu H, Ju M, Chen K. Development of an Immune-Related Gene Signature for Prognosis in Melanoma. Front Oncol. 2021; 10:602555. https://doi.org/10.3389/fonc.2020.602555 [PubMed]
- 28. Wang S, Su W, Zhong C, Yang T, Chen W, Chen G, Liu Z, Wu K, Zhong W, Li B, Mao X, Lu J. An Eight-CircRNA Assessment Model for Predicting Biochemical Recurrence in Prostate Cancer. Front Cell Dev Biol. 2020; 8:599494. https://doi.org/10.3389/fcell.2020.599494 [PubMed]
- 29. Zhou XY, Dai HY, Zhang H, Zhu JL, Hu H. Ferroptosis-Related lncRNA for the Establishment of Novel Prognostic Signature and Therapeutic Response Prediction to Endometrial Carcinoma. Biomed Res Int. 2022; 2022:2056913. https://doi.org/10.1155/2022/2056913 [PubMed]
- 30. Cheng X, Wang X, Nie K, Cheng L, Zhang Z, Hu Y, Peng W. Systematic Pan-Cancer Analysis Identifies TREM2 as an Immunological and Prognostic Biomarker. Front Immunol. 2021; 12:646523. https://doi.org/10.3389/fimmu.2021.646523 [PubMed]
- 31. Yoshihara K, Shahmoradgoli M, Martínez E, Vegesna R, Kim H, Torres-Garcia W, Treviño V, Shen H, Laird PW, Levine DA, Carter SL, Getz G, Stemke-Hale K, et al. Inferring tumour purity and stromal and immune cell admixture from expression data. Nat Commun. 2013; 4:2612. https://doi.org/10.1038/ncomms3612 [PubMed]
- 32. Ni J, Liu S, Qi F, Li X, Yu S, Feng J, Zheng Y. Screening TCGA database for prognostic genes in lower grade glioma microenvironment. Ann Transl Med. 2020; 8:209. https://doi.org/10.21037/atm.2020.01.73 [PubMed]
- 33. Li T, Fan J, Wang B, Traugh N, Chen Q, Liu JS, Li B, Liu XS. TIMER: A Web Server for Comprehensive Analysis of Tumor-Infiltrating Immune Cells. Cancer Res. 2017; 77:e108–10. https://doi.org/10.1158/0008-5472.CAN-17-0307 [PubMed]
- 34. Wu T, Dai Y. Tumor microenvironment and therapeutic response. Cancer Lett. 2017; 387:61–8. https://doi.org/10.1016/j.canlet.2016.01.043 [PubMed]
- 35. Lei X, Lei Y, Li JK, Du WX, Li RG, Yang J, Li J, Li F, Tan HB. Immune cells within the tumor microenvironment: Biological functions and roles in cancer immunotherapy. Cancer Lett. 2020; 470:126–33. https://doi.org/10.1016/j.canlet.2019.11.009 [PubMed]
- 36. Zhang SC, Hu ZQ, Long JH, Zhu GM, Wang Y, Jia Y, Zhou J, Ouyang Y, Zeng Z. Clinical Implications of Tumor-Infiltrating Immune Cells in Breast Cancer. J Cancer. 2019; 10:6175–84. https://doi.org/10.7150/jca.35901 [PubMed]
- 37. Valero C, Lee M, Hoen D, Wang J, Nadeem Z, Patel N, Postow MA, Shoushtari AN, Plitas G, Balachandran VP, Smith JJ, Crago AM, Long Roche KC, et al. The association between tumor mutational burden and prognosis is dependent on treatment context. Nat Genet. 2021; 53:11–5. https://doi.org/10.1038/s41588-020-00752-4 [PubMed]
- 38. Li K, Luo H, Huang L, Luo H, Zhu X. Microsatellite instability: a review of what the oncologist should know. Cancer Cell Int. 2020; 20:16. https://doi.org/10.1186/s12935-019-1091-8 [PubMed]
- 39. Falandry C, Bonnefoy M, Freyer G, Gilson E. Biology of cancer and aging: a complex association with cellular senescence. J Clin Oncol. 2014; 32:2604–10. https://doi.org/10.1200/JCO.2014.55.1432 [PubMed]
- 40. LeBlanc AJ, Kelm NQ. Thrombospondin-1, Free Radicals, and the Coronary Microcirculation: The Aging Conundrum. Antioxid Redox Signal. 2017; 27:785–801. https://doi.org/10.1089/ars.2017.7292 [PubMed]
- 41. Qi C, Lei L, Hu J, Wang G, Liu J, Ou S. Thrombospondin-1 is a prognostic biomarker and is correlated with tumor immune microenvironment in glioblastoma. Oncol Lett. 2021; 21:22. https://doi.org/10.3892/ol.2020.12283 [PubMed]
- 42. Daubon T, Léon C, Clarke K, Andrique L, Salabert L, Darbo E, Pineau R, Guérit S, Maitre M, Dedieu S, Jeanne A, Bailly S, Feige JJ, et al. Deciphering the complex role of thrombospondin-1 in glioblastoma development. Nat Commun. 2019; 10:1146. https://doi.org/10.1038/s41467-019-08480-y [PubMed]
- 43. Jin A, Zhou J, Yu P, Zhou S, Chang C. High Expression of THBS1 Leads to a Poor Prognosis in Papillary Thyroid Cancer and Suppresses the Anti-Tumor Immune Microenvironment. Technol Cancer Res Treat. 2022; 21:15330338221085360. https://doi.org/10.1177/15330338221085360 [PubMed]
- 44. Zhang X, Huang T, Li Y, Qiu H. Upregulation of THBS1 is Related to Immunity and Chemotherapy Resistance in Gastric Cancer. Int J Gen Med. 2021; 14:4945–57. https://doi.org/10.2147/IJGM.S329208 [PubMed]
- 45. Hu XY, Ling ZN, Hong LL, Yu QM, Li P, Ling ZQ. Circulating methylated THBS1 DNAs as a novel marker for predicting peritoneal dissemination in gastric cancer. J Clin Lab Anal. 2021; 35:e23936. https://doi.org/10.1002/jcla.23936 [PubMed]
- 46. Zhou ZQ, Cao WH, Xie JJ, Lin J, Shen ZY, Zhang QY, Shen JH, Xu LY, Li EM. Expression and prognostic significance of THBS1, Cyr61 and CTGF in esophageal squamous cell carcinoma. BMC Cancer. 2009; 9:291. https://doi.org/10.1186/1471-2407-9-291 [PubMed]
- 47. Zhu L, Li Q, Wang X, Liao J, Zhang W, Gao L, Liu Y, Zhang C, Zhang X, Rao J, Kong P. THBS1 Is a Novel Serum Prognostic Factors of Acute Myeloid Leukemia. Front Oncol. 2020; 9:1567. https://doi.org/10.3389/fonc.2019.01567 [PubMed]
- 48. Statello L, Guo CJ, Chen LL, Huarte M. Gene regulation by long non-coding RNAs and its biological functions. Nat Rev Mol Cell Biol. 2021; 22:96–118. https://doi.org/10.1038/s41580-020-00315-9 [PubMed]