


Introduction
Hypertensive disorders in pregnancy (HDP), defined as elevated blood pressure that occurs for the first time during pregnancy, are serious complications that affect 4.1-19.4% of pregnant women globally [1]. After years of prevention and intervention, HDP remains the second leading cause of maternal and prenatal mortality [2]. Although various mechanisms including oxidative stress [3], chronic uterine placental ischemia [4], immune dysregulation [5], and vascular endothelial dysfunction [6] have been studied, the explicit pathogenesis of HDP has not been fully elucidated.
Gut microbiota (GM) has been observed to change significantly during gestation and is crucial for maintaining host physiology and homeostasis [7]. Mounting evidence demonstrated the gut microbiota dysbiosis in HDP patients. For example, Chen et al. reported that PE (pre-eclampsia) patients have a lower diversity of GM with some beneficial genera reduced such as Faecalibacterium and Akkermansia [8]. Another nested case-control study demonstrated the difference in GM composition in early pregnancy between HDP patients and healthy controls [9]. However, these findings had some limitations. Firstly, the environment of the human intestine is very complex and often affected by various factors, some covariates that cannot be measured may cause confounders. Secondly, most existing results came from observational studies, the timing of exposure and outcome remains unclear and it’s easy to cause reverse causal association. Furthermore, the previous studies are mainly focused on PE patients, ignoring other subtypes which have different pathogenesis and degree of organ damage. Therefore, it is crucial to explore the possible causal association between GM and HDP in specific subtypes after confounders and reverse causation well controlled.
Mendelian randomization (MR) is a useful method for causal inference using genetic variants (e.g. Single Nucleotide Polymorphisms, SNP) as instrumental variables (IVs) [10]. Because the alleles from parents to offspring are randomly assigned, freely combined and the genotypes remain stable after birth. MR is regarded as the “most natural” randomized controlled trial (RCT), and its advantages such as reducing confounding factors as well as excluding reverse causality provide an effective way for causal inference based on observational studies [11, 12]. Furthermore, the ability and accuracy of genetic variants detection in genome-wide association studies (GWAS) have been greatly improved, and the measurement error has been reduced compared to conventional research [13]. Many studies have used MR analysis to explore the correlation between GM and some complex human diseases [14–16]. Therefore, our study performed a bidirectional multivariable MR analysis using the GWAS summary statistics to detect the causal relationship between GM and different subtypes of HDP, which may provide novel insights to understand the mechanism of HDP.
Results
A total of 7,121 SNPs associated with 119 bacterial genera were included for GM instruments. The characters of selected IVs were shown in Supplementary Table 1.
Forward MR analyses
HDP
Results at a significant threshold of P < 0.05 by using the inverse-variance weighted (IVW) method were shown in Figure 1. We found a causal association of increase in RuminococcaceaeUCG009 (OR = 1.18, 95%CI: 1.03-1.34, P = 0.015) and higher risk of HDP, while genetically increased in Bifidobacterium (OR = 0.81, 95%CI: 0.68-0.97, P = 0.022), Eubacterium (ruminantium group) (OR = 0.81, 95%CI: 0.69-0.96, P = 0.012), Intestinibacter (OR = 0.83, 95%CI: 0.72-0.96, P = 0.011), Parabacteroides (OR = 0.75, 95%CI: 0.57-0.99, P = 0.047), RuminococcaceaeUCG002 (OR = 0.84, 95%CI: 0.74-0.96, P = 0.011), Senegalimassilia (OR = 0.80, 95%CI: 0.65-0.98, P = 0.033), and Tyzzerella3 (OR = 0.87, 95% CI: 0.77-0.99, P = 0.039) were associated with protective effects on HDP. These causal associations, however, lost their significance when multiple comparisons were adjusted (q > 0.1). The F-statistics ranged from 142.45 to 242.46 among all the results above, excluding the weak IVs bias. Details of all the IVW results were shown in Supplementary Table 2.
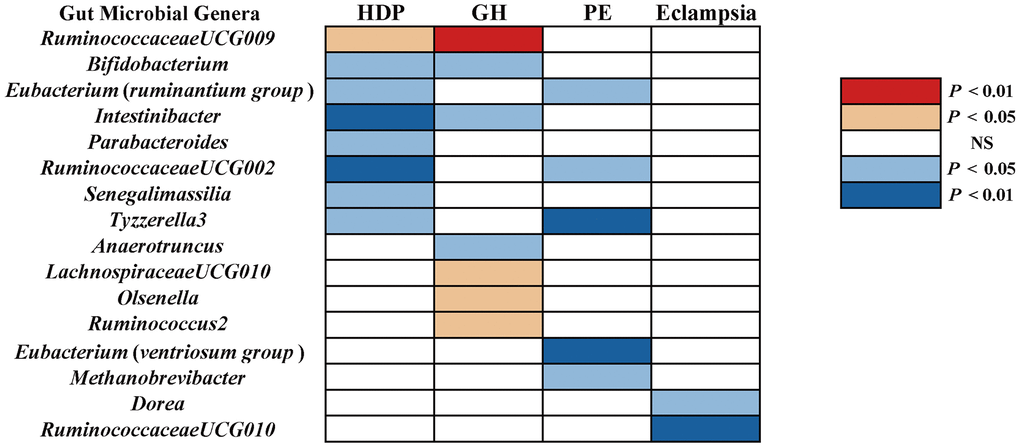
Figure 1. The causal effect of gut microbial genera on RDP (GR, PE, and Eclampsia) identified at the nominal significance by using the IVW method (P < 0.05 / 0.01). Red represents the risk factors for RDP, blue represents the protective factors for RDP, and white represents no causal association. RDP, hypertensive disorders in pregnancy; GR, gestational hypertension; PE, pre-eclampsia; NS, No significant association.
GH
Using the IVW method, we found suggestive causal associations of increases in LachnospiraceaeUCG010 (OR = 1.29, 95%CI: 1.00-1.66, P = 0.049), Olsenella (OR = 1.15, 95% CI: 1.02-1.31, P = 0.028), RuminococcaceaeUCG009 (OR = 1.27, 95%CI: 1.08-1.49, P = 0.005), and Ruminococcus2 (OR = 1.25, 95%CI: 1.03-1.51, P = 0.022) and higher risk of GH, while genetically increased in Anaerotruncus (OR = 0.74, 95%CI: 0.55-0.99, P = 0.047), Bifidobacterium (OR = 0.80, 95%CI: 0.65-0.98, P = 0.030), and Intestinibacter (OR = 0.80, 95%CI: 0.67-0.97, P = 0.023) were related to protective effects on GH (Figure 1). However, causal associations lost their significance when multiple comparisons were adjusted. Details of all the IVW results were shown in Supplementary Table 3. The F-statistics ranged from 144.51 to 205.87 among all the results above. Additionally, causal associations between GM and GH risk were found in more than three MR methods (Table 1 and Figure 2), including IVW, Maximum Likelihood (MaxLik), Weighted Median (WM), MR-Egger regression, and MR robust adjusted profile score (MR.RAPS).
Table 1. MR analyses of gut microbiota on HDP subtypes by different methods.
| Exposure | Outcome | F-Stat | Inverse variance weighted | Maximum likelihood | Weighted median | MR.RAPS | MR Egger | ||||||||||||||||||||||||||||||||||||||||||||||||||||||||||||||||||||||||||||||||||||||||||||
| OR (95%CI) | P | OR (95%CI) | P | OR (95%CI) | P | OR (95%CI) | P | OR (95%CI) | P | ||||||||||||||||||||||||||||||||||||||||||||||||||||||||||||||||||||||||||||||||||||||||||
| Anaerotruncus | GH | 166.34 | 0.74(0.55,0.99) | 0.047 | 0.74(0.58,0.95) | 0.019 | 0.86(0.61,1.23) | 0.410 | 0.68(0.54,0.86) | 0.001 | 0.54(0.23,1.31) | 0.203 | |||||||||||||||||||||||||||||||||||||||||||||||||||||||||||||||||||||||||||||||||||||||
| Bifidobacterium | GH | 139.63 | 0.80(0.65,0.98) | 0.030 | 0.80(0.66,0.97) | 0.026 | 0.88(0.65,1.19) | 0.401 | 0.79(0.66,0.95) | 0.014 | 0.53(0.32,0.86) | 0.027 | |||||||||||||||||||||||||||||||||||||||||||||||||||||||||||||||||||||||||||||||||||||||
| Intestinibacter | GH | 159.39 | 0.80 (0.67,0.97) | 0.023 | 0.81(0.66,0.98) | 0.027 | 0.76(0.59,0.97) | 0.028 | 0.80(0.66,0.98) | 0.031 | 0.62(0.34,1.14) | 0.150 | |||||||||||||||||||||||||||||||||||||||||||||||||||||||||||||||||||||||||||||||||||||||
| Lachnospiraceae UCG010 | GH | 144.51 | 1.29(1.00,1.66) | 0.049 | 1.31(1.01,1.69) | 0.046 | 1.28(0.90,1.83) | 0.168 | 1.18(0.92,1.50) | 0.188 | 1.15(0.53,2.51) | 0.731 | |||||||||||||||||||||||||||||||||||||||||||||||||||||||||||||||||||||||||||||||||||||||
| Olsenella | GH | 205.87 | 1.15(1.02,1.31) | 0.028 | 1.16(1.02,1.32) | 0.028 | 1.20(1.01,1.42) | 0.035 | 1.16(1.01,1.32) | 0.038 | 1.05(0.70,1.58) | 0.810 | |||||||||||||||||||||||||||||||||||||||||||||||||||||||||||||||||||||||||||||||||||||||
| Ruminococcaceae UCG009 | GH | 177.26 | 1.27(1.08,1.49) | 0.005 | 1.28(1.08,1.52) | 0.005 | 1.22(0.97,1.54) | 0.085 | 1.20(1.03,1.41) | 0.023 | 1.70(0.88,3.29) | 0.143 | |||||||||||||||||||||||||||||||||||||||||||||||||||||||||||||||||||||||||||||||||||||||
| Ruminococcus2 | GH | 156.71 | 1.25(1.03,1.51) | 0.022 | 1.25(1.03,1.52) | 0.022 | 1.21(0.91,1.62) | 0.190 | 1.26(1.03,1.54) | 0.026 | 1.50(0.95,2.37) | 0.106 | |||||||||||||||||||||||||||||||||||||||||||||||||||||||||||||||||||||||||||||||||||||||
| Eubacterium (ruminantium group) | PE | 157.34 | 0.86(0.75,0.99) | 0.045 | 0.86(0.74,1.00) | 0.049 | 0.90(0.74,1.10) | 0.314 | 0.89(0.77,1.03) | 0.118 | 1.24(0.77,2.01) | 0.391 | |||||||||||||||||||||||||||||||||||||||||||||||||||||||||||||||||||||||||||||||||||||||
| Eubacterium (ventriosum group) | PE | 160.92 | 0.74(0.59,0.93) | 0.011 | 0.75(0.59,0.94) | 0.014 | 0.72(0.53,0.98) | 0.034 | 0.75(0.59,0.94) | 0.015 | 0.68(0.24,1.90) | 0.473 | |||||||||||||||||||||||||||||||||||||||||||||||||||||||||||||||||||||||||||||||||||||||
| Methanobrevibacter | PE | 179.04 | 0.79(0.65,0.96) | 0.019 | 0.79(0.65,0.96) | 0.020 | 0.80(0.63,1.02) | 0.070 | 0.79(0.66,0.95) | 0.014 | 0.55(0.26,1.13) | 0.180 | |||||||||||||||||||||||||||||||||||||||||||||||||||||||||||||||||||||||||||||||||||||||
| Ruminococcaceae UCG002 | PE | 166.26 | 0.80(0.65,0.98) | 0.029 | 0.80(0.66,0.97) | 0.021 | 0.80(0.61,1.05) | 0.105 | 0.85(0.71,1.02) | 0.075 | 0.90(0.52,1.55) | 0.702 | |||||||||||||||||||||||||||||||||||||||||||||||||||||||||||||||||||||||||||||||||||||||
| Tyzzerella3 | PE | 147.81 | 0.80(0.68,0.93) | 0.003 | 0.79(0.68,0.93) | 0.004 | 0.77(0.63,0.95) | 0.015 | 0.79(0.68,0.92) | 0.003 | 0.73(0.29,1.80) | 0.506 | |||||||||||||||||||||||||||||||||||||||||||||||||||||||||||||||||||||||||||||||||||||||
| Dorea | Eclampsia | 174.09 | 0.27(0.09,0.76) | 0.014 | 0.26(0.09,0.75) | 0.014 | 0.46(0.10,2.14) | 0.323 | 0.16(0.06,0.46) | 0.001 | 1.07(0.06,20.03) | 0.963 | |||||||||||||||||||||||||||||||||||||||||||||||||||||||||||||||||||||||||||||||||||||||
| Ruminococcaceae UCG010 | Eclampsia | 151.49 | 0.20(0.07,0.58) | 0.003 | 0.20(0.07,0.60) | 0.004 | 0.24(0.06,1.00) | 0.050 | 0.30(0.11,0.83) | 0.020 | 0.20(0.01,3.67) | 0.340 | |||||||||||||||||||||||||||||||||||||||||||||||||||||||||||||||||||||||||||||||||||||||
| GH, gestational hypertension; PE, pre-eclampsia; F-stat, F statistics to detect weak instrumental variable bias; MR.RAPS, Mendelian randomization robust adjusted profile score; OR, odds ratio; CI, confidence interval; P, P value. | |||||||||||||||||||||||||||||||||||||||||||||||||||||||||||||||||||||||||||||||||||||||||||||||||||
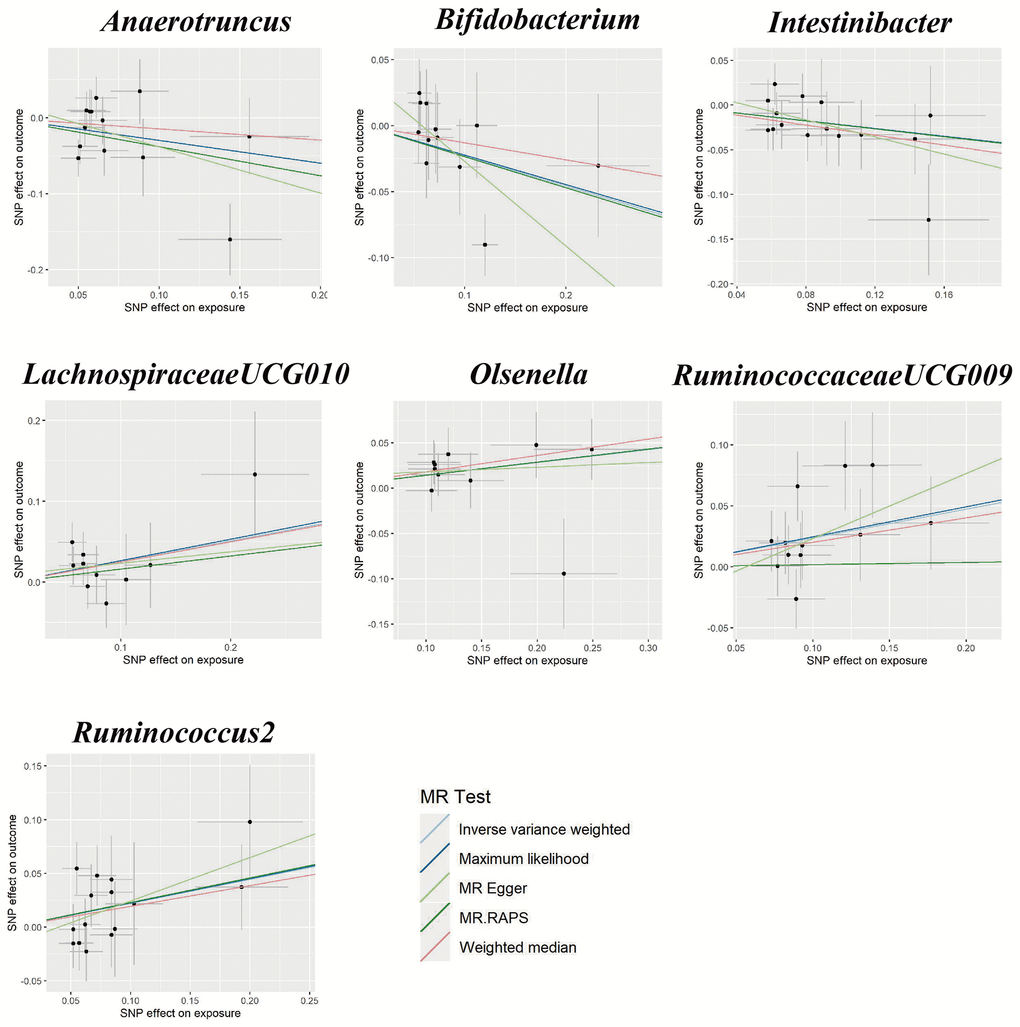
Figure 2. Scatter plots for the causal relationship between gut microbiota and gestational hypertension.
PE
We found five suggestive causal effects of GM on PE (P < 0.05, q > 0.1; Figure 1). Specifically, Eubacterium(ruminantium group) (OR = 0.86, 95%CI: 0.75-0.99, P = 0.045), Eubacterium(ventriosum group) (OR = 0.74, 95%CI: 0.59-0.93, P = 0.011), Methanobrevibacter (OR = 0.79, 95%CI: 0.65-0.96, P = 0.019), RuminococcaceaeUCG002 (OR = 0.80, 0.65-0.98, P = 0.029), and Tyzzerella3 (OR = 0.80, 95%CI: 0.68-0.93, P = 0.003) were negatively associated with the risk of PE. Details of all the IVW results were shown in Supplementary Table 4. The F-statistics ranged from 147.81 to 179.04 among all the results above. Furthermore, causal associations between GM and PE risk were found in more than three MR methods (Table 1 and Figure 3).
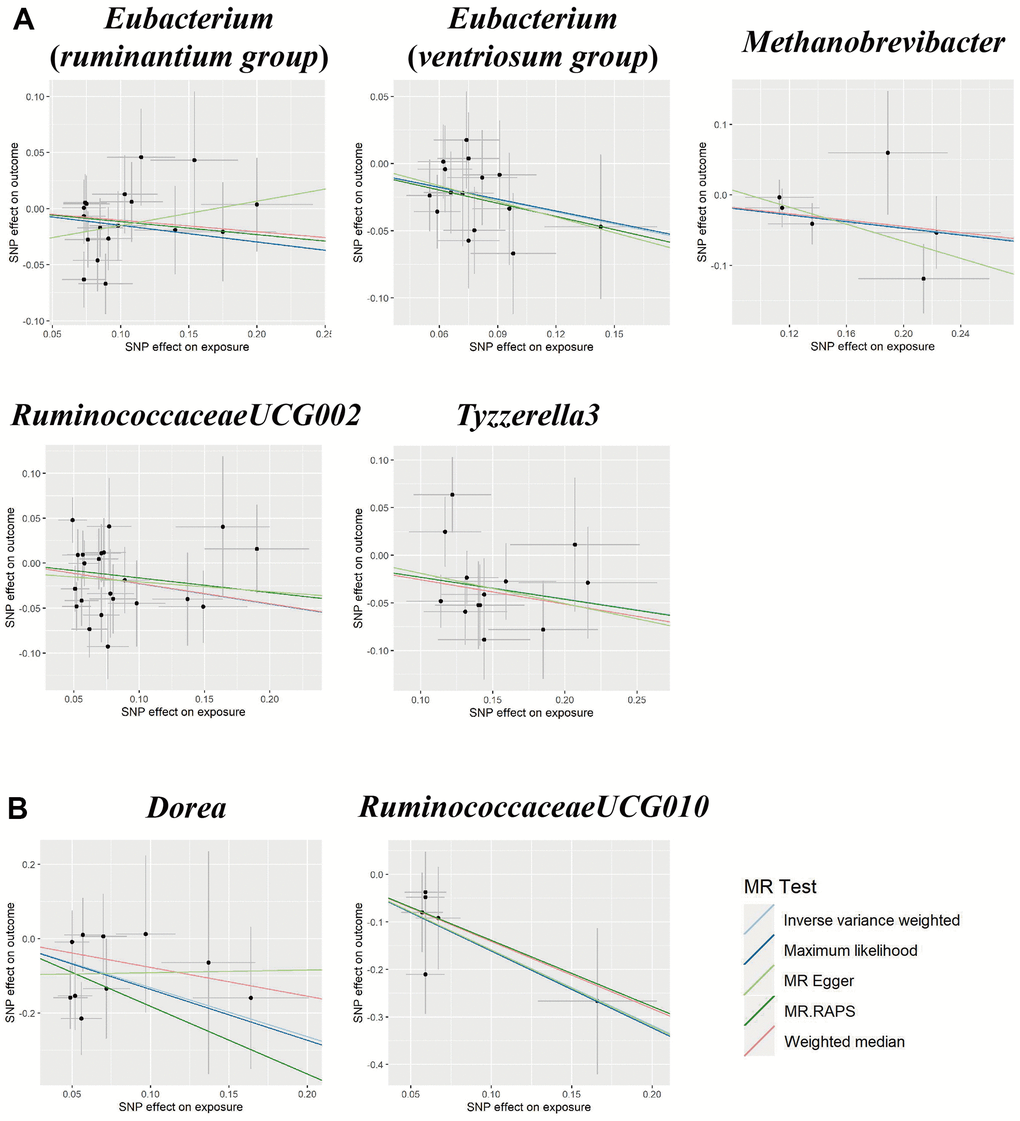
Figure 3. Scatter plots for the causal association between gut microbiota and (A) pre-eclampsia or (B) eclampsia.
Eclampsia
We found suggestive causal effects of GM on Eclampsia in two microbial genera, including Dorea (OR = 0.27, 95%CI: 0.09-0.76, P = 0.014) and RuminococcaceaeUCG010 (OR = 0.20, 95%CI: 0.07-0.58, P = 0.003), which were negatively associated with the risk of eclampsia (Figure 1). Details of all the IVW results were shown in Supplementary Table 5. The F-statistics were 174.09 and 151.49, respectively, Furthermore, causal associations between GM and eclampsia risk were found in more than two of the MR methods (Table 1 and Figure 3).
Sensitivity analyses
Cochran’s Q statistics showed no significant heterogeneity in selected IVs (P > 0.05 in IVW and MR-Egger methods, Supplementary Table 6). Both the MR-Egger intercept and the MR-PRESSO global test confirmed there is no significant directional horizontal pleiotropy (P > 0.05, Supplementary Table 6). Additionally, the leave-one-out analysis revealed that there are no outlier IVs that would have a significant impact on the result if retained (Supplementary Figures 1–3).
Reverse MR analyses
We performed the reverse MR analysis to assess whether specific HDP subtypes causally affect gut microbiota to confirm the causal direction. However, all methods showed no causal relationship except for the genus Bifidobacterium (P > 0.05, Supplementary Table 7). The sensitivity analyses including Cochran’s Q test, MR-Egger regression intercept, MR-PRESSO global test, and the leave-one-out sensitivity analysis confirmed the robustness of the reverse MR results (Supplementary Table 8 and Supplementary Figures 4–6).
Multivariable MR analyses
MVMR analysis was performed to assess the causal effect of GM on GH, PE, and eclampsia, respectively after confounding factors were adjusted (BMI, alcohol drinking, smoking, and T2D). For the genus Intestinibacter, after adjusting for BMI (OR = 0.77, 95%CI: 0.67-0.88, P < 0.001), alcohol drinking (OR = 0.76, 95%CI: 0.67-0.85, P < 0.001), smoking (OR = 0.84, 95%CI: 0.70-0.99, P = 0.049), and T2D (OR = 0.81, 95%CI: 0.72-0.92, P = 0.001), Intestinibacter remained causally associated with GH risk (Figure 4). Detailed MVMR results of other suggestive association GM on HDP subtypes were shown in Table 2.
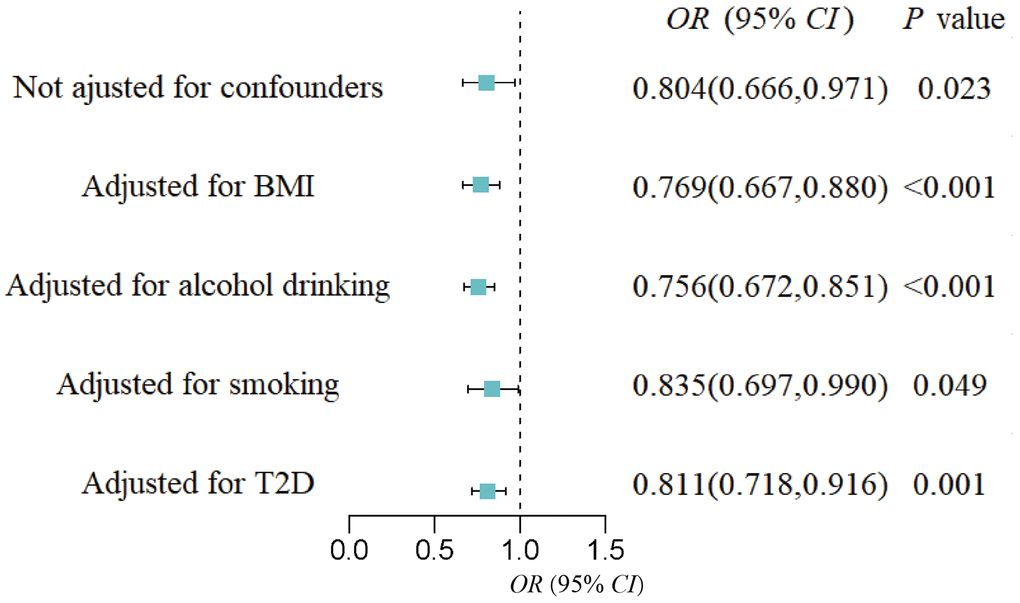
Figure 4. Forest plot of the causal effect of the genus Intestinibacter on gestational hypertension after adjusting for confounders.
Table 2. Multivariable MR analyses of gut microbiota on HDP subtypes after adjusting confounding factors.
| Exposure | Outcome | BMI | Alcohol drinking | Smoking | T2D | ||||||||||||||||||||||||||||||||||||||||||||||||||||||||||||||||||||||||||||||||||||||||||||||
| OR (95%CI) | P | OR (95%CI) | P | OR (95%CI) | P | OR (95%CI) | P | ||||||||||||||||||||||||||||||||||||||||||||||||||||||||||||||||||||||||||||||||||||||||||||
| Anaerotruncus | GH | 0.71(0.43,1.18) | 0.187 | 0.76(0.52,1.11) | 0.159 | 0.70(0.50,0.98) | 0.035 | 0.91(0.71,1.15) | 0.419 | ||||||||||||||||||||||||||||||||||||||||||||||||||||||||||||||||||||||||||||||||||||||||||
| Bifidobacterium | GH | 0.79(0.68,0.93) | 0.004 | 0.76(0.63,0.91) | 0.004 | 0.74(0.62,0.89) | 0.001 | 0.77(0.54,1.08) | 0.128 | ||||||||||||||||||||||||||||||||||||||||||||||||||||||||||||||||||||||||||||||||||||||||||
| Intestinibacter | GH | 0.77(0.67,0.88) | <0.001 | 0.76(0.67,0.85) | <0.001 | 0.84(0.70,0.99) | 0.049 | 0.81(0.72,0.92) | 0.001 | ||||||||||||||||||||||||||||||||||||||||||||||||||||||||||||||||||||||||||||||||||||||||||
| Lachnospiraceae UCG010 | GH | 1.59(1.21,2.08) | 0.001 | 1.15(0.84,1.56) | 0.388 | 1.33(1.10,1.59) | 0.003 | 1.13(1.06,1.19) | 0.025 | ||||||||||||||||||||||||||||||||||||||||||||||||||||||||||||||||||||||||||||||||||||||||||
| Olsenella | GH | 1.14(0.93,1.42) | 0.215 | 1.13(1.00,1.28) | 0.049 | 1.12(1.01,1.25) | 0.041 | 1.17(1.06,1.289) | 0.003 | ||||||||||||||||||||||||||||||||||||||||||||||||||||||||||||||||||||||||||||||||||||||||||
| Ruminococcaceae UCG009 | GH | 1.40(1.11,1.77) | 0.005 | 1.28(1.04,1.57) | 0.020 | 1.49(1.28,1.74) | <0.001 | 1.12(1.06,1.19) | <0.001 | ||||||||||||||||||||||||||||||||||||||||||||||||||||||||||||||||||||||||||||||||||||||||||
| Ruminococcus2 | GH | 1.25(1.04,1.51) | 0.021 | 1.18(0.94,1.47) | 0.154 | 1.29(1.09,1.54) | 0.004 | 1.24(0.84,1.84) | 0.285 | ||||||||||||||||||||||||||||||||||||||||||||||||||||||||||||||||||||||||||||||||||||||||||
| Eubacterium (ruminantium group) | PE | 0.85(0.71,1.02) | 0.082 | 0.89(0.77,1.03) | 0.119 | 0.87(0.74,1.02) | 0.085 | 0.81(0.65,1.02) | 0.070 | ||||||||||||||||||||||||||||||||||||||||||||||||||||||||||||||||||||||||||||||||||||||||||
| Eubacterium (ventriosum group) | PE | 0.79(0.64,0.98) | 0.026 | 0.73(0.63,0.85) | <0.001 | 0.76(0.63,0.93) | 0.006 | 0.82(0.71,0.95) | 0.007 | ||||||||||||||||||||||||||||||||||||||||||||||||||||||||||||||||||||||||||||||||||||||||||
| Methanobrevibacter | PE | 0.77(0.59,1.02) | 0.067 | 0.77(0.66,0.91) | 0.002 | 0.65(0.50,0.86) | 0.002 | 0.76(0.64,0.90) | 0.001 | ||||||||||||||||||||||||||||||||||||||||||||||||||||||||||||||||||||||||||||||||||||||||||
| RuminococcaceaeUCG002 | PE | 1.13(0.87,1.48) | 0.360 | 0.79(0.63,0.98) | 0.034 | 0.80(0.65,0.98) | 0.003 | 0.67(0.50,0.90) | 0.008 | ||||||||||||||||||||||||||||||||||||||||||||||||||||||||||||||||||||||||||||||||||||||||||
| Tyzzerella3 | PE | 0.76(0.69,0.83) | <0.001 | 0.88(0.76,1.02) | 0.089 | 0.76(0.65,0.90) | 0.001 | 0.87(0.21,1.20) | 0.394 | ||||||||||||||||||||||||||||||||||||||||||||||||||||||||||||||||||||||||||||||||||||||||||
| Dorea | Eclampsia | 0.53(0.25,1.14) | 0.106 | 0.30(0.12,0.72) | 0.007 | 0.29(0.11,0.74) | 0.010 | 0.22(0.06,0.82) | 0.024 | ||||||||||||||||||||||||||||||||||||||||||||||||||||||||||||||||||||||||||||||||||||||||||
| RuminococcaceaeUCG010 | Eclampsia | 0.01(0.00,0.01) | <0.001 | 0.31(0.09,1.03) | 0.057 | 0.40(0.17,0.90) | 0.027 | 20.61(1.71,247.96) | 0.017 | ||||||||||||||||||||||||||||||||||||||||||||||||||||||||||||||||||||||||||||||||||||||||||
| GH, gestational hypertension; PE, pre-eclampsia; F-stat, F statistics to detect weak instrumental variable bias; OR, odds ratio; CI, confidence interval; P, P value; BMI, body mass index; T2D, type 2 diabetes. | |||||||||||||||||||||||||||||||||||||||||||||||||||||||||||||||||||||||||||||||||||||||||||||||||||
Discussion
In this multivariable MR study, we detected causal associations between eight particular bacterial genera and the risk of HDP, then replicated the analyses in specific subtypes (GH, PE, and eclampsia). Specifically, we identified suggestive causal associations of LachnospiraceaeUCG010, Olsenella, RuminococcaceaeUCG009, Ruminococcus2, Anaerotruncus, Bifidobacterium, and Intestinibacter with GH, of Eubacterium (ruminantium group), Eubacterium (ventriosum group), Methanobrevibacter, RuminococcaceaeUCG002, and Tyzzerella3 with PE, as well as of Dorea and RuminococcaceaeUCG010 with eclampsia. For example, our MR analyses revealed a protective effect of Bifidobacterium on GH. A case-control study including 170 women in early pregnancy found that the relative abundance of Bifidobacterium significantly decreases in HDP patients compared with the control group [17], which was consistent with the previous studies on hypertension patients in Tangshan and Henan [18, 19]. It has been reported that Bifidobacterium can restore intestinal barrier function by stimulating the expression of Mucins 3 [20]. The Mice infection model also supported the role of Bifidobacterium in maintaining barrier permeability by reducing the concentration of Shiga toxin in enterohemorrhagic E. coli strains [21]. Furthermore, treatment with Bifidobacterium bifidum significantly lowered the rates of bacterial translocation [22], and stopped the entry of GM-derived lipopolysaccharide (LPS) into blood [23], thereby reducing placental inflammation and maintaining normal blood pressure. All the evidence above supported the protective role of Bifidobacterium on GH.
In addition, we also found the genus Intestinibacter to be associated with a lower risk of GH. There have been relatively few previous studies on Intestinibacter, but observational study and animal model have both reported the role of Intestinibacter in producing butyrate [24, 25], which is a short chain fatty acid (SCFA) metabolized by GM. Placental inflammation and angiogenic factors played the central role in affecting blood pressure in pregnancy, and macrophages are the key regulator [26]. In vivo and in vitro experiments found that butyrate significantly reduces the effects of LPS to promote macrophage 1 polarization and inhibit macrophage 2 polarization, thereby reducing blood pressure [27, 28]. Furthermore, Jin et al. reported that butyrate promotes the effect on macrophage autophagy by decreasing autophagy receptors like P62 level and elevating LC3-II/LC3-I ratio, thus alleviating PE symptoms in rats [29]. The higher abundance of butyrate has been reported to decrease the risk of insulin resistance and type 2 diabetes(T2D) [30] and T2D is positively associated with blood pressure, suggesting that the effect of Intestinibacter on GH may be biased by T2D. But our multivariable MR analysis demonstrated that after adjusting T2D, the protective effect remained, which excluding the influence of confounding factors. Meanwhile, Bifidobacterium [9], Eubacterium (ruminantium group) [31], Tyzzerella3 [32], and Dorea [33] have also been reported to produce SCFA with the function to effectively reduce blood pressure [34, 35], which consistent with our MR results that the increased abundance of those gut microbiota were related to the lower risk of HDP.
Interestingly, the HDP-associated gut microbial genera identified by our MR analyses varied in different subtypes. For example, we didn’t find the relationships between Bifidobacterium and other HDP subtypes except for GH, which was consistent with another MR analysis on the gut microbiota and adverse pregnancy outcomes [16], while Li et al. reported the opposite result [36]. It may, because of the different pathogenesis, biochemical index, and degree of organ damage in GH, PE, and eclampsia. Additionally, our study demonstrated that RuminococcaceaeUCG009 increases the risk of GH, while RuminococcaceaeUCG002 and RuminococcaceaeUCG010 were found to be protective factors to PE and eclampsia, respectively. Some genera of Ruminococcaceae are beneficial SCFA-producing bacteria that could not only power the intestinal epithelial cells [37] but also reduce proinflammatory cytokine by monocytes [38]. For example, in population-based studies, the abundance of genus RuminococcaceaeUCG002 was found to have beneficial implications for host glucose homeostasis and lipid metabolism [39, 40] as well as RuminococcaceaeUCG010 was found to be fewer in hypertension patients compared with health group [41]. However, RuminococcaceaeUCG009 was found to be positively correlated with the production of inflammatory factors and LPS in serum thus may cooperatively contribute to HDP, which supported our result [42]. Thus, our findings opened up new possibilities for understanding the differences in gut microbial genera mediating mechanisms in various subtypes of HDP. Considering the different effects of the same gut microbial genera (e.g., Ruminococcaceae) on human blood pressure, further RCTs at a more specific species level are needed to support this finding.
The present study has some strengths. It was the first multivariable MR analysis to explore the causal relationship between GM and HDP subtypes and find the difference of causal-related GM in GH, PE, and eclampsia. The findings would facilitate the targeted prevention and treatment of different subtypes. Secondly, our study was based on the largest GWAS summary datasets to date, along with bidirectional MR, multivariable MR analyses, and several sensitivity analyses, which indicates the robustness of our findings. Thirdly, confounding variables and reverse causation were less likely to have an impact on the causal inference by using the MR design.
Our analysis still has several limitations. Firstly, the significance threshold of exposure IVs was set at 1e-05 because of insufficient IVs under genome-wide significance. However, IVs with F-statistics < 10 were excluded to avoid the weak instrumental bias. Secondly, MR analyses could only conduct at the bacterial genus level rather than at a more specific species level because of limited 16S rRNA sequencing resolution. Thirdly, our research was unable to provide further mechanisms for the distinct gut microbiota taxa associated with GH, PE, and eclampsia which need subsequent functional studies to elucidate.
In conclusion, by performing bidirectional multivariable MR analyses on GWAS summary data, this study explored the causal relationship between GM and different subtypes of HDP. Our findings may offer a new strategy for prevention and treatment in different HDP subtypes by targeting the gut microbiota and provide novel insights to understand the mechanism of HDP.
Materials and Methods
Data sources
GWAS summary statistics for GM were obtained from the Microbiome Genome (MiBioGen) Consortium which consisted of 24 multiple ancestry cohorts including 18,340 participants [43]. After extracting DNA from fecal samples, data were generated by 16S rRNA gene sequencing in the Illumina platform. Setting SILVA as the reference, all the data were annotated to genus and higher levels to profile the microbial composition [44].
According to the pathogenesis, biochemical index, and degree of organ damage, HDP could be divided into five subtypes including gestational hypertension (GH), pre-eclampsia (PE), eclampsia and so on [45]. In this study, firstly we tested the whole HDP group and then primarily focused on GH, PE, and eclampsia patients because they are major or most serious HDP subtypes. GWAS summary statistics for HDP were extracted from the FinnGen Consortium and updated in 2023 [46]. Briefly, the study for HDP included 123,579 female subjects (7,686 cases and 115,893 controls) covering a total of 16,379,784 SNPs. The genetic association datasets consisted of 118,990 pregnant women (4,255 cases and 114,735 controls) with GH, 118,291 pregnant women (3,556 cases and 114,735 controls) with PE, and 115,025 pregnant women (290 cases and 114,735 controls) with eclampsia, respectively. Association analysis was conducted with sex, age, genotyping batch, and 10 principal components corrected as covariates. Detailed information on exposure and outcome GWAS datasets were summarized in Supplementary Table 9.
Instrumental variables
To satisfy the three key assumptions of MR analysis (Figure 5), five steps were applied to select the optimal IVs: 1) SNPs under a locus-wide significance threshold of P < 1e-05 were obtained as potential IVs related to exposure [14]. 2) PLINK clumping method (r2 < 0.001, clump window < 10,000 kb) was performed to ensure the IVs were independent [47]. 3) SNPs with minor allele frequency < 0.01 and palindromic SNPs were excluded. 4) The proxy SNPs (r2 > 0.8) were selected based on European population data in the 1000 Genome project after removing the SNPs closely related to the outcome phenotype (P < 5e-08) [48]. 5) SNPs with F-statistics < 10 were eliminated to avoid weak IV bias [49].
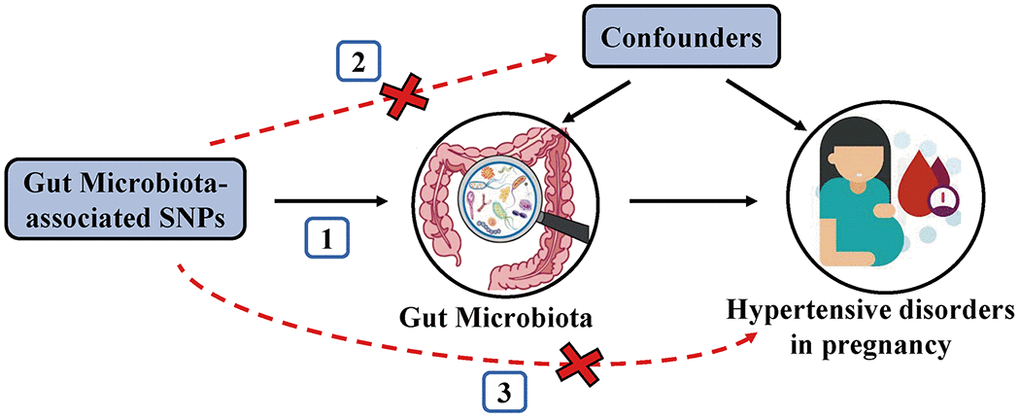
Figure 5. Schematic representation of the MR analysis. The three assumptions of MR are as follows: (1) Instrumental variables must be associated with gut microbiota, (2) Instrumental variables must not be associated with confounders; and (3) Instrumental variables must influence hypertensive disorders in pregnancy only through gut microbiota, not through other pathways.
Statistical analyses
We used the inverse-variance weighted (IVW) method as the primary MR analysis to detect the causal associations between exposure (GM) and outcomes (HDP, GH, PE, and eclampsia). The IVW method calculates the total causal effect by using the weighted linear regression model combined with the weight coefficient, under the condition that the intercept is zero [50]. IVW results were corrected for multiple comparisons applying the q-value procedure (q < 0.1), while P < 0.05 but q > 0.1 was considered to have a suggestive association [51].
Several MR methods including Maximum Likelihood (MaxLik), Weighted Median (WM), MR-Egger regression, and MR robust adjusted profile score (MR.RAPS) were also conducted to test the robustness of our study. MaxLik estimates the parameter values that have the greatest likelihood of leading to a particular outcome by using the known sample. Its standard error would be lower than IVW when heterogeneity and horizontal pleiotropy do not exist [52]. WM improves the power of causal effect detection based on the assumption that up to 50% of IVs are valid [53]. MR-Egger regression method could identify and correct pleiotropy, but the estimation accuracy will be very low unless using a larger sample size [54]. MR.RAPS applies robust estimates to correct for systematic and idiosyncratic pleiotropy, the results of which are unbiased even though weak IVs exist [55].
Cochran’s IVW Q statistics and leave-one-out analysis were used to identify potential heterogeneous IVs. MR-Egger intercept and MR Pleiotropy RESidual Sum and Outlier (MR-PRESSO) global test were conducted to test whether directional horizontal pleiotropy is driving the results of MR analyses [56, 57].
Reverse MR analysis was used to confirm the causal direction. The methods were similar to those of forward MR except for setting exposures as HDP subtypes and outcome as GM. Finally, we conducted multivariable MR (MVMR) analyses considering the possible confounders which may affect the outcome. The confounders including BMI (IEU number: ukb-b-19953), alcohol drinking (IEU number: ukb-b-5779), smoking (IEU number: ieu-b-4877), and T2D (IEU number: ebi-a-GCST006867).
The flowchart of this study was shown in Figure 6. All MR analyses were performed by the packages “TwoSampleMR”, “MRPRESSO”, and “qvalue” in R software.
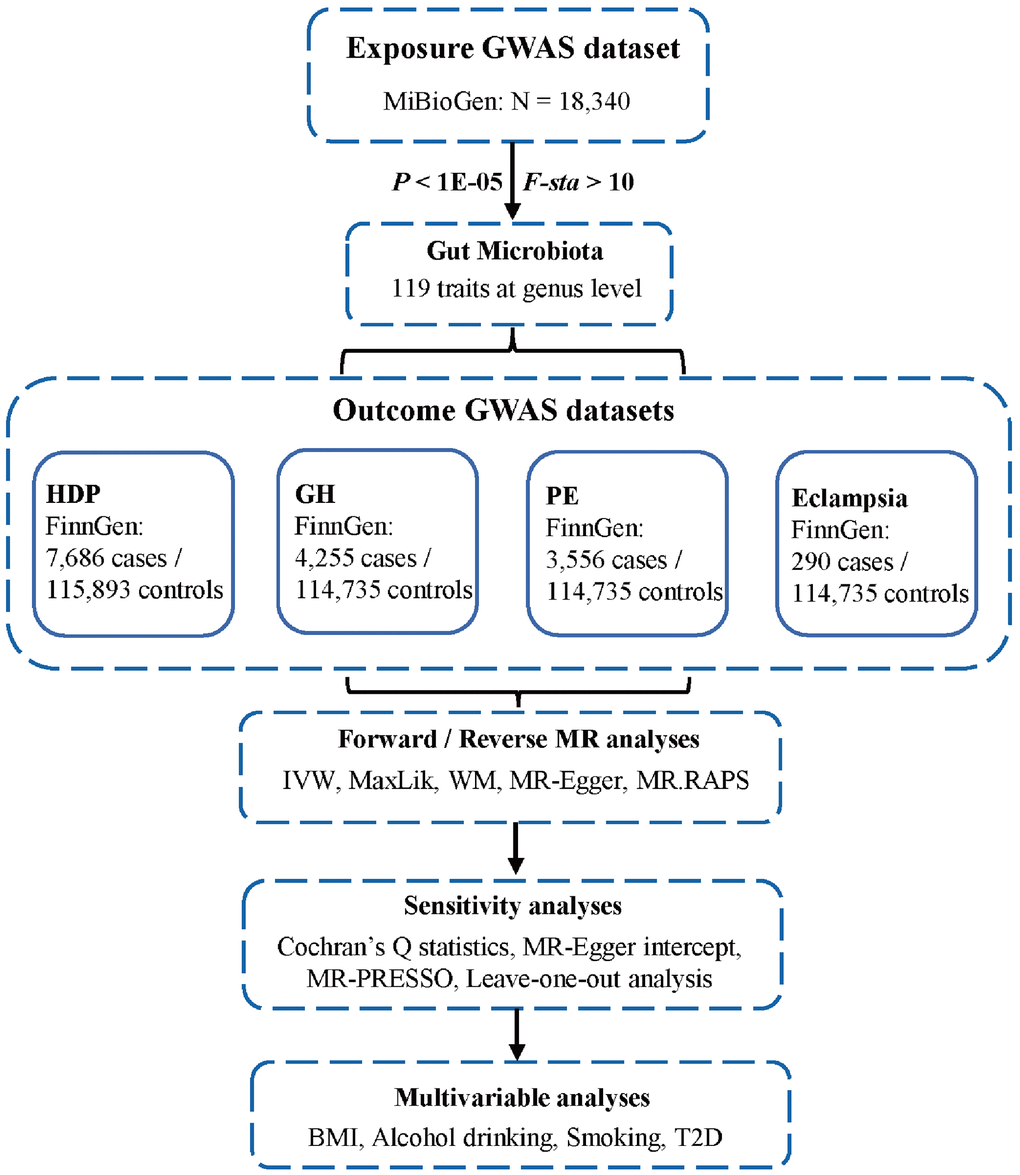
Figure 6. Flowchart of this study. GWAS, genome-wide association studies; HDP, hypertensive disorders in pregnancy; GH, gestational hypertension; PE, pre-eclampsia; MR, Mendelian randomization; IVW, inverse-variance weighted; MaxLik, maximum likelihood; WM, weighted median; MR.RAPS, MR robust adjusted profile score; MR-PRESSO, MR Pleiotropy RESidual Sum and Outlier; BMI, body mass index; T2D, type 2 diabetes.
Consent for publication
All the authors endorsed the publication of the manuscript.
Supplementary Materials
Author Contributions
XW conceived the study, obtained the data. XW and QL composed the article. QL and DL performed the statistical analysis. JC and HH prepared the figures and tables. HT conceived the study and reviewed the article. All authors approved the submitted version.
Conflicts of Interest
The authors declared there are no conflicts of interest exist.
Ethical Statement
No ethical statement is required because the study was based on GWAS publicly available data..
Funding
This work was supported by the National Natural Science Foundation of China (82360665), the Key Research and Development Program of Hunan Province (2018SK2061), the Natural Science Foundation of Hunan Province (2022JJ40343), the Scientific Research Project of Education Department of Hunan Province (21B0513), the Scientific Research Project of Hunan Provincial Health Commission (202212053368).
References
- 1. Umesawa M, Kobashi G. Epidemiology of hypertensive disorders in pregnancy: prevalence, risk factors, predictors and prognosis. Hypertens Res. 2017; 40:213–20. https://doi.org/10.1038/hr.2016.126 [PubMed]
- 2. Vogel JP, Souza JP, Mori R, Morisaki N, Lumbiganon P, Laopaiboon M, Ortiz-Panozo E, Hernandez B, Pérez-Cuevas R, Roy M, Mittal S, Cecatti JG, Tunçalp Ö, Gülmezoglu AM, and WHO Multicountry Survey on Maternal and Newborn Health Research Network. Maternal complications and perinatal mortality: findings of the World Health Organization Multicountry Survey on Maternal and Newborn Health. BJOG. 2014 (Suppl 1); 121:76–88. https://doi.org/10.1111/1471-0528.12633 [PubMed]
- 3. Grum T, Seifu A, Abay M, Angesom T, Tsegay L. Determinants of pre-eclampsia/Eclampsia among women attending delivery Services in Selected Public Hospitals of Addis Ababa, Ethiopia: a case control study. BMC Pregnancy Childbirth. 2017; 17:307. https://doi.org/10.1186/s12884-017-1507-1 [PubMed]
- 4. Dekker GA, Sibai BM. Etiology and pathogenesis of preeclampsia: current concepts. Am J Obstet Gynecol. 1998; 179:1359–75. https://doi.org/10.1016/s0002-9378(98)70160-7 [PubMed]
- 5. Saito S, Shiozaki A, Nakashima A, Sakai M, Sasaki Y. The role of the immune system in preeclampsia. Mol Aspects Med. 2007; 28:192–209. https://doi.org/10.1016/j.mam.2007.02.006 [PubMed]
- 6. Levine RJ, Lam C, Qian C, Yu KF, Maynard SE, Sachs BP, Sibai BM, Epstein FH, Romero R, Thadhani R, Karumanchi SA, and CPEP Study Group. Soluble endoglin and other circulating antiangiogenic factors in preeclampsia. N Engl J Med. 2006; 355:992–1005. https://doi.org/10.1056/NEJMoa055352 [PubMed]
- 7. Goltsman DSA, Sun CL, Proctor DM, DiGiulio DB, Robaczewska A, Thomas BC, Shaw GM, Stevenson DK, Holmes SP, Banfield JF, Relman DA. Metagenomic analysis with strain-level resolution reveals fine-scale variation in the human pregnancy microbiome. Genome Res. 2018; 28:1467–80. https://doi.org/10.1101/gr.236000.118 [PubMed]
- 8. Chen X, Li P, Liu M, Zheng H, He Y, Chen MX, Tang W, Yue X, Huang Y, Zhuang L, Wang Z, Zhong M, Ke G, et al. Gut dysbiosis induces the development of pre-eclampsia through bacterial translocation. Gut. 2020; 69:513–22. https://doi.org/10.1136/gutjnl-2019-319101 [PubMed]
- 9. González-Rodríguez I, Gaspar P, Sánchez B, Gueimonde M, Margolles A, Neves AR. Catabolism of glucose and lactose in Bifidobacterium animalis subsp. lactis, studied by 13C Nuclear Magnetic Resonance. Appl Environ Microbiol. 2013; 79:7628–38. https://doi.org/10.1128/AEM.02529-13 [PubMed]
- 10. Smith GD, Ebrahim S. ‘Mendelian randomization’: can genetic epidemiology contribute to understanding environmental determinants of disease? Int J Epidemiol. 2003; 32:1–22. https://doi.org/10.1093/ije/dyg070 [PubMed]
- 11. Lawlor DA, Harbord RM, Sterne JA, Timpson N, Davey Smith G. Mendelian randomization: using genes as instruments for making causal inferences in epidemiology. Stat Med. 2008; 27:1133–63. https://doi.org/10.1002/sim.3034 [PubMed]
- 12. Didelez V, Sheehan N. Mendelian randomization as an instrumental variable approach to causal inference. Stat Methods Med Res. 2007; 16:309–30. https://doi.org/10.1177/0962280206077743 [PubMed]
- 13. Evans DM, Davey Smith G. Mendelian Randomization: New Applications in the Coming Age of Hypothesis-Free Causality. Annu Rev Genomics Hum Genet. 2015; 16:327–50. https://doi.org/10.1146/annurev-genom-090314-050016 [PubMed]
- 14. Sanna S, van Zuydam NR, Mahajan A, Kurilshikov A, Vich Vila A, Võsa U, Mujagic Z, Masclee AAM, Jonkers DM, Oosting M, Joosten LAB, Netea MG, Franke L, et al. Causal relationships among the gut microbiome, short-chain fatty acids and metabolic diseases. Nat Genet. 2019; 51:600–5. https://doi.org/10.1038/s41588-019-0350-x [PubMed]
- 15. Jia J, Dou P, Gao M, Kong X, Li C, Liu Z, Huang T. Assessment of Causal Direction Between Gut Microbiota-Dependent Metabolites and Cardiometabolic Health: A Bidirectional Mendelian Randomization Analysis. Diabetes. 2019; 68:1747–55. https://doi.org/10.2337/db19-0153 [PubMed]
- 16. Li C, Liu C, Li N. Causal associations between gut microbiota and adverse pregnancy outcomes: A two-sample Mendelian randomization study. Front Microbiol. 2022; 13:1059281. https://doi.org/10.3389/fmicb.2022.1059281 [PubMed]
- 17. Yu J, Zhang B, Miao T, Hu H, Sun Y. Dietary Nutrition and Gut Microbiota Composition in Patients With Hypertensive Disorders of Pregnancy. Front Nutr. 2022; 9:862892. https://doi.org/10.3389/fnut.2022.862892 [PubMed]
- 18. Li J, Zhao F, Wang Y, Chen J, Tao J, Tian G, Wu S, Liu W, Cui Q, Geng B, Zhang W, Weldon R, Auguste K, et al. Gut microbiota dysbiosis contributes to the development of hypertension. Microbiome. 2017; 5:14. https://doi.org/10.1186/s40168-016-0222-x [PubMed]
- 19. Miao T, Yu Y, Sun J, Ma A, Yu J, Cui M, Yang L, Wang H. Decrease in abundance of bacteria of the genus Bifidobacterium in gut microbiota may be related to pre-eclampsia progression in women from East China. Food Nutr Res. 2021; 65. https://doi.org/10.29219/fnr.v65.5781 [PubMed]
- 20. Bron PA, Kleerebezem M, Brummer RJ, Cani PD, Mercenier A, MacDonald TT, Garcia-Ródenas CL, Wells JM. Can probiotics modulate human disease by impacting intestinal barrier function? Br J Nutr. 2017; 117:93–107. https://doi.org/10.1017/S0007114516004037 [PubMed]
- 21. Asahara T, Shimizu K, Nomoto K, Hamabata T, Ozawa A, Takeda Y. Probiotic bifidobacteria protect mice from lethal infection with Shiga toxin-producing Escherichia coli O157:H7. Infect Immun. 2004; 72:2240–7. https://doi.org/10.1128/IAI.72.4.2240-2247.2004 [PubMed]
- 22. Johansson ME, Jakobsson HE, Holmén-Larsson J, Schütte A, Ermund A, Rodríguez-Piñeiro AM, Arike L, Wising C, Svensson F, Bäckhed F, Hansson GC. Normalization of Host Intestinal Mucus Layers Requires Long-Term Microbial Colonization. Cell Host Microbe. 2015; 18:582–92. https://doi.org/10.1016/j.chom.2015.10.007 [PubMed]
- 23. Fan M, Li X, Gao X, Dong L, Xin G, Chen L, Qiu J, Xu Y. LPS Induces Preeclampsia-Like Phenotype in Rats and HTR8/SVneo Cells Dysfunction Through TLR4/p38 MAPK Pathway. Front Physiol. 2019; 10:1030. https://doi.org/10.3389/fphys.2019.01030 [PubMed]
- 24. Zhang L, Wang Z, Zhang X, Zhao L, Chu J, Li H, Sun W, Yang C, Wang H, Dai W, Yan S, Chen X, Xu D. Alterations of the Gut Microbiota in Patients with Diabetic Nephropathy. Microbiol Spectr. 2022; 10:e0032422. https://doi.org/10.1128/spectrum.00324-22 [PubMed]
- 25. Uddin MK, Mahmud MR, Hasan S, Peltoniemi O, Oliviero C. Dietary micro-fibrillated cellulose improves growth, reduces diarrhea, modulates gut microbiota, and increases butyrate production in post-weaning piglets. Sci Rep. 2023; 13:6194. https://doi.org/10.1038/s41598-023-33291-z [PubMed]
- 26. Jung E, Romero R, Yeo L, Gomez-Lopez N, Chaemsaithong P, Jaovisidha A, Gotsch F, Erez O. The etiology of preeclampsia. Am J Obstet Gynecol. 2022; 226:S844–66. https://doi.org/10.1016/j.ajog.2021.11.1356 [PubMed]
- 27. Ji J, Shu D, Zheng M, Wang J, Luo C, Wang Y, Guo F, Zou X, Lv X, Li Y, Liu T, Qu H. Microbial metabolite butyrate facilitates M2 macrophage polarization and function. Sci Rep. 2016; 6:24838. https://doi.org/10.1038/srep24838 [PubMed]
- 28. Jiang X, Huang X, Tong Y, Gao H. Butyrate improves cardiac function and sympathetic neural remodeling following myocardial infarction in rats. Can J Physiol Pharmacol. 2020; 98:391–9. https://doi.org/10.1139/cjpp-2019-0531 [PubMed]
- 29. Jin J, Gao L, Zou X, Zhang Y, Zheng Z, Zhang X, Li J, Tian Z, Wang X, Gu J, Zhang C, Wu T, Wang Z, Zhang Q. Gut Dysbiosis Promotes Preeclampsia by Regulating Macrophages and Trophoblasts. Circ Res. 2022; 131:492–506. https://doi.org/10.1161/CIRCRESAHA.122.320771 [PubMed]
- 30. Chen Z, Radjabzadeh D, Chen L, Kurilshikov A, Kavousi M, Ahmadizar F, Ikram MA, Uitterlinden AG, Zhernakova A, Fu J, Kraaij R, Voortman T. Association of Insulin Resistance and Type 2 Diabetes With Gut Microbial Diversity: A Microbiome-Wide Analysis From Population Studies. JAMA Netw Open. 2021; 4:e2118811. https://doi.org/10.1001/jamanetworkopen.2021.18811 [PubMed]
- 31. Barcenilla A, Pryde SE, Martin JC, Duncan SH, Stewart CS, Henderson C, Flint HJ. Phylogenetic relationships of butyrate-producing bacteria from the human gut. Appl Environ Microbiol. 2000; 66:1654–61. https://doi.org/10.1128/AEM.66.4.1654-1661.2000 [PubMed]
- 32. Püngel D, Treveil A, Dalby MJ, Caim S, Colquhoun IJ, Booth C, Ketskemety J, Korcsmaros T, van Sinderen D, Lawson MA, Hall LJ. Bifidobacterium breve UCC2003 Exopolysaccharide Modulates the Early Life Microbiota by Acting as a Potential Dietary Substrate. Nutrients. 2020; 12:948. https://doi.org/10.3390/nu12040948 [PubMed]
- 33. Xu HM, Xie SW, Liu TY, Zhou X, Feng ZZ, He X. Microbiota alteration of Chinese young male adults with high-status negative cognitive processing bias. Front Microbiol. 2023; 14:989162. https://doi.org/10.3389/fmicb.2023.989162 [PubMed]
- 34. Verhaar BJH, Collard D, Prodan A, Levels JHM, Zwinderman AH, Bäckhed F, Vogt L, Peters MJL, Muller M, Nieuwdorp M, van den Born BH. Associations between gut microbiota, faecal short-chain fatty acids, and blood pressure across ethnic groups: the HELIUS study. Eur Heart J. 2020; 41:4259–67. https://doi.org/10.1093/eurheartj/ehaa704 [PubMed]
- 35. Chen L, He FJ, Dong Y, Huang Y, Wang C, Harshfield GA, Zhu H. Modest Sodium Reduction Increases Circulating Short-Chain Fatty Acids in Untreated Hypertensives: A Randomized, Double-Blind, Placebo-Controlled Trial. Hypertension. 2020; 76:73–9. https://doi.org/10.1161/HYPERTENSIONAHA.120.14800 [PubMed]
- 36. Li P, Wang H, Guo L, Gou X, Chen G, Lin D, Fan D, Guo X, Liu Z. Association between gut microbiota and preeclampsia-eclampsia: a two-sample Mendelian randomization study. BMC Med. 2022; 20:443. https://doi.org/10.1186/s12916-022-02657-x [PubMed]
- 37. Morgan XC, Tickle TL, Sokol H, Gevers D, Devaney KL, Ward DV, Reyes JA, Shah SA, LeLeiko N, Snapper SB, Bousvaros A, Korzenik J, Sands BE, et al. Dysfunction of the intestinal microbiome in inflammatory bowel disease and treatment. Genome Biol. 2012; 13:R79. https://doi.org/10.1186/gb-2012-13-9-r79 [PubMed]
- 38. Nastasi C, Candela M, Bonefeld CM, Geisler C, Hansen M, Krejsgaard T, Biagi E, Andersen MH, Brigidi P, Ødum N, Litman T, Woetmann A. The effect of short-chain fatty acids on human monocyte-derived dendritic cells. Sci Rep. 2015; 5:16148. https://doi.org/10.1038/srep16148 [PubMed]
- 39. Eetemadi A, Tagkopoulos I. Methane and fatty acid metabolism pathways are predictive of Low-FODMAP diet efficacy for patients with irritable bowel syndrome. Clin Nutr. 2021; 40:4414–21. https://doi.org/10.1016/j.clnu.2020.12.041 [PubMed]
- 40. Lüll K, Arffman RK, Sola-Leyva A, Molina NM, Aasmets O, Herzig KH, Plaza-Díaz J, Franks S, Morin-Papunen L, Tapanainen JS, Salumets A, Altmäe S, Piltonen TT, Org E. The Gut Microbiome in Polycystic Ovary Syndrome and Its Association with Metabolic Traits. J Clin Endocrinol Metab. 2021; 106:858–71. https://doi.org/10.1210/clinem/dgaa848 [PubMed]
- 41. Calderón-Pérez L, Gosalbes MJ, Yuste S, Valls RM, Pedret A, Llauradó E, Jimenez-Hernandez N, Artacho A, Pla-Pagà L, Companys J, Ludwig I, Romero MP, Rubió L, Solà R. Gut metagenomic and short chain fatty acids signature in hypertension: a cross-sectional study. Sci Rep. 2020; 10:6436. https://doi.org/10.1038/s41598-020-63475-w [PubMed]
- 42. Sun Y, Wu D, Zeng W, Chen Y, Guo M, Lu B, Li H, Sun C, Yang L, Jiang X, Gao Q. The Role of Intestinal Dysbacteriosis Induced Arachidonic Acid Metabolism Disorder in Inflammaging in Atherosclerosis. Front Cell Infect Microbiol. 2021; 11:618265. https://doi.org/10.3389/fcimb.2021.618265 [PubMed]
- 43. Kurilshikov A, Medina-Gomez C, Bacigalupe R, Radjabzadeh D, Wang J, Demirkan A, Le Roy CI, Raygoza Garay JA, Finnicum CT, Liu X, Zhernakova DV, Bonder MJ, Hansen TH, et al. Large-scale association analyses identify host factors influencing human gut microbiome composition. Nat Genet. 2021; 53:156–65. https://doi.org/10.1038/s41588-020-00763-1 [PubMed]
- 44. Quast C, Pruesse E, Yilmaz P, Gerken J, Schweer T, Yarza P, Peplies J, Glöckner FO. The SILVA ribosomal RNA gene database project: improved data processing and web-based tools. Nucleic Acids Res. 2013; 41:D590–6. https://doi.org/10.1093/nar/gks1219 [PubMed]
- 45. Brown MA, Magee LA, Kenny LC, Karumanchi SA, McCarthy FP, Saito S, Hall DR, Warren CE, Adoyi G, Ishaku S, and International Society for the Study of Hypertension in Pregnancy (ISSHP). Hypertensive Disorders of Pregnancy: ISSHP Classification, Diagnosis, and Management Recommendations for International Practice. Hypertension. 2018; 72:24–43. https://doi.org/10.1161/HYPERTENSIONAHA.117.10803 [PubMed]
- 46. Kurki MI, Karjalainen J, Palta P, Sipilä TP, Kristiansson K, Donner K, Reeve MP, Laivuori H, Aavikko M, Kaunisto MA, Loukola A, Lahtela E, Mattsson H, et al. FinnGen: unique genetic insights from combining isolated population and national health register data. medRxiv. 2022.
- 47. Purcell S, Neale B, Todd-Brown K, Thomas L, Ferreira MA, Bender D, Maller J, Sklar P, de Bakker PI, Daly MJ, Sham PC. PLINK: a tool set for whole-genome association and population-based linkage analyses. Am J Hum Genet. 2007; 81:559–75. https://doi.org/10.1086/519795 [PubMed]
- 48. Johnson AD, Handsaker RE, Pulit SL, Nizzari MM, O’Donnell CJ, de Bakker PI. SNAP: a web-based tool for identification and annotation of proxy SNPs using HapMap. Bioinformatics. 2008; 24:2938–9. https://doi.org/10.1093/bioinformatics/btn564 [PubMed]
- 49. Burgess S, Thompson SG, and CRP CHD Genetics Collaboration. Avoiding bias from weak instruments in Mendelian randomization studies. Int J Epidemiol. 2011; 40:755–64. https://doi.org/10.1093/ije/dyr036 [PubMed]
- 50. Burgess S, Butterworth A, Thompson SG. Mendelian randomization analysis with multiple genetic variants using summarized data. Genet Epidemiol. 2013; 37:658–65. https://doi.org/10.1002/gepi.21758 [PubMed]
- 51. Storey JD, Tibshirani R. Statistical significance for genomewide studies. Proc Natl Acad Sci USA. 2003; 100:9440–5. https://doi.org/10.1073/pnas.1530509100 [PubMed]
- 52. Luque-Fernandez MA, Schomaker M, Rachet B, Schnitzer ME. Targeted maximum likelihood estimation for a binary treatment: A tutorial. Stat Med. 2018; 37:2530–46. https://doi.org/10.1002/sim.7628 [PubMed]
- 53. Bowden J, Davey Smith G, Haycock PC, Burgess S. Consistent Estimation in Mendelian Randomization with Some Invalid Instruments Using a Weighted Median Estimator. Genet Epidemiol. 2016; 40:304–14. https://doi.org/10.1002/gepi.21965 [PubMed]
- 54. Bowden J, Davey Smith G, Burgess S. Mendelian randomization with invalid instruments: effect estimation and bias detection through Egger regression. Int J Epidemiol. 2015; 44:512–25. https://doi.org/10.1093/ije/dyv080 [PubMed]
- 55. Zhao Q, Wang J, Hemani G, Bowden J, Small DS. Statistical inference in two-sample summary-data Mendelian randomization using robust adjusted profile score. The Annals of Statistics. 2020; 48.
- 56. Verbanck M, Chen CY, Neale B, Do R. Detection of widespread horizontal pleiotropy in causal relationships inferred from Mendelian randomization between complex traits and diseases. Nat Genet. 2018; 50:693–8. https://doi.org/10.1038/s41588-018-0099-7 [PubMed]
- 57. Rees JMB, Wood AM, Burgess S. Extending the MR-Egger method for multivariable Mendelian randomization to correct for both measured and unmeasured pleiotropy. Stat Med. 2017; 36:4705–18. https://doi.org/10.1002/sim.7492 [PubMed]