


Introduction
Lung adenocarcinoma (LUAD) is widely acknowledged as a common subtype of lung cancer [1, 2]. Current evidence suggests that the incidence of LUAD has increased in recent years. However, dismal survival rates have been reported for LUAD patients. Overwhelming evidence substantiates that some biomarkers can be used to predict the prognosis of LUAD patients. Interestingly, inhibiting or promoting the expression of these biomarkers could delay LUAD progression [3–5]. For instance, it has been shown that thyroid hormone receptor interactor 13 (TRIP13) is significantly expressed in LUAD tissues, negatively correlated with mortality in LUAD patients, and involved in activating the AKT/mTORC1/c-Myc signaling pathway to promote LUAD cell proliferation, migration and invasion [3]. Moreover, the expression levels of CAPN1, c-MET, and PIK3R2 are reportedly upregulated, while PTPN1 is downregulated in LUAD. CAPN1 could activate the c-Met/PIK3R2 pathway by promoting the degradation of PTPN1 protein to enhance the malignant behavior and erlotinib resistance of LUAD cells [5].
It has been shown that Gefitinib could inhibit the catalytic activity of epidermal growth factor receptor (EGFR), inhibiting tyrosine kinase-dependent tumor growth, cell cycle arrest, and angiogenesis. Gefitinib could compete with the ATP and EGFR tyrosine kinase domains for binding and inhibit receptor autophosphorylation and signaling transduction. An increasing body of evidence suggests that Gefitinib plays an important role against LUAD progression [6–9]. For instance, a study showed that among 121 patients with EGFR-mutant advanced LUAD, chemotherapy plus Gefitinib yielded significantly higher progression-free survival (PFS) and overall survival (OS) than chemotherapy or Gefitinib. The overall response rate (ORR) was significantly better in the chemotherapy plus Gefitinib groups than in the chemotherapy or Gefitinib groups. Chemotherapy combined with the Gefitinib therapy could provide a better survival benefit to patients with LUAD with sensitive EGFR mutation [6]. In EGFR TKI-sensitive cells PC-9, the expression of LPCAT1 was significantly increased in EGFR TKI-resistant cells PC-9R. Interestingly, the formation of the LPCAT1-EGFR positive feedback loop could regulate the EGFR/PI3K/AKT signaling pathway to promote Gefitinib resistance to LUAD [8]. Lysine demethylase 5A (KDM5A) is a histone demethylase that is upregulated in LUAD tissues and cells. It has been shown that interfering with KDM5A expression led to apoptosis, inhibited cell proliferation, and promoted the sensitivity of cancer cells to Gefitinib, accompanied by upregulation of BAX protein expression and downregulation of Bcl-2 protein expression in LUAD. Overexpression of KDM5A could promote the proliferation of LUAD cells, inhibit apoptosis, and promote the resistance of cancer cells to Gefitinib [9]. Although Gefitinib treatment could improve the prognosis and delay cell progression in LUAD, the roles of Gefitinib hub target genes in LUAD progression remain poorly understood. Therefore, the Gefitinib hub target molecules in the progression of LUAD were identified, and a risk model of Gefitinib target genes was constructed to predict the prognosis of LUAD patients using bioinformatics and cell experiments.
Results
Gefitinib could inhibit cell growth and migration in LUAD
After adding an appropriate concentration of Gefitinib, we found that with increased Gefitinib concentration, the proliferative ability of cells decreased during the CCK-8 assay (Figure 1A–1C), and the apoptosis rate significantly raised during flow cytometry (Figure 1D). In addition, Gefitinib significantly inhibited cell migration and invasion during wound healing and Transwell assays (Figure 1E, 1F).
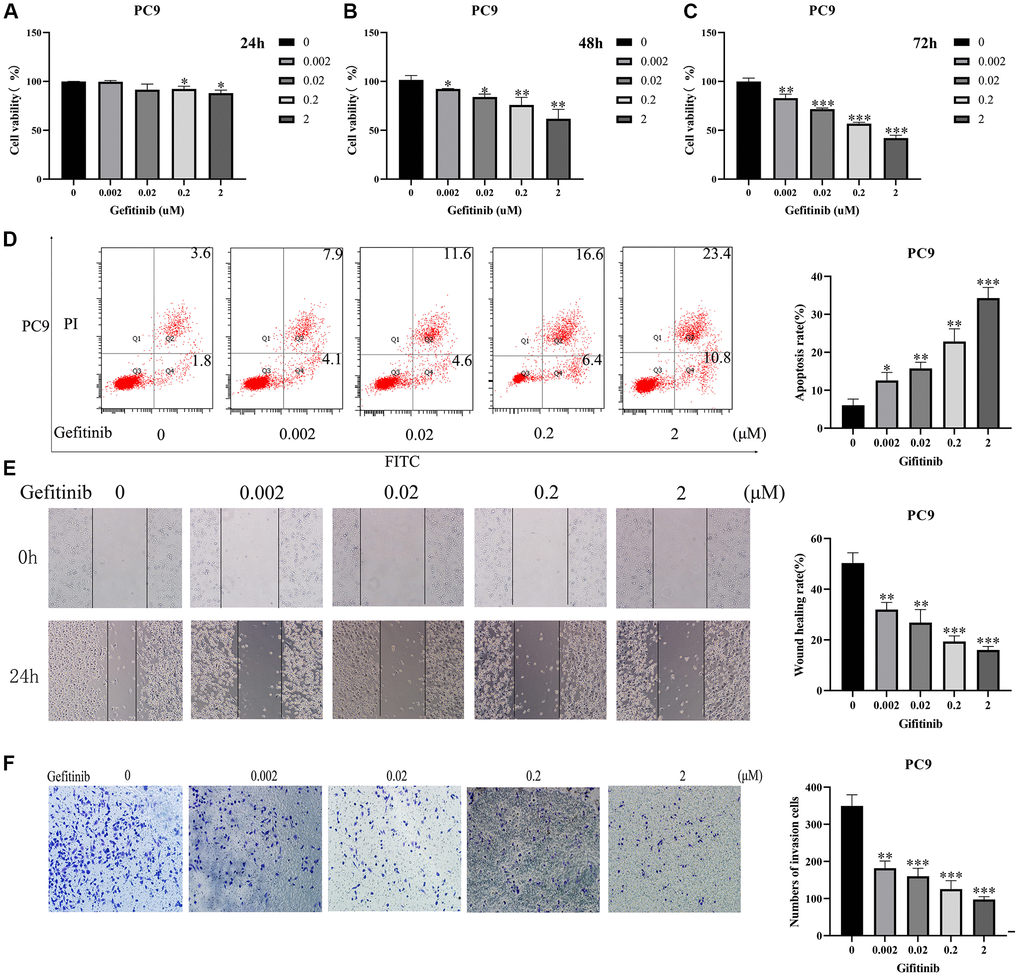
Figure 1. Gefitinib could inhibit cancer cell growth and migration. (A–C) Cell viability; (D) Cell apoptosis; (E) Cell Migration; (F) Cell Invasion.
The expression levels of Gefitinib target genes in LUAD
Gefitinib targets approximately 100 genes, primarily kinases (Table 1). Compared with normal lung tissues, 84 DEGs were identified in LUAD tissues (Table 2). The top 10 DEGs were visualized in a heatmap and histogram based on the fold change (Figure 2).
Table 1. Gefitinib target genes.
| Target genes | |||
| HIPK4 | IRAK4 | RIPK2 | FGFR1 |
| SBK1 | PRKD1 | ULK3 | FBP1 |
| PIP4K2C | LYN | EPHB1 | BRAF |
| ERBB2 | STK17B | IRAK3 | AURKA |
| ABL1 | STK10 | MAPK6 | FLT4 |
| KIT | EPHA5 | EPHB4 | LRRK2 |
| FLT3 | PHKG1 | DMPK | PDGFRB |
| EGFR | ABL2 | NLK | AURKB |
| RET | EPHA8 | ABCG2 | TEK |
| BLK | MAPK9 | PIM3 | CLK1 |
| PHKG2 | SLK | MINK1 | TGFBR1 |
| DAPK3 | MKNK2 | CIT | MAP2K1 |
| CHEK2 | FRK | LTK | JAK3 |
| LCK | STK36 | NUAK2 | DDR1 |
| MAPK10 | GAK | SIK2 | COQ8A |
| SRC | TXK | MAPK4 | INSR |
| MYLK2 | FGR | EPHA1 | TNNI3K |
| KDR | STK17A | EPHB6 | MAPK14 |
| CSNK1D | EPHA6 | ERBB3 | DYRK1A |
| ERBB4 | TNIK | MAP3K2 | PDGFRA |
| CDK7 | MKNK1 | MAP3K3 | HUNK |
| RPS6KA4 | AXL | DCLK3 | FYN |
| HCK | CSNK1E | MAP3K19 | YES1 |
| IRAK1 | MAP2K5 | FLT1 | RPS6KA1 |
| MET | EPHA3 | EPHA2 | CSK |
Table 2. 84 DEGs in LUAD tissues.
| Gene | logFC | P | Gene | logFC | P | ||||||||||||||||||||||||||||||||||||||||||||||||||||||||||||||||||||||||||||||||||||||||||||||
| SIK2 | −0.823022668 | 1.27E-19 | EPHA1 | 1.021486338 | 2.65E-14 | ||||||||||||||||||||||||||||||||||||||||||||||||||||||||||||||||||||||||||||||||||||||||||||||
| PRKD1 | −0.815043872 | 7.85E-16 | TXK | −0.199840205 | 6.13E-07 | ||||||||||||||||||||||||||||||||||||||||||||||||||||||||||||||||||||||||||||||||||||||||||||||
| MKNK2 | −0.437153109 | 4.11E-11 | EPHB4 | 0.424531032 | 0.000179901 | ||||||||||||||||||||||||||||||||||||||||||||||||||||||||||||||||||||||||||||||||||||||||||||||
| CSK | 0.234775877 | 0.00016932 | DAPK3 | −0.191517716 | 0.006880896 | ||||||||||||||||||||||||||||||||||||||||||||||||||||||||||||||||||||||||||||||||||||||||||||||
| FRK | 1.104629696 | 3.57E-16 | DCLK3 | 0.619636828 | 0.00052685 | ||||||||||||||||||||||||||||||||||||||||||||||||||||||||||||||||||||||||||||||||||||||||||||||
| HIPK4 | −0.450786343 | 1.84E-06 | STK17B | −0.220423503 | 1.61E-05 | ||||||||||||||||||||||||||||||||||||||||||||||||||||||||||||||||||||||||||||||||||||||||||||||
| ULK3 | 0.713039467 | 6.39E-15 | PIM3 | 0.31973622 | 0.026381134 | ||||||||||||||||||||||||||||||||||||||||||||||||||||||||||||||||||||||||||||||||||||||||||||||
| HCK | −1.165212956 | 1.95E-23 | SBK1 | 2.687143232 | 4.93E-21 | ||||||||||||||||||||||||||||||||||||||||||||||||||||||||||||||||||||||||||||||||||||||||||||||
| EPHA5 | 2.345418573 | 6.18E-07 | AXL | −0.849954085 | 2.15E-20 | ||||||||||||||||||||||||||||||||||||||||||||||||||||||||||||||||||||||||||||||||||||||||||||||
| HUNK | 0.09674773 | 0.030787751 | STK10 | −0.636132433 | 8.03E-15 | ||||||||||||||||||||||||||||||||||||||||||||||||||||||||||||||||||||||||||||||||||||||||||||||
| MAPK6 | 0.725789271 | 2.39E-12 | LRRK2 | −1.83742934 | 1.99E-26 | ||||||||||||||||||||||||||||||||||||||||||||||||||||||||||||||||||||||||||||||||||||||||||||||
| FLT3 | −0.1398755 | 0.00299809 | EPHB1 | 1.659989452 | 0.000183369 | ||||||||||||||||||||||||||||||||||||||||||||||||||||||||||||||||||||||||||||||||||||||||||||||
| EPHA8 | 4.28048008 | 1.29E-10 | CIT | 2.153606791 | 1.55E-10 | ||||||||||||||||||||||||||||||||||||||||||||||||||||||||||||||||||||||||||||||||||||||||||||||
| RET | 3.069514219 | 0.008169043 | CHEK2 | 1.617485001 | 7.44E-28 | ||||||||||||||||||||||||||||||||||||||||||||||||||||||||||||||||||||||||||||||||||||||||||||||
| TNNI3K | −0.062878035 | 0.000303105 | JAK3 | 1.263929465 | 3.54E-18 | ||||||||||||||||||||||||||||||||||||||||||||||||||||||||||||||||||||||||||||||||||||||||||||||
| ERBB2 | 1.17003348 | 7.02E-16 | FLT1 | −0.487731672 | 1.72E-06 | ||||||||||||||||||||||||||||||||||||||||||||||||||||||||||||||||||||||||||||||||||||||||||||||
| GAK | 0.456027428 | 1.55E-07 | PDGFRB | −0.084970938 | 0.043391534 | ||||||||||||||||||||||||||||||||||||||||||||||||||||||||||||||||||||||||||||||||||||||||||||||
| EPHB6 | −0.725722081 | 6.65E-20 | MAP3K3 | −0.883369078 | 7.21E-27 | ||||||||||||||||||||||||||||||||||||||||||||||||||||||||||||||||||||||||||||||||||||||||||||||
| MAPK4 | −1.381170977 | 6.74E-26 | MAPK14 | 0.221450042 | 0.000785059 | ||||||||||||||||||||||||||||||||||||||||||||||||||||||||||||||||||||||||||||||||||||||||||||||
| PIP4K2C | 0.769030841 | 2.34E-17 | RPS6KA1 | −0.437722081 | 2.89E-12 | ||||||||||||||||||||||||||||||||||||||||||||||||||||||||||||||||||||||||||||||||||||||||||||||
| FLT4 | −1.224022669 | 1.75E-20 | RPS6KA4 | 0.475941746 | 5.32E-09 | ||||||||||||||||||||||||||||||||||||||||||||||||||||||||||||||||||||||||||||||||||||||||||||||
| MAPK10 | −0.858238831 | 5.28E-18 | ABCG2 | −1.89336698 | 5.70E-30 | ||||||||||||||||||||||||||||||||||||||||||||||||||||||||||||||||||||||||||||||||||||||||||||||
| ABL1 | 0.147380872 | 0.049905786 | STK36 | 0.772784045 | 8.06E-11 | ||||||||||||||||||||||||||||||||||||||||||||||||||||||||||||||||||||||||||||||||||||||||||||||
| MAP3K19 | −1.413469509 | 1.19E-07 | NUAK2 | 0.816006757 | 2.61E-10 | ||||||||||||||||||||||||||||||||||||||||||||||||||||||||||||||||||||||||||||||||||||||||||||||
| IRAK3 | −0.501638979 | 1.69E-12 | ERBB4 | −1.508245411 | 3.70E-25 | ||||||||||||||||||||||||||||||||||||||||||||||||||||||||||||||||||||||||||||||||||||||||||||||
| MET | 1.424801167 | 0.000129599 | FGFR1 | −0.16161865 | 1.21E-08 | ||||||||||||||||||||||||||||||||||||||||||||||||||||||||||||||||||||||||||||||||||||||||||||||
| IRAK1 | 1.354218442 | 6.37E-30 | MAP2K5 | −0.26725795 | 3.39E-10 | ||||||||||||||||||||||||||||||||||||||||||||||||||||||||||||||||||||||||||||||||||||||||||||||
| RIPK2 | 0.4578374 | 0.000760452 | MINK1 | −0.448686448 | 1.12E-11 | ||||||||||||||||||||||||||||||||||||||||||||||||||||||||||||||||||||||||||||||||||||||||||||||
| PDGFRA | −0.195864444 | 0.000547589 | KIT | 0.521094359 | 0.031286428 | ||||||||||||||||||||||||||||||||||||||||||||||||||||||||||||||||||||||||||||||||||||||||||||||
| SLK | −0.148783403 | 0.000564055 | INSR | 0.386078443 | 0.00444343 | ||||||||||||||||||||||||||||||||||||||||||||||||||||||||||||||||||||||||||||||||||||||||||||||
| LYN | 0.428904666 | 1.71E-05 | CSNK1D | 0.394292094 | 6.97E-12 | ||||||||||||||||||||||||||||||||||||||||||||||||||||||||||||||||||||||||||||||||||||||||||||||
| FBP1 | −1.503007393 | 4.34E-25 | CSNK1E | 0.505317592 | 7.12E-09 | ||||||||||||||||||||||||||||||||||||||||||||||||||||||||||||||||||||||||||||||||||||||||||||||
| ABL2 | 0.480008559 | 1.26E-06 | SRC | 0.681725458 | 4.50E-13 | ||||||||||||||||||||||||||||||||||||||||||||||||||||||||||||||||||||||||||||||||||||||||||||||
| IRAK4 | 0.405731499 | 5.13E-08 | CDK7 | 0.727250182 | 1.99E-21 | ||||||||||||||||||||||||||||||||||||||||||||||||||||||||||||||||||||||||||||||||||||||||||||||
| PHKG2 | 0.969237137 | 1.19E-24 | FYN | −0.47858826 | 8.94E-09 | ||||||||||||||||||||||||||||||||||||||||||||||||||||||||||||||||||||||||||||||||||||||||||||||
| DDR1 | 0.937520074 | 1.48E-17 | KDR | −0.522808212 | 1.90E-10 | ||||||||||||||||||||||||||||||||||||||||||||||||||||||||||||||||||||||||||||||||||||||||||||||
| MAP3K2 | 0.30325161 | 0.010702075 | AURKA | 2.774021963 | 2.56E-31 | ||||||||||||||||||||||||||||||||||||||||||||||||||||||||||||||||||||||||||||||||||||||||||||||
| FGR | −1.931309907 | 5.10E-32 | MYLK2 | 0.958683785 | 4.57E-08 | ||||||||||||||||||||||||||||||||||||||||||||||||||||||||||||||||||||||||||||||||||||||||||||||
| BLK | 0.843421358 | 2.33E-05 | TEK | −3.092499222 | 3.22E-35 | ||||||||||||||||||||||||||||||||||||||||||||||||||||||||||||||||||||||||||||||||||||||||||||||
| AURKB | 3.590111346 | 8.17E-33 | ERBB3 | 0.956775604 | 6.37E-13 | ||||||||||||||||||||||||||||||||||||||||||||||||||||||||||||||||||||||||||||||||||||||||||||||
| MKNK1 | −0.094286595 | 0.041519321 | DYRK1A | −0.03193067 | 0.030787751 | ||||||||||||||||||||||||||||||||||||||||||||||||||||||||||||||||||||||||||||||||||||||||||||||
| TNIK | −0.287891618 | 4.90E-07 | NLK | 0.312268002 | 0.00010209 | ||||||||||||||||||||||||||||||||||||||||||||||||||||||||||||||||||||||||||||||||||||||||||||||
| Abbreviations: LUAD: lung adenocarcinoma; DEGs: differentially expressed genes; FC: fold change. | |||||||||||||||||||||||||||||||||||||||||||||||||||||||||||||||||||||||||||||||||||||||||||||||||||
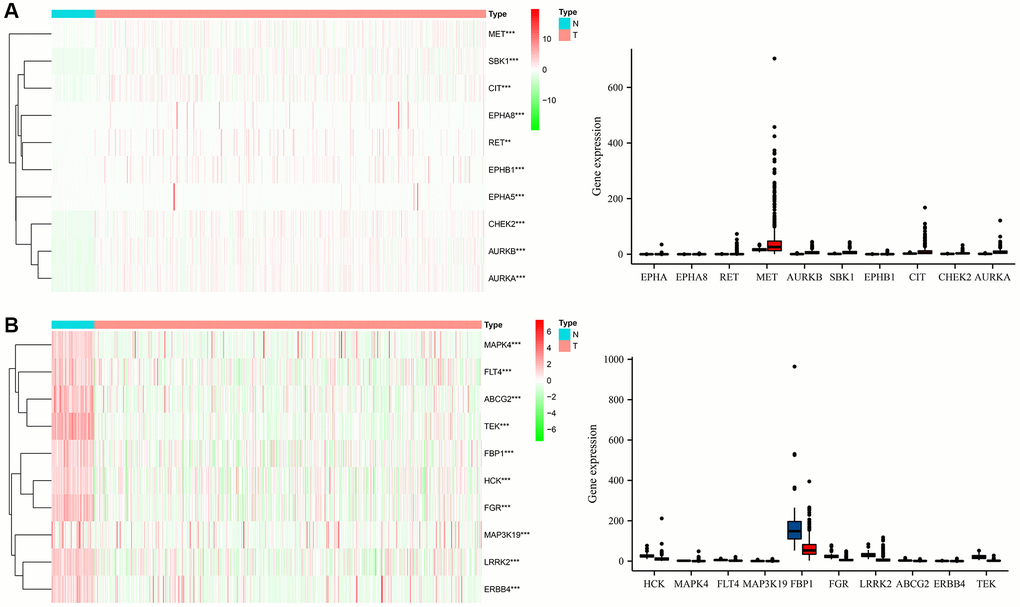
Figure 2. The expression levels of Gefitinib target genes in LUAD tissues. (A) High expression; (B) Low expression. Abbreviations: LUAD: Lung adenocarcinoma; T: LUAD tissues; N: normal tissues.
Biological functions, signaling mechanisms and protein-protein interaction (PPI) networks of the differentially expressed Gefitinib target genes (DEGTGs)
Gene ontology (GO) enrichment analysis revealed that the DEGTGs were significantly enriched in the intracellular signaling transduction, positive regulation of phosphatidylinositol 3-kinase activity, positive regulation of phosphatidylinositol 3-kinase signaling, receptor signaling protein tyrosine kinase activity, kinase activity, signal transduction, vascular endothelial growth factor-activated receptor activity, positive regulation of cell migration, vascular endothelial growth factor receptor signaling pathway, receptor complex, positive regulation of mitogen-activated protein kinase (MAPK) cascade, cell migration, growth factor binding, regulation of cell proliferation, negative regulation of apoptotic process, cell cycle, JNK cascade and others (Figure 3A–3C and Supplementary Table 1). Kyoto Encyclopedia of Genes and Genomes (KEGG) pathway analysis revealed that the DEGTGs were enriched in the Rap1, Ras, MAPK, ERBB, PI3K-AKT, HIF-1, pathways in cancer, calcium, insulin, GnRH, and other signaling pathways (Figure 3D and Table 3). A PPI network constructed based on the DEGTGs is shown in Figure 4A, and the key genes in the PPI network are revealed in Figure 4B.
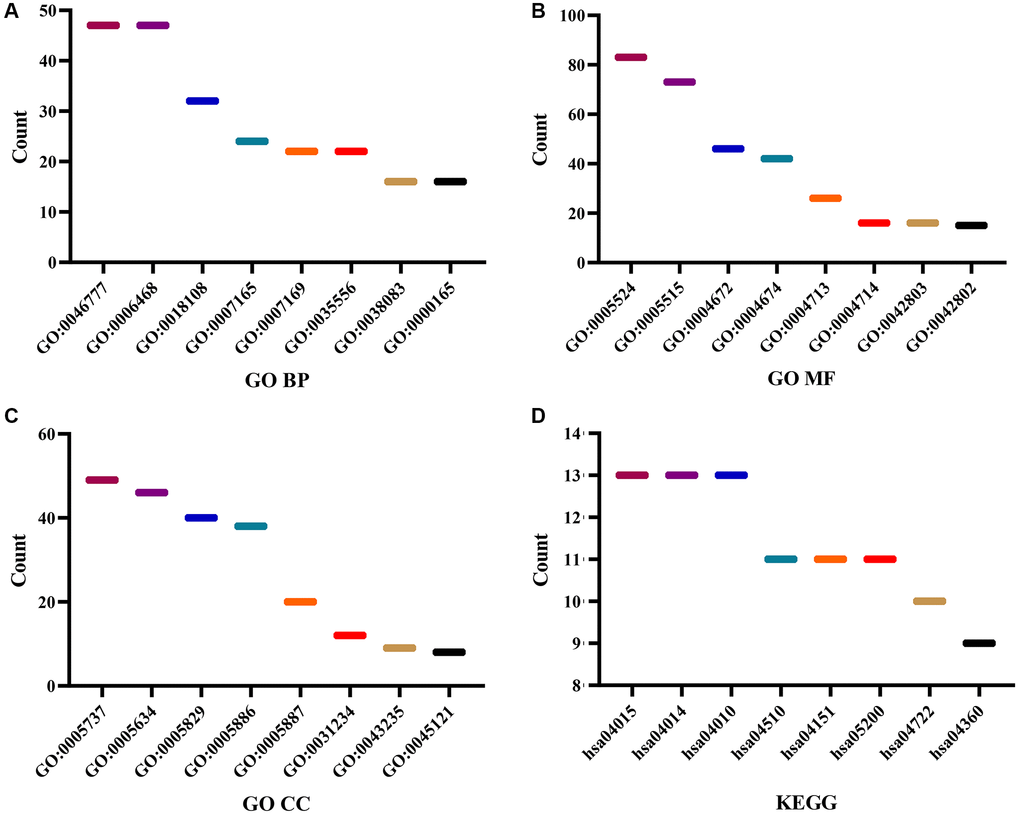
Figure 3. Functions and mechanisms of the DEGTGs. (A) BP; (B) MF; (C) CC; (D) KEGG. Abbreviations: DEGTGs: differentially expressed Gefitinib target genes; GO: gene ontology; KEGG: Kyoto Encyclopedia of Genes and Genomes; BP: biological process; MF: molecular function; CC: cell component.
Table 3. Signaling pathways of the DEGs in LUAD.
| Term | Pathways | Count | P | ||||||||||||||||||||||||||||||||||||||||||||||||||||||||||||||||||||||||||||||||||||||||||||||||
| hsa04015 | Rap1 signaling pathway | 13 | 1.84E-07 | ||||||||||||||||||||||||||||||||||||||||||||||||||||||||||||||||||||||||||||||||||||||||||||||||
| hsa04014 | Ras signaling pathway | 13 | 4.10E-07 | ||||||||||||||||||||||||||||||||||||||||||||||||||||||||||||||||||||||||||||||||||||||||||||||||
| hsa04722 | Neurotrophin signaling pathway | 10 | 7.75E-07 | ||||||||||||||||||||||||||||||||||||||||||||||||||||||||||||||||||||||||||||||||||||||||||||||||
| hsa05230 | Central carbon metabolism in cancer | 8 | 1.13E-06 | ||||||||||||||||||||||||||||||||||||||||||||||||||||||||||||||||||||||||||||||||||||||||||||||||
| hsa04010 | MAPK signaling pathway | 13 | 1.37E-06 | ||||||||||||||||||||||||||||||||||||||||||||||||||||||||||||||||||||||||||||||||||||||||||||||||
| hsa04510 | Focal adhesion | 11 | 9.51E-06 | ||||||||||||||||||||||||||||||||||||||||||||||||||||||||||||||||||||||||||||||||||||||||||||||||
| hsa04360 | Axon guidance | 9 | 1.24E-05 | ||||||||||||||||||||||||||||||||||||||||||||||||||||||||||||||||||||||||||||||||||||||||||||||||
| hsa04520 | Adherens junction | 7 | 3.15E-05 | ||||||||||||||||||||||||||||||||||||||||||||||||||||||||||||||||||||||||||||||||||||||||||||||||
| hsa04012 | ErbB signaling pathway | 7 | 9.96E-05 | ||||||||||||||||||||||||||||||||||||||||||||||||||||||||||||||||||||||||||||||||||||||||||||||||
| hsa05120 | Epithelial cell signaling in Helicobacter pylori infection | 6 | 2.72E-04 | ||||||||||||||||||||||||||||||||||||||||||||||||||||||||||||||||||||||||||||||||||||||||||||||||
| hsa04151 | PI3K-Akt signaling pathway | 11 | 7.06E-04 | ||||||||||||||||||||||||||||||||||||||||||||||||||||||||||||||||||||||||||||||||||||||||||||||||
| hsa04540 | Gap junction | 6 | 9.60E-04 | ||||||||||||||||||||||||||||||||||||||||||||||||||||||||||||||||||||||||||||||||||||||||||||||||
| hsa04066 | HIF-1 signaling pathway | 6 | 0.001419877 | ||||||||||||||||||||||||||||||||||||||||||||||||||||||||||||||||||||||||||||||||||||||||||||||||
| hsa05205 | Proteoglycans in cancer | 8 | 0.001653828 | ||||||||||||||||||||||||||||||||||||||||||||||||||||||||||||||||||||||||||||||||||||||||||||||||
| hsa05200 | Pathways in cancer | 11 | 0.001904711 | ||||||||||||||||||||||||||||||||||||||||||||||||||||||||||||||||||||||||||||||||||||||||||||||||
| hsa05131 | Shigellosis | 5 | 0.002249456 | ||||||||||||||||||||||||||||||||||||||||||||||||||||||||||||||||||||||||||||||||||||||||||||||||
| hsa04020 | Calcium signaling pathway | 7 | 0.004459107 | ||||||||||||||||||||||||||||||||||||||||||||||||||||||||||||||||||||||||||||||||||||||||||||||||
| hsa04910 | Insulin signaling pathway | 6 | 0.006817296 | ||||||||||||||||||||||||||||||||||||||||||||||||||||||||||||||||||||||||||||||||||||||||||||||||
| hsa04912 | GnRH signaling pathway | 5 | 0.007948726 | ||||||||||||||||||||||||||||||||||||||||||||||||||||||||||||||||||||||||||||||||||||||||||||||||
| hsa05152 | Tuberculosis | 6 | 0.018599898 | ||||||||||||||||||||||||||||||||||||||||||||||||||||||||||||||||||||||||||||||||||||||||||||||||
| hsa04664 | Fc epsilon RI signaling pathway | 4 | 0.021171958 | ||||||||||||||||||||||||||||||||||||||||||||||||||||||||||||||||||||||||||||||||||||||||||||||||
| hsa05169 | Epstein-Barr virus infection | 5 | 0.021410206 | ||||||||||||||||||||||||||||||||||||||||||||||||||||||||||||||||||||||||||||||||||||||||||||||||
| hsa05218 | Melanoma | 4 | 0.023707687 | ||||||||||||||||||||||||||||||||||||||||||||||||||||||||||||||||||||||||||||||||||||||||||||||||
| hsa04611 | Platelet activation | 5 | 0.026308393 | ||||||||||||||||||||||||||||||||||||||||||||||||||||||||||||||||||||||||||||||||||||||||||||||||
| hsa05133 | Pertussis | 4 | 0.027334651 | ||||||||||||||||||||||||||||||||||||||||||||||||||||||||||||||||||||||||||||||||||||||||||||||||
| hsa04068 | FoxO signaling pathway | 5 | 0.02899109 | ||||||||||||||||||||||||||||||||||||||||||||||||||||||||||||||||||||||||||||||||||||||||||||||||
| hsa04810 | Regulation of actin cytoskeleton | 6 | 0.035535444 | ||||||||||||||||||||||||||||||||||||||||||||||||||||||||||||||||||||||||||||||||||||||||||||||||
| hsa05215 | Prostate cancer | 4 | 0.041048942 | ||||||||||||||||||||||||||||||||||||||||||||||||||||||||||||||||||||||||||||||||||||||||||||||||
| hsa05219 | Bladder cancer | 3 | 0.049367551 | ||||||||||||||||||||||||||||||||||||||||||||||||||||||||||||||||||||||||||||||||||||||||||||||||
| Abbreviations: LUAD: lung adenocarcinoma; DEGs: differentially expressed genes. | |||||||||||||||||||||||||||||||||||||||||||||||||||||||||||||||||||||||||||||||||||||||||||||||||||
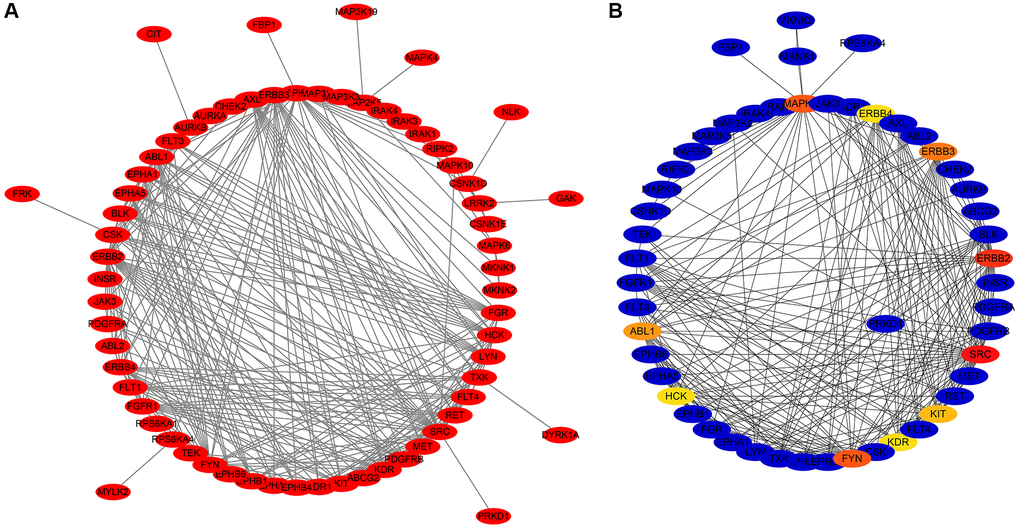
Figure 4. PPI network of the DEGTGs. (A) PPI network; (B) Hub DEGTGs in PPI network. Abbreviations: DEGTGs: differentially expressed Gefitinib target genes; PPI: protein-protein interaction.
Construction of a nomogram based on the DEGTGs
Survival analysis revealed that AURKA, AURKB, FBP1, FGR, HCK, LRRK2, and SBK1 levels were associated with poor prognosis in LUAD patients (Table 4). Receiver operating characteristic (ROC) analysis revealed that AURKA, AURKB, FBP1, FGR, HCK, LRRK2, and SBK1 had diagnostic values for LUAD, with the area under the curve (AUCs) of 0.961, 0.973, 0.910, 0.967, 0.895, 0.922, and 0.873, respectively. Based on the results of survival and ROC analysis, we constructed a nomogram based on the AURKA, AURKB, FBP1, FGR, HCK, LRRK2, and SBK1 (Figure 5).
Table 4. The prognosis values of the DEGs in LUAD.
| DEGs | HR | 95% CI | P | ||||||||||||||||||||||||||||||||||||||||||||||||||||||||||||||||||||||||||||||||||||||||||||||||
| AURKA | 1.51 | 1.11–2.05 | 0.009 | ||||||||||||||||||||||||||||||||||||||||||||||||||||||||||||||||||||||||||||||||||||||||||||||||
| AURKB | 1.48 | 1.09–2.02 | 0.013 | ||||||||||||||||||||||||||||||||||||||||||||||||||||||||||||||||||||||||||||||||||||||||||||||||
| FBP1 | 0.57 | 0.42–0.78 | <0.001 | ||||||||||||||||||||||||||||||||||||||||||||||||||||||||||||||||||||||||||||||||||||||||||||||||
| FGR | 0.63 | 0.46–0.86 | 0.003 | ||||||||||||||||||||||||||||||||||||||||||||||||||||||||||||||||||||||||||||||||||||||||||||||||
| HCK | 0.72 | 0.53–0.98 | 0.037 | ||||||||||||||||||||||||||||||||||||||||||||||||||||||||||||||||||||||||||||||||||||||||||||||||
| LRRK2 | 0.73 | 0.53–0.99 | 0.044 | ||||||||||||||||||||||||||||||||||||||||||||||||||||||||||||||||||||||||||||||||||||||||||||||||
| SBK1 | 0.67 | 0.49–0.91 | 0.01 | ||||||||||||||||||||||||||||||||||||||||||||||||||||||||||||||||||||||||||||||||||||||||||||||||
| Abbreviations: LUAD: lung adenocarcinoma; HR: hazard ratio; DEGs: differentially expressed genes; CI: confidence interval. | |||||||||||||||||||||||||||||||||||||||||||||||||||||||||||||||||||||||||||||||||||||||||||||||||||
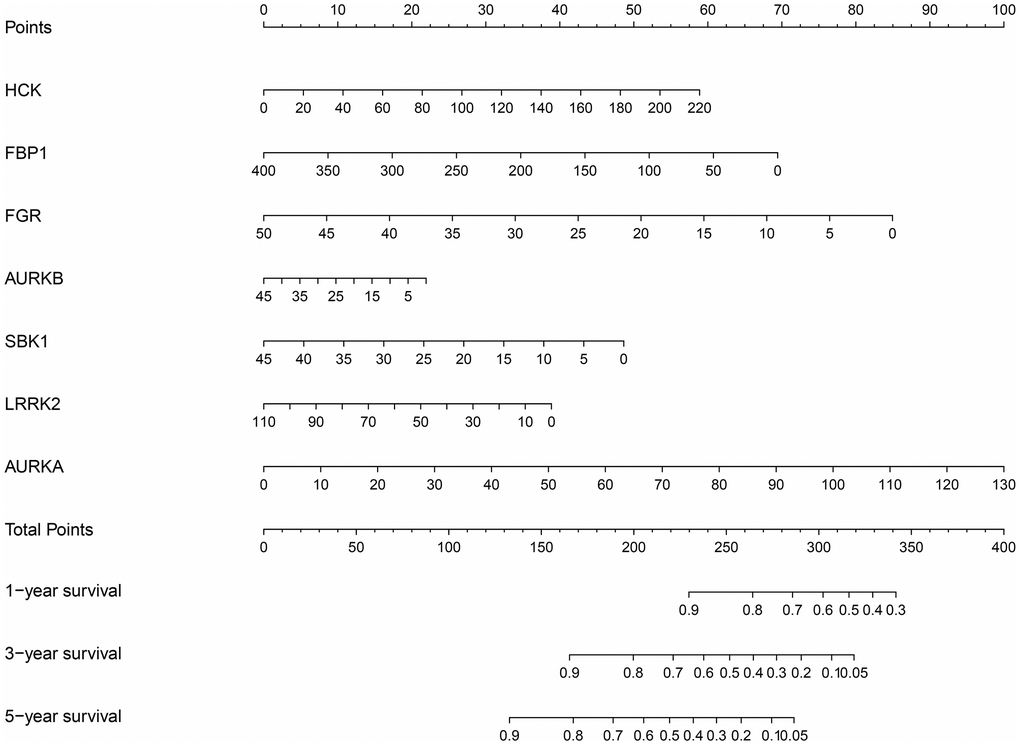
Figure 5. Nomogram of the DEGTGs in LUAD. Abbreviations: DEGTGs: differentially expressed Gefitinib target genes; LUAD: lung adenocarcinoma.
Functions and clinical values involved in subgroups of the DEGTGs
When LUAD patients were classified based on the AURKA, AURKB, FBP1, FGR, HCK, LRRK2, and SBK1 expression levels and K = 2, PCA analysis revealed significant differences between cluster1 and cluster2 (Figure 6). According to our screening criteria analysis, 93 DEGs were found in LUAD tissues of cluster 2 compared with cluster 1 (Table 5). 93 DEGs were significantly enriched in neutrophil-mediated cytotoxicity, regulation of cytokine biosynthetic process, killing of cells of other organisms, disruption of cells of other organisms, regulation of neurotransmitter levels, cytokine biosynthetic process, cytokine metabolic process, positive regulation of response to drug, drug transport, cytolysis, hormone activity and others (Figure 7 and Supplementary Table 2). Cox regression analysis revealed that the expression levels of OLFM4, CDH7, CRABP1, RAB3B, SLC13A5, IGF2BP1, INHA, ABCC2, DKK1, KRT6A, MAGEC1, FGA, SPX, HOXA13, KRT6C, UPK1B, CPS1, and EVX1 were significantly associated with the OS in LUAD (Figure 8A). The levels of OLFM4, CDH7, CRABP1, RAB3B, SLC13A5, IGF2BP1, INHA, ABCC2, DKK1, KRT6A, MAGEC1, FGA, SPX, HOXA13, KRT6C, UPK1B, CPS1, and EVX1 in normal tissues and LUAD tissues are shown in a heatmap and histogram (Figure 8B, 8C).
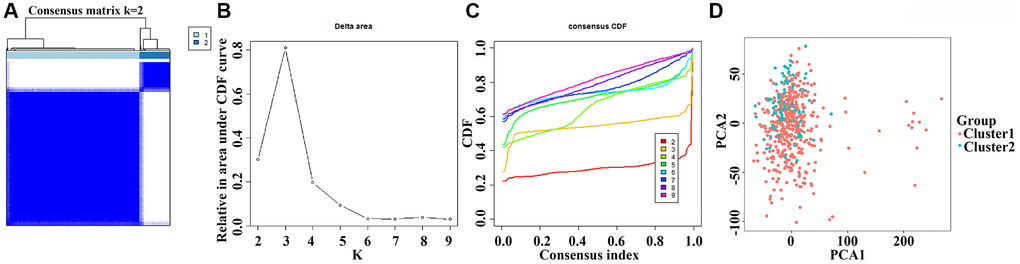
Figure 6. The clinical roles involved in subgroups of the DEGTGs in LUAD. Abbreviations: DEGTGs: differentially expressed Gefitinib target genes; LUAD: lung adenocarcinoma.
Table 5. The DEGs in the LUAD tissues of clusters 1 and 2.
| Gene | logFC | DFR | Gene | logFC | DFR | Gene | logFC | DFR | |||||||||||||||||||||||||||||||||||||||||||||||||||||||||||||||||||||||||||||||||||||||||||
| MYBPH | 2.386784135 | * | MAGEC1 | −4.746262844 | * | EIF4E1B | 2.117324727 | * | |||||||||||||||||||||||||||||||||||||||||||||||||||||||||||||||||||||||||||||||||||||||||||
| CSAG1 | −2.121155629 | * | HIST1H2BB | −2.024017432 | *** | RHCG | −2.887894921 | ** | |||||||||||||||||||||||||||||||||||||||||||||||||||||||||||||||||||||||||||||||||||||||||||
| OLFM4 | −2.854804976 | * | GBX2 | −2.270227346 | ** | CEACAM8 | 2.373919231 | *** | |||||||||||||||||||||||||||||||||||||||||||||||||||||||||||||||||||||||||||||||||||||||||||
| CHRNB2 | −2.648571164 | * | HOXA9 | −2.197847501 | * | TAS2R19 | −2.050800865 | *** | |||||||||||||||||||||||||||||||||||||||||||||||||||||||||||||||||||||||||||||||||||||||||||
| F2 | −2.77987994 | ** | PCSK1 | −3.499863036 | *** | UPK1B | −4.267455858 | * | |||||||||||||||||||||||||||||||||||||||||||||||||||||||||||||||||||||||||||||||||||||||||||
| FGF5 | −2.85157907 | * | MUC2 | −2.721128573 | ** | LVRN | −2.24465015 | * | |||||||||||||||||||||||||||||||||||||||||||||||||||||||||||||||||||||||||||||||||||||||||||
| CERS3 | −3.845929507 | * | EN1 | −2.674544647 | * | AKR1B10 | −2.587706792 | ** | |||||||||||||||||||||||||||||||||||||||||||||||||||||||||||||||||||||||||||||||||||||||||||
| DLX2 | −2.204529845 | * | CPA4 | −2.235707486 | ** | PF4V1 | −2.078641696 | ** | |||||||||||||||||||||||||||||||||||||||||||||||||||||||||||||||||||||||||||||||||||||||||||
| STXBP5L | −2.843404586 | * | FGA | −3.320329815 | ** | GNRH2 | −2.242805879 | * | |||||||||||||||||||||||||||||||||||||||||||||||||||||||||||||||||||||||||||||||||||||||||||
| CDH7 | −3.039737981 | *** | CYP4F3 | −2.409142625 | * | RSPO3 | −2.364153182 | * | |||||||||||||||||||||||||||||||||||||||||||||||||||||||||||||||||||||||||||||||||||||||||||
| ZMAT4 | −2.068479897 | * | OTOG | −2.091090919 | *** | UNC13A | −2.090243089 | * | |||||||||||||||||||||||||||||||||||||||||||||||||||||||||||||||||||||||||||||||||||||||||||
| DSG1 | −2.450943891 | ** | AFP | −6.392555822 | ** | INA | −2.039915212 | ** | |||||||||||||||||||||||||||||||||||||||||||||||||||||||||||||||||||||||||||||||||||||||||||
| FSTL5 | −2.276301555 | * | A2ML1 | −4.325521213 | *** | TBR1 | −3.109896148 | *** | |||||||||||||||||||||||||||||||||||||||||||||||||||||||||||||||||||||||||||||||||||||||||||
| ATP4A | −2.397331265 | * | KCNH5 | −2.848304727 | * | CPS1 | −2.851111003 | * | |||||||||||||||||||||||||||||||||||||||||||||||||||||||||||||||||||||||||||||||||||||||||||
| CRABP1 | −3.349924564 | ** | SPX | −2.490623817 | * | SLC30A10 | −4.590543663 | ** | |||||||||||||||||||||||||||||||||||||||||||||||||||||||||||||||||||||||||||||||||||||||||||
| KHDC1L | −3.588397669 | ** | MAGEA3 | −3.016068656 | * | BNC1 | −3.674589844 | * | |||||||||||||||||||||||||||||||||||||||||||||||||||||||||||||||||||||||||||||||||||||||||||
| RAB3B | −2.06611634 | *** | CYP2B6 | 2.975488322 | * | LBP | −3.308232739 | * | |||||||||||||||||||||||||||||||||||||||||||||||||||||||||||||||||||||||||||||||||||||||||||
| SLC13A5 | −2.433197228 | *** | SOHLH1 | −3.55661039 | * | TRIM40 | −2.736765196 | ** | |||||||||||||||||||||||||||||||||||||||||||||||||||||||||||||||||||||||||||||||||||||||||||
| FAM9B | −2.35516841 | * | MEP1B | −2.120697973 | * | PAH | −3.119569601 | *** | |||||||||||||||||||||||||||||||||||||||||||||||||||||||||||||||||||||||||||||||||||||||||||
| IGF2BP1 | −2.730067985 | * | BEST3 | −2.441217072 | ** | MAGEA12 | −2.240085198 | * | |||||||||||||||||||||||||||||||||||||||||||||||||||||||||||||||||||||||||||||||||||||||||||
| INHA | −2.481472865 | *** | HOXA13 | −2.248089536 | ** | ADGRF2 | −2.28498311 | ** | |||||||||||||||||||||||||||||||||||||||||||||||||||||||||||||||||||||||||||||||||||||||||||
| ABCC2 | −2.539707872 | ** | CNTNAP4 | −3.098050369 | * | GABRQ | −2.155966809 | * | |||||||||||||||||||||||||||||||||||||||||||||||||||||||||||||||||||||||||||||||||||||||||||
| ETNPPL | −2.154731918 | ** | KLK2 | −2.235050846 | * | TMPRSS11A | −2.985547264 | *** | |||||||||||||||||||||||||||||||||||||||||||||||||||||||||||||||||||||||||||||||||||||||||||
| FAM163A | −2.068836158 | ** | FOXD1 | −2.16123686 | ** | KCNC1 | −2.191200945 | * | |||||||||||||||||||||||||||||||||||||||||||||||||||||||||||||||||||||||||||||||||||||||||||
| HOXB9 | −2.678736573 | * | ALDOB | 2.218355443 | * | AC008763.3 | 2.244368079 | *** | |||||||||||||||||||||||||||||||||||||||||||||||||||||||||||||||||||||||||||||||||||||||||||
| MSMB | −2.544367684 | * | PI3 | −2.921061292 | *** | EVX1 | −2.083636412 | * | |||||||||||||||||||||||||||||||||||||||||||||||||||||||||||||||||||||||||||||||||||||||||||
| DKK1 | −2.17495906 | * | GNG4 | −2.044720885 | *** | HIST1H4C | −2.297578339 | ** | |||||||||||||||||||||||||||||||||||||||||||||||||||||||||||||||||||||||||||||||||||||||||||
| HEPHL1 | −2.404922517 | * | SLC6A2 | −2.027957245 | ** | ELANE | 2.228845734 | *** | |||||||||||||||||||||||||||||||||||||||||||||||||||||||||||||||||||||||||||||||||||||||||||
| KRT6A | −2.767443824 | ** | KRT6C | −2.712748642 | *** | CHGB | −2.082132761 | * | |||||||||||||||||||||||||||||||||||||||||||||||||||||||||||||||||||||||||||||||||||||||||||
| AZU1 | 2.289748111 | *** | HIST1H3F | −2.275440985 | * | GRM4 | −2.245814212 | ** | |||||||||||||||||||||||||||||||||||||||||||||||||||||||||||||||||||||||||||||||||||||||||||
| PATE2 | −2.538391387 | *** | CHRNA9 | −3.192651727 | ** | RETN | 2.013746243 | *** | |||||||||||||||||||||||||||||||||||||||||||||||||||||||||||||||||||||||||||||||||||||||||||
| Abbreviation: LUAD: lung adenocarcinoma; *P < 0.05; **P < 0.01; ***P < 0.001. | |||||||||||||||||||||||||||||||||||||||||||||||||||||||||||||||||||||||||||||||||||||||||||||||||||
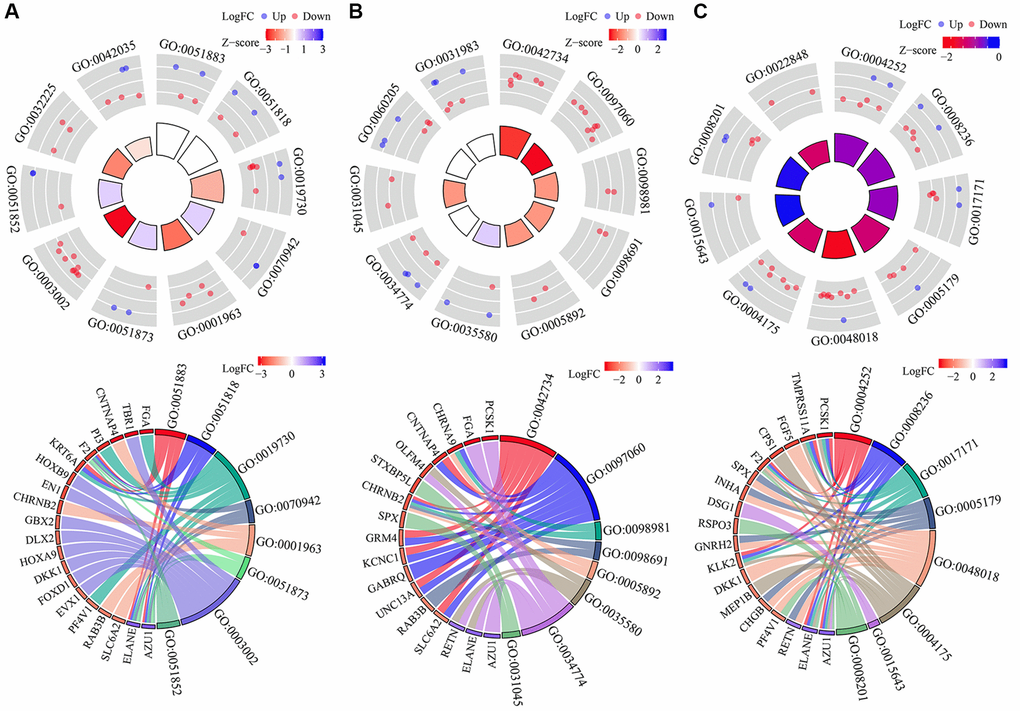
Figure 7. Functions involved in subgroups of the DEGTGs in LUAD. (A) BP; (B) CC; (C) MF. Abbreviations: DEGTGs: differentially expressed Gefitinib target genes; GO: gene ontology; KEGG: Kyoto Encyclopedia of Genes and Genomes; BP: biological process; MF: molecular function; CC: cell component; LUAD: lung adenocarcinoma.
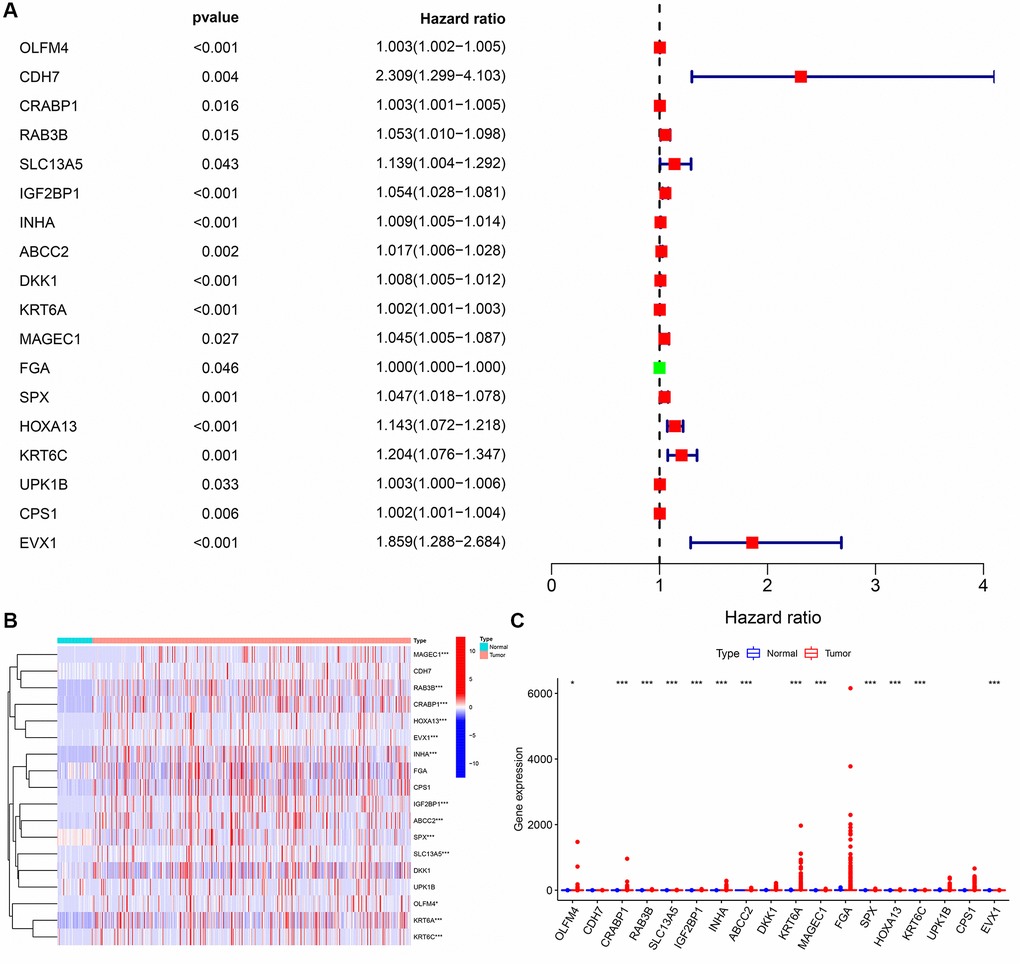
Figure 8. The prognosis values and levels of the DEGTGs in LUAD. (A) Prognosis related genes; (B, C) The levels of DEGTGs in LUAD. Abbreviations: DEGTGs: differentially expressed Gefitinib target genes; LUAD: lung adenocarcinoma.
Risk model of the DEGTGs
Univariate Cox regression analysis revealed that the expression levels of FBP1, FGR, AURKB, SBK1, LRRK2 and AURKA were significantly correlated with the OS of LUAD (Figure 9A). Multivariate COX regression analysis and the AIC method revealed that FBP1, SBK1, and AURKA were independent predictors of OS and were the influencing factors of the risk model (Figure 9B). Moreover, we found that Gefitinib promoted FBP1 mRNA and protein expression and inhibited the SBK1 and AURKA mRNA and protein expression in PC9 cells (Supplementary Figure 1). In addition, high-risk patients had a poor prognosis with the risk model based on FBP1, SBK1, and AURKA (Figure 9C–9E). Therefore, we constructed a nomogram for Gefitinib target genes FBP1, SBK1, and AURKA (Supplementary Figure 2). Univariate and multivariate Cox regression analysis revealed that the risk score and clinical stage correlated with poor prognosis in LUAD patients (Figure 10A, 10B). Therefore, we constructed a risk model-related nomogram (Figure 10C).
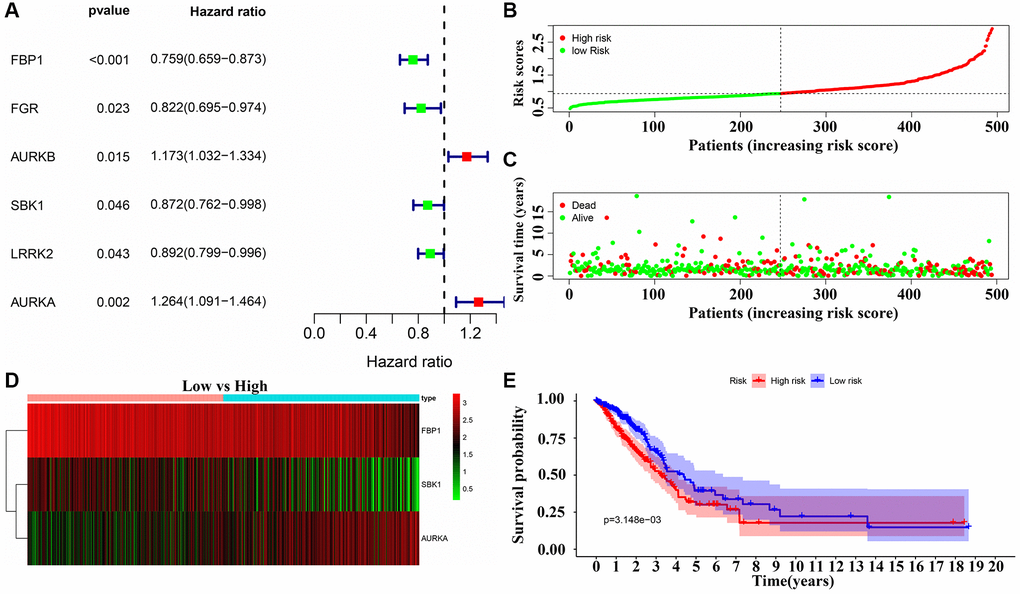
Figure 9. Risk model of the DEGTGs in LUAD. (A) Risk genes that affect patient prognosis in LUAD; (B–E) Patients with higher risk scores have the poor prognosis. Abbreviations: DEGTGs: differentially expressed Gefitinib target genes; LUAD: lung adenocarcinoma.
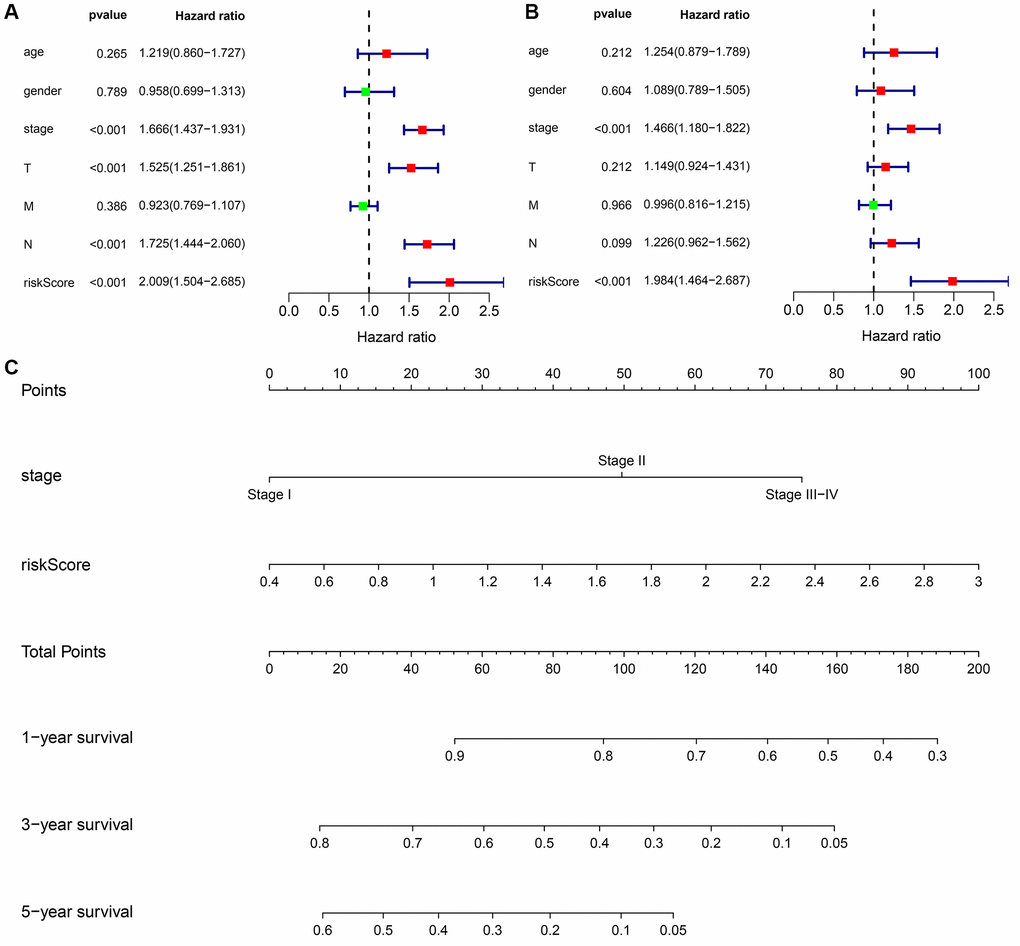
Figure 10. Prognosis-related risk scores and nomogram in LUAD. (A, B) Cox regression analysis that risk score is an independent risk factor for poor prognosis in LUAD patients; (C) Nomogram. Abbreviations: LUAD: lung adenocarcinoma.
Signaling mechanisms involved in risk model
In the risk model based on FBP1, SBK1 and AURKA, the high-risk score group was enriched in the cell cycle, oocyte meiosis, RNA degradation, basal transcription factors, spliceosome, ubiquitin-mediated proteolysis, homologous recombination, mismatch repair, p53 signaling pathway, regulation of autophagy, DNA replication, base excision repair and others (Table 6).
Table 6. Signaling pathways in LUAD of the high-risk group in the risk model.
| Name | Size | NES | Nom p |
| Cell cycle | 124 | 2.328981 | 0 |
| Oocyte meiosis | 112 | 2.1046698 | 0 |
| RNA degradation | 57 | 2.085798 | 0 |
| Pyrimidine metabolism | 97 | 2.0830867 | 0 |
| Basal transcription factors | 35 | 2.0283968 | 0 |
| Spliceosome | 126 | 2.0177684 | 0 |
| Ubiquitin mediated proteolysis | 133 | 1.9816493 | 0 |
| DNA replication | 36 | 1.9667591 | 0 |
| Homologous recombination | 28 | 1.9288028 | 0.00407332 |
| Mismatch repair | 23 | 1.9153036 | 0.008492569 |
| Proteasome | 44 | 1.912825 | 0.002074689 |
| Nucleotide excision repair | 44 | 1.8854126 | 0.008492569 |
| Progesterone mediated oocyte maturation | 85 | 1.856405 | 0 |
| One carbon pool by folate | 17 | 1.8456696 | 0.006060606 |
| P53 signaling pathway | 68 | 1.8163487 | 0.004219409 |
| Purine metabolism | 156 | 1.7766677 | 0.006276151 |
| N glycan biosynthesis | 46 | 1.7451223 | 0.011904762 |
| Regulation of autophagy | 35 | 1.6964251 | 0.008438818 |
| Cysteine and methionine metabolism | 34 | 1.6731151 | 0.013779528 |
| Protein export | 23 | 1.6567074 | 0.036608864 |
| Small cell lung cancer | 84 | 1.6488291 | 0.020449897 |
| Riboflavin metabolism | 15 | 1.6322458 | 0.024 |
| Base excision repair | 33 | 1.6144714 | 0.042918455 |
The risk score correlated with the immune microenvironment in LUAD
As shown in Figure 11, the risk score was significantly correlated with the immune score, estimate score, stromal score, and immune cells, including memory B cells, plasma cells, CD8 T cells, resting CD4 memory T cells, activated CD4 memory T cells, follicular helper T cells, regulatory T cells (Tregs), gamma delta T cells, resting NK cells, activated NK cells, monocytes, M1 macrophages, M2 macrophages, resting dendritic cells, resting mast cells, and activated mast cells (Figure 12). The expression levels of naïve B cells, memory B cells, resting dendritic cells, monocytes, M1 macrophages, plasma cells, resting mast cells, gamma delta T cells, activated CD4 memory T cells, resting NK cells, resting low-risk groups were significantly different (Supplementary Figure 3).
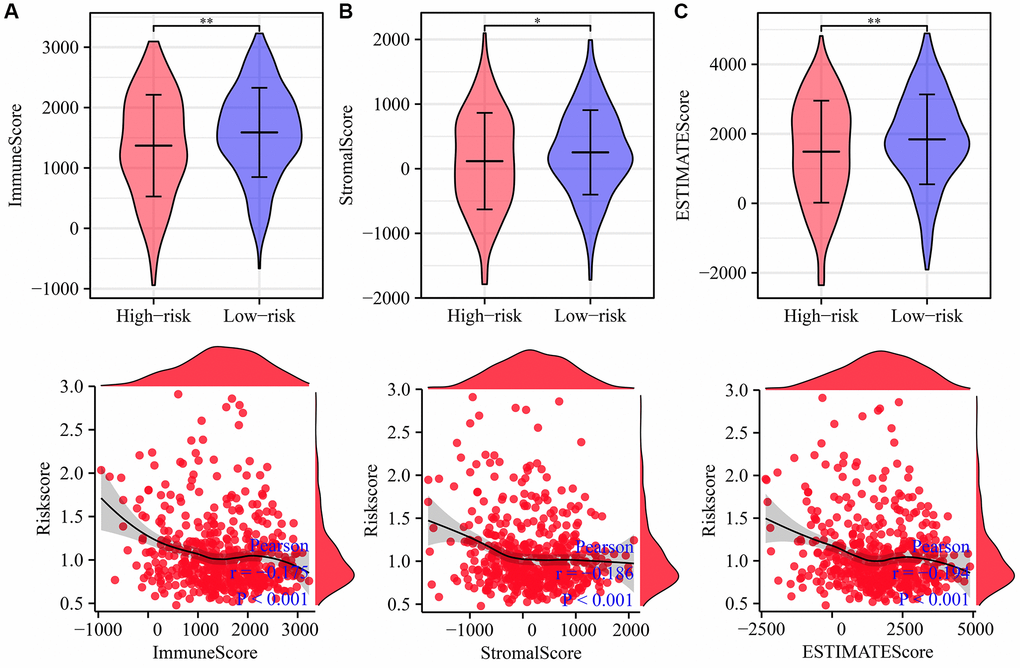
Figure 11. Risk score is related to the immune, estimate, and stromal scores in LUAD. (A) Immune score; (B) Estimate score; (C) Stromal score. Abbreviation: LUAD: lung adenocarcinoma.
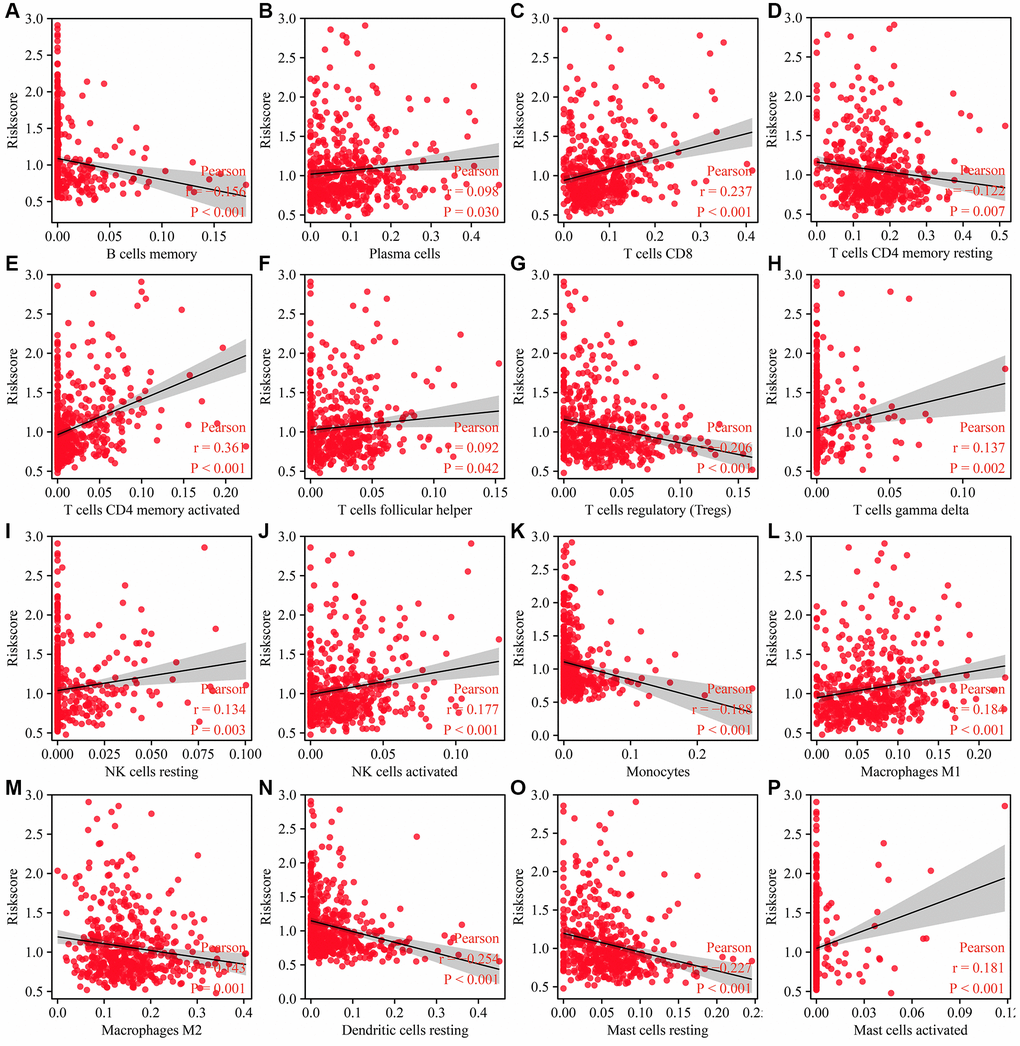
Figure 12. Risk model is related to the immune cells in LUAD. (A) B cells memory; (B) Plasma cells; (C) T cells CD8; (D) T cells CD4 memory resting; (E) T cells CD4 memory activated; (F) T cells follicular helper; (G) T cells regulatory (Tregs); (H) T cells gamma delta; (I) NK cells resting; (J) NK cells activated; (K) Monocytes; (L) Macrophages M1; (M) Macrophages M2; (N) Dendritic cells resting; (O) Mast cells resting; (P) Mast cells activated. Abbreviation: LUAD: lung adenocarcinoma.
The risk score was significantly correlated with immune cell markers such as CSF1R, STAT5A, STAT5B, ITGAM, BCL6, CD274 (PD-L1), ITGAX, CD8B, and others (Figure 13 and Supplementary Figure 4). In addition, immune cell markers such as CSF1R, STAT5A, STAT5B, ITGAM, BCL6, CD274, ITGAX, CD8B, CD1C, HLA-DPB1, CD8A, NRP1, GZMB, CEACAM8, HLA-DRA, KIR3DL3, IRF5, TGFB1, HLA-DPA1, IL21, HLA-DQB1, KIR2DL3, and TNF were significantly different between the high- and low-risk groups (Supplementary Figure 5).
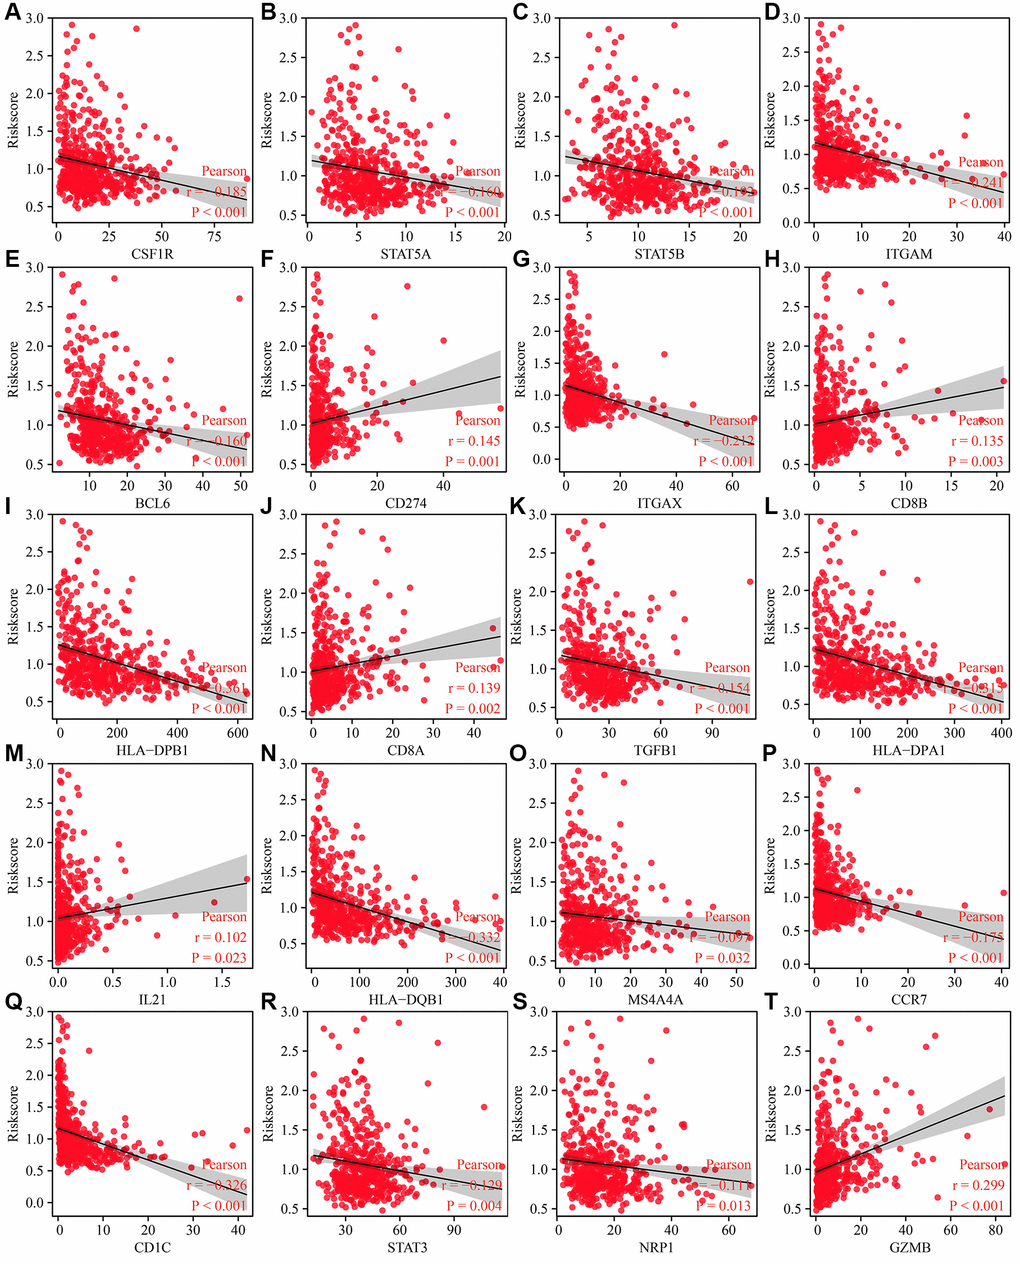
Figure 13. Risk model related to the immune cell markers in LUAD. (A) CSF1R; (B) STAT5A; (C) STAT5B; (D) ITGAM; (E) BCL6; (F) CD274; (G) ITGAX; (H) CD8B; (I) HLA-DPB1; (J) CD8A; (K) TGFB1; (L) HLA-DPA1; (M) IL21; (N) HLA-DQB1; (O) S4A4A; (P) CCR7; (Q) CD1C; (R) STAT3; (S) NRP1; (T)GZMB. Abbreviation: LUAD: lung adenocarcinoma.
Discussion
It is well-established that Gefitinib can improve the prognosis of patients with EGFR-mutant LUAD. Current evidence suggests that compared with chemotherapy alone, chemotherapy combined with Gefitinib could improve the PFS, ORR, and OS in LUAD patients with EGFR mutations [6]. In the present study, we found that with an increase in Gefitinib concentration, the proliferation ability of LUAD PC9 cells decreased, the apoptosis rate raised significantly, and cell migration and invasion were inhibited. Moreover, Gefitinib target genes are significantly enriched in intracellular signal transduction, positive regulation of phosphatidylinositol 3-kinase activity, positive regulation of phosphatidylinositol 3-kinase signaling, receptor signaling protein tyrosine kinase activity, kinase activity, signaling transduction, vascular endothelial growth factor-activated receptor activity, positive regulation of cell migration, vascular endothelial growth factor receptor signaling pathway, receptor complex, positive regulation of MAPK cascade, cell migration, growth factor binding, regulation of cell proliferation, negative regulation of apoptotic process, cell cycle, JNK cascade, etc. These findings indicate that Gefitinib has important anticancer effects against the progression of LUAD.
There were 100 Gefitinib target genes in the SwissTargetPrediction database, which were mainly kinases and most targets were the DEGs in LUAD tissues. The levels of Gefitinib targets AURKA, AURKB, FBP1, FGR, HCK, LRRK2, and SBK1, were associated with a poor prognosis in patients with LUAD and had diagnostic values for LUAD. Cox regression analysis revealed that the expression levels of FBP1, SBK1 and AURKA correlated with the OS and the risk model in LUAD. In PC9 cells, Gefitinib could promote FBP1 expression and inhibit SBK1 and AURKA levels. An increasing body of evidence suggests that FBP1, SBK1 and AURKA are associated with lung cancer progression [10–15]. For instance, FBP1 was found to be downregulated in lung cancer tissues and cells. Decreased levels of FBP1 expression were associated with poor prognosis in lung cancer patients. Activation of FBP1 expression could inhibit glucose uptake and lactate production, induce oxygen consumption capacity, and inhibit lung cancer cell proliferation and invasion under hypoxic conditions in vitro and lung cancer growth in vivo [10]. High expression of AURKA correlated with shorter OS in lung cancer patients. Inhibition of AURKA expression reduced lung cancer cell growth and enhanced the sensitivity of lung cancer cells to radiation [13]. Upon inhibition of long non-coding RNA ENST000001520 in BEAS-2B cells, a notable decrease is observed in cell migration and proliferation abilities, accompanied by an increase in apoptosis capabilities. These changes can be attributed to the downregulation of SBK1 and SOCS3 mRNA and protein expression [14]. This finding indicated that Gefitinib could affect FBP1, SBK1 and AURKA expression to inhibit LUAD progression.
In recent years, risk models have been used to assess the prognosis of patients with LUAD [2, 16–18]. For example, XRCC4, XRCC5 and XRCC6 were identified as the risk factors affecting the prognosis of patients with LUAD. A risk model based on XRCC4, XRCC5 and XRCC6 showed that the risk score was related to the prognosis, gender, clinical stage, T stage, lymph node metastasis and metastasis of LUAD patients and was an independent risk factor for the prognosis of LUAD patients [2]. The risk model and nomogram constructed based on Gefitinib target genes FBP1, SBK1, and AURKA were risk factors associated with poor prognosis of LUAD patients. The risk score was significantly correlated with the immune score, estimate score, stromal score, memory B cells, plasma cells, CD8T cells, resting CD4 memory T cells, activated CD4 memory T cells, follicular helper T cells, Tregs, gamma delta T cells, resting NK cells, activated NK cells, monocytes, M1 macrophages, M2 macrophages, resting dendritic cells, resting mast cells, and activated mast cells, and with CSF1R, STAT5A, STAT5B, ITGAM, BCL6, PD-L1, ITGAX, CD8B, and other immune cell marker levels.
Overall, we explored the roles of Gefitinib against LUAD progression using bioinformatics and cellular experiments and found that the risk model constructed based on the Gefitinib target genes FBP1, SBK1, and AURKA was associated with a dismal prognosis and was closely related to the immune microenvironment. However, the relationship between EGFR mutations and Gefitinib target genes (FBP1, SBK1, and AURKA) warrants further investigation, and cancer tissues were collected to confirm the relationship between the risk model and nomogram and the prognosis of LUAD patients in the future. In addition, we will further investigate the impact of downregulating or promoting FBP1, SBK1, and AURKA expression in PC9 cells on lung adenocarcinoma in the future. In general, Gefitinib could inhibit the proliferation, migration and invasion, promote the apoptosis of LUAD PC9 cells and the expression of FBP1, and inhibit the expression of SBK1 and AURKA. High-risk LUAD patients based on the FBP1, SBK1, and AURKA had a poor prognosis. Our risk model and nomogram based on the FBP1, SBK1 and AURKA were associated with poor prognosis and immune cell infiltration levels in LUAD patients, suggesting their significant value in evaluating the prognosis of LUAD patients.
Conclusions
The present results indicate that Gefitinib could inhibit the proliferation, migration and invasion, promote the apoptosis of LUAD PC9 cells and the expression of FBP1, and inhibit the expression of SBK1 and AURKA. High-risk LUAD patients based on the FBP1, SBK1, and AURKA had a poor prognosis. Our risk model and nomogram based on the FBP1, SBK1 and AURKA were associated with poor prognosis and immune cell infiltration levels in LUAD patients.
Materials and Methods
PC9 cell culture and construction of cell models
The PC9 cell line was cultured in the RPMI-1640 with 10% fetal bovine serum at 37°C in an incubator with 5% CO2. The PC9 cells were cultured in 6-well plates for 24 h in an incubator, then 0, 0.002, 0.02, 0.2, and 2 μM of Gefitinib were added.
Cell growth
The effects of Gefitinib on the proliferation and apoptosis of PC9 cells were detected by CCK-8 and flow cytometry. The experimental steps of CCK-8 were as follows: cell counting and 96-well plate plating, and 0, 0.002, 0.02, 0.2 and 2 μM Gefitinib were added to incubate cells. The CCK-8 solution at 24, 48, and 72 h incubation, and reading after 1 h incubation to appraisal the absorbance values of each group. The flow cytometry experiment steps were as follows: cell counting, and 6-well plate plating. 0, 0.002, 0.02, 0.2, and 2 μM Gefitinib were added to incubate cells, and stained according to the manufacturer’s instructions. The apoptotic PC9 cells were immediately detected using the FACS Caliber II Sorter and the Cell Quest FACS system (BD Biosciences, USA). The data were analyzed using FlowJo software (Version: 7.6.5).
Cell migration and invasion
In 6 well plate, the clean tip of pipette is used to create “wound” when cells form confluent monolayer, and cells cultured in RPMI-1640 were supplemented with 0% fetal bovine serum. Transfected cells were used to capture the image of wound edge with optical microscope at 0 h. After 24 h of incubation, the cell images of the same area were captured for measurement, and the wound healing rate was calculated [19]. Transfected cells were investigated for transwell migration. The basal lateral chamber was balanced with 600 μL RPMI-1640 medium containing 10% fetal bovine serum, while the apical chamber was added with 200 μL PC9 cell suspension without FBS. After 24 h of incubation at 37°C and 5% CO2. According to the manufacturer's agreement of transwell System, fix the transwell chamber with 5% paraformaldehyde for 15 min, and then dye it with 0.1% crystal violet for 10 min. Transmembrane cells were calculated under inverted fluorescence microscope [19].
Acquisition and identification of Gefitinib target genes
The secondary structure of Gefitinib was obtained from the official website of the PubChem database, and then the target genes of Gefitinib were obtained from the SwissTargetPrediction database using the structure of Gefitinib. The transcriptome data of 59 normal tissues and 535 LUAD tissues were downloaded from the official website of The Cancer Genome Atlas (TCGA) database, and the gene expression data of Gefitinib targets in normal tissues and cancer tissues were extracted and analyzed using the Limma package.
Biological functions, signaling mechanisms and PPI network of DEGTGs
A P-value < 0.05 was used to screen for significant DEGTGs in LUAD tissues. The DEGTGs underwent GO and KEGG analyses to investigate the biological functions and signaling mechanisms of Gefitinib target genes. A PPI network of the DEGTGs was constructed in the STRING database. The PPI network was visualized by Cytoscape software, and the key genes were selected by the degree method using the CytoHubba plugin [19, 20].
The roles of Gefitinib target gene subgroups in LUAD using consensus clustering
The gene expression data of AURKA, AURKB, FBP1, FGR, HCK, LRRK2, and SBK1 in LUAD tissues from TCGA were extracted. The Consensus ClusterPlus package clustered LUAD patients and determined the optimal k value to group the LUAD patients. Principal component analysis (PCA) was used to explore the differences between subgroups constructed based on the AURKA, AURKB, FBP1, FGR, HCK, LRRK2, and SBK1. The differentially expressed genes (DEGs) in the tissues of the two groups of LUAD patients were identified using the screening criteria logFC (>2 or <−2) and FDR < 0.05. The biological functions and signaling mechanisms involved in DEGs in the subgroups of Gefitinib target genes were explored using GO and KEGG analyses. The relationship between DEGs in the subgroups of Gefitinib target genes and OS of LUAD patients was analyzed using COX regression analysis, and the expression of prognostic genes in normal lung tissues and LUAD tissues was visualized.
Construction of risk model based on the DEGTGs
Univariate Cox regression analysis was used to reveal the relationship between the gene expression levels of DEGTGs AURKA, AURKB, FBP1, FGR, HCK, LRRK2, and SBK1 and OS in patients with LUAD, with P < 0.05 as the screening criteria. Then, the relationship between the expression levels of FBP1, FGR, AURKB, SBK1, LRRK2, and AURKA and the OS of LUAD patients was analyzed using multivariate COX regression analysis and the Akaike information criterion (AIC) method. The effects of Gefitinib on AURKA, FBP1, and SBK1 were assessed by qRT-PCR and western blotting, and a risk model was established based on these results.
qRT-PCR
Trizol (Thermo Fisher Scientific, China) was used to isolate total RNA from the PC9 cells after supplementing Gefitinib, and total RNAs were reverse-transcribed into cDNA using the Revertra Ace qPCR RT Kit (Toyobo life science, Japan). The UltraSYBR mixture (cwbio, China) was used to complete the PCR cycles using a StepOne Plus Real-Time PCR System (ABI, USA). The change in relative AURKA, FBP1 and SBK1 mRNA expression levels were calculated using the 2ΔΔct method. The primer sequences of AURKA, FBP1 and SBK1, and β-actin used were as follows. AURKA forward: 5′-GTGGAGCATCAGCTCAGAAGA-3′ and reverse 5′-ACTGTTCCAAGTGGTGCATA-3′; FBP1 forward: 5′-ATCGATTGCCTTGTGTCCGT-3′ and reverse 5′-AAGCAGTTGACCCCACAGTC-3′; SBK1 forward: 5′-ACGTCACCAAGCA CTACGAA-3′ and reverse 5′-GTGATGCTCACCTCCCGTAG-3′; β-actin forward 5′-ACTCTTCCAGCCTTCCTTCC-3′ and reverse 5′-CGTCA TACTCCTGCTTGCTG-3′.
Western blotting
Total protein was isolated from PC9 cells by using cell lysate after Gefitinib supplementation. Protein gel electrophoresis was performed after quantitative analysis using the BCA method. After electroporation, the PVDF film was cut and incubated overnight at low temperature with the primary antibody. The second antibody was incubated, and the protein was exposed the following day. The primary antibodies used, along with their respective concentrations, were the 1:3000 FBP1 (Proteintech, China), 1:1000 SBK1 (HUABIO, China), 1:1000 AURKA (HUABIO, China), and 1:10000 GAPDH (Proteintech, China).
Construction of a nomogram of risk model
Univariate and multivariate COX regression analysis was used to reveal the relationship between the age, gender, clinical stage, T stage, N stage, M stage, risk score, and prognosis of cancer patients. Finally, a risk model related to the nomogram was constructed.
Signaling mechanisms of the risk model
Gene Set enrichment analysis (GSEA) is a commonly used method to reveal the functions and mechanisms involved in the risk models [21–23]. In our study, we divided the gene expression data of LUAD patients into high- and low-risk groups. The impact of high- and low-risk groups was analyzed on each gene set to reveal the signaling mechanism involved in the risk model in the GSEA software [21–23].
Analysis of the relationship between the risk model and the LUAD immune microenvironment
The gene expression data in 535 LUAD tissues were immunoscored by using the CIBERSORT and estimate methods. Correlation analysis was used to reveal the relationship between the risk score and the levels of immune cells, stromal score, immune score, estimate score and immune cell markers in LUAD. The levels of immune cells, stromal score, immune score, estimate score, and immune cell markers in the high- and low-risk groups were explored in LUAD.
Statistical analysis
The significance of the effect of Gefitinib on LUAD cell growth and migration and the difference in the expression of the immune cells, stromal score, immune score, estimate score and immune cell markers in high- and low-risk groups were identified using the Student’s t-test. Survival and Cox regression analyses were used to assess the prognostic value of Gefitinib target genes. The diagnostic values of Gefitinib target genes for LUAD were identified using the ROC analysis. The AUC close to 1 was associated with a good diagnostic value. A P-value < 0.05 was statistically significant.
Availability of data and materials
The data were acquired from publicly available databases, and additional data could be obtained from the corresponding author upon reasonable request.
Abbreviations
LUAD: lung adenocarcinoma; PFS: progression-free survival; OS: overall survival; TCGA: the cancer genome atlas; DEGTGs: differentially expressed Gefitinib target genes; GO: gene ontology; KEGG: Kyoto Encyclopedia of Genes and Genomes; PPI: protein-protein interaction; PCA: Principal component analysis; DEG: differentially expressed genes.
Author Contributions
Qiang Guo, Kai Li, and Ni jiang processed the data for the study and wrote the first draft. Chuang-Yan Wu, Rui Zhou, and Xin-Rui Rao performed experiments. Qiang Guo and Chuang-Yan Wu edited the language of the article. Chuang-Yan Wu and Qiang Guo formulated research ideas and programs and supervised the implementation of the program.
Acknowledgments
Thanks to team members for their support and the open data provided by the TCGA database.
Conflicts of Interest
The authors declare no conflicts of interest related to this study.
Funding
Our research was supported by the Natural Science Foundation of China (No. 82100115, 82070431, 82100299, and 82100116) and the Natural Science Foundation of Hubei (No. 2020CFB392, and 2020CFB818).
References
- 1. Wang S, Wang Q, Fan B, Gong J, Sun L, Hu B, Wang D. Machine learning-based screening of the diagnostic genes and their relationship with immune-cell infiltration in patients with lung adenocarcinoma. J Thorac Dis. 2022; 14:699–711. https://doi.org/10.21037/jtd-22-206 [PubMed]
- 2. Zhang QX, Yang Y, Yang H, Guo Q, Guo JL, Liu HS, Zhang J, Li D. The roles of risk model based on the 3-XRCC genes in lung adenocarcinoma progression. Transl Cancer Res. 2021; 10:4413–31. https://doi.org/10.21037/tcr-21-1431 [PubMed]
- 3. Cai W, Ni W, Jin Y, Li Y. TRIP13 promotes lung cancer cell growth and metastasis through AKT/mTORC1/c-Myc signaling. Cancer Biomark. 2021; 30:237–48. https://doi.org/10.3233/CBM-200039 [PubMed]
- 4. Li Q, Huang X, Li QY, Tang Y, Liang LB, Luo Q, Gong M, Song YX, Guo Q, Chen C. CENPH overexpression promotes the progression, cisplatin resistance, and poor prognosis of lung adenocarcinoma via the AKT and ERK/P38 pathways. Am J Cancer Res. 2023; 13:1682–97. [PubMed]
- 5. Chen Y, Tang J, Lu T, Liu F. CAPN1 promotes malignant behavior and erlotinib resistance mediated by phosphorylation of c-Met and PIK3R2 via degrading PTPN1 in lung adenocarcinoma. Thorac Cancer. 2020; 11:1848–60. https://doi.org/10.1111/1759-7714.13465 [PubMed]
- 6. Han B, Jin B, Chu T, Niu Y, Dong Y, Xu J, Gu A, Zhong H, Wang H, Zhang X, Shi C, Zhang Y, Zhang W, et al. Combination of chemotherapy and gefitinib as first-line treatment for patients with advanced lung adenocarcinoma and sensitive EGFR mutations: A randomized controlled trial. Int J Cancer. 2017; 141:1249–56. https://doi.org/10.1002/ijc.30806 [PubMed]
- 7. Lou L, Wang J, Lv F, Wang G, Li Y, Xing L, Shen H, Zhang X. Y-box binding protein 1 (YB-1) promotes gefitinib resistance in lung adenocarcinoma cells by activating AKT signaling and epithelial-mesenchymal transition through targeting major vault protein (MVP). Cell Oncol (Dordr). 2021; 44:109–33. https://doi.org/10.1007/s13402-020-00556-y [PubMed]
- 8. Ding J, Ding X, Leng Z. LPCAT1 promotes gefitinib resistance via upregulation of the EGFR/PI3K/AKT signaling pathway in lung adenocarcinoma. J Cancer. 2022; 13:1837–47. https://doi.org/10.7150/jca.66126 [PubMed]
- 9. Wu H, Xu L, Hu X. KDM5A regulates the growth and gefitinib drug resistance against human lung adenocarcinoma cells. 3 Biotech. 2022; 12:97. https://doi.org/10.1007/s13205-021-03018-w [PubMed]
- 10. Zhang J, Wang J, Xing H, Li Q, Zhao Q, Li J. Down-regulation of FBP1 by ZEB1-mediated repression confers to growth and invasion in lung cancer cells. Mol Cell Biochem. 2016; 411:331–40. https://doi.org/10.1007/s11010-015-2595-8 [PubMed]
- 11. Cong J, Wang X, Zheng X, Wang D, Fu B, Sun R, Tian Z, Wei H. Dysfunction of Natural Killer Cells by FBP1-Induced Inhibition of Glycolysis during Lung Cancer Progression. Cell Metab. 2018; 28:243–55.e5. https://doi.org/10.1016/j.cmet.2018.06.021 [PubMed]
- 12. Wang J, Hu T, Wang Q, Chen R, Xie Y, Chang H, Cheng J. Repression of the AURKA-CXCL5 axis induces autophagic cell death and promotes radiosensitivity in non-small-cell lung cancer. Cancer Lett. 2021; 509:89–104. https://doi.org/10.1016/j.canlet.2021.03.028 [PubMed]
- 13. Liu N, Wang YA, Sun Y, Ecsedy J, Sun J, Li X, Wang P. Inhibition of Aurora A enhances radiosensitivity in selected lung cancer cell lines. Respir Res. 2019; 20:230. https://doi.org/10.1186/s12931-019-1194-8 [PubMed]
- 14. Li Z, Zhang Y, Meng L, Yang S, Zhang P, Zhang J, Li C, Feng F, Zhang Q. LncRNA-ENST00000501520 promotes the proliferation of malignant-transformed BEAS-2B cells induced with coal tar pitch mediated by target genes. Environ Toxicol. 2019; 34:869–77. https://doi.org/10.1002/tox.22759 [PubMed]
- 15. Hu ZW, Sun W, Wen YH, Ma RQ, Chen L, Chen WQ, Lei WB, Wen WP. CD69 and SBK1 as potential predictors of responses to PD-1/PD-L1 blockade cancer immunotherapy in lung cancer and melanoma. Front Immunol. 2022; 13:952059. https://doi.org/10.3389/fimmu.2022.952059 [PubMed]
- 16. Ren Q, Zhang P, Lin H, Feng Y, Chi H, Zhang X, Xia Z, Cai H, Yu Y. A novel signature predicts prognosis and immunotherapy in lung adenocarcinoma based on cancer-associated fibroblasts. Front Immunol. 2023; 14:1201573. https://doi.org/10.3389/fimmu.2023.1201573 [PubMed]
- 17. Li F, Ge D, Sun SL. A novel ferroptosis-related genes model for prognosis prediction of lung adenocarcinoma. BMC Pulm Med. 2021; 21:229. https://doi.org/10.1186/s12890-021-01588-2 [PubMed]
- 18. Wu J, Li L, Zhang H, Zhao Y, Zhang H, Wu S, Xu B. A risk model developed based on tumor microenvironment predicts overall survival and associates with tumor immunity of patients with lung adenocarcinoma. Oncogene. 2021; 40:4413–24. https://doi.org/10.1038/s41388-021-01853-y [PubMed]
- 19. Xiao XY, Guo Q, Tong S, Wu CY, Chen JL, Ding Y, Wan JH, Chen SS, Wang SH. TRAT1 overexpression delays cancer progression and is associated with immune infiltration in lung adenocarcinoma. Front Oncol. 2022; 12:960866. https://doi.org/10.3389/fonc.2022.960866 [PubMed]
- 20. Chin CH, Chen SH, Wu HH, Ho CW, Ko MT, Lin CY. cytoHubba: identifying hub objects and sub-networks from complex interactome. BMC Syst Biol. 2014 (Suppl 4); 8:S11. https://doi.org/10.1186/1752-0509-8-S4-S11 [PubMed]
- 21. Zhang Y, Tang M, Guo Q, Xu H, Yang Z, Li D. The value of erlotinib related target molecules in kidney renal cell carcinoma via bioinformatics analysis. Gene. 2022; 816:146173. https://doi.org/10.1016/j.gene.2021.146173 [PubMed]
- 22. Guo Q, Xiao XY, Wu CY, Li D, Chen JL, Ding XC, Cheng C, Chen CR, Tong S, Wang SH. Clinical Roles of Risk Model Based on Differentially Expressed Genes in Mesenchymal Stem Cells in Prognosis and Immunity of Non-small Cell Lung Cancer. Front Genet. 2022; 13:823075. https://doi.org/10.3389/fgene.2022.823075 [PubMed]
- 23. Wang E, Li Y, Ming R, Wei J, Du P, Zhou P, Zong S, Xiao H. The Prognostic Value and Immune Landscapes of a m6A/m5C/m1A-Related LncRNAs Signature in Head and Neck Squamous Cell Carcinoma. Front Cell Dev Biol. 2021; 9:718974. https://doi.org/10.3389/fcell.2021.718974 [PubMed]