


Introduction
Osteosarcoma is an aggressive malignancy of the skeletal system [1, 2]. It develops rapidly and has a poor prognosis and is associated with high mortality rates in children and adolescents [3, 4]. The prognosis of osteosarcoma patients has greatly improved over the last few decades, due to advances in chemotherapy and surgical resection [5, 6]. However, given the lack of early screening markers, it was estimated that about 20% of osteosarcoma patients have metastases at diagnosis, especially lung metastases [7]. There was also no significant improvement in the 5-year survival rate [8, 9]. As a result, identifying potential biomarkers for osteosarcoma is of great clinical importance.
Mitochondria have a vital role in the regulation of cellular life activities in eukaryotic cells [10, 11]. Mitochondria participate in the regulation of various physiological mechanisms such as the maintenance of Ca2+ homeostasis [12], cell death [13], and cell proliferation [14]. As a key site of cellular metabolism, major biochemical reactions such as the tricarboxylic acid cycle, oxidative phosphorylation, and fatty acid oxidation occur in mitochondria [15, 16]. In addition, despite the extremely active glycolytic function of tumor cells, many of them still have functional mitochondria, and their function is closely related to the migration and invasion of tumor cells [17, 18]. In osteosarcoma cells, it has been demonstrated recently that mitochondria can regulate various death mechanisms [19, 20]. Furthermore, through influencing metabolism, mitochondria can change how an osteosarcoma behaves biologically [21, 22]. However, the specific involvement of mitochondrial-related genes (MRGs) in the development and prognosis prediction of osteosarcoma remains unknown. Therefore, elucidation of the abnormal expression mechanism of MRGs and exploration of their specific role as potential biomarkers for the effective diagnosis and prognostic evaluation of patients with osteosarcoma are of utmost importance.
A systematic study was conducted on MRGs in osteosarcoma, identifying two subtypes of patients with different prognostic features. In this study, a prognostic model was established to distinguish patients with different risks of osteosarcoma. The model demonstrated robust prognostic performance and was validated in the GSE21257 cohort. Furthermore, levels of immune infiltration in patients with osteosarcoma were assessed and their relationship to risk was explored. Malonyl-CoA decarboxylase (MLYCD) was downregulated in osteosarcoma cells compared to osteoblasts and may serve as a promising biomarker. Last, overexpression of MLYCD inhibited proliferation, migration, and invasion of the osteosarcoma cell line MG63. In conclusion, this study offers novel evidence for the exploration of prognostic biomarkers and therapeutic targets for osteosarcoma.
Materials and Methods
Data acquisition and preprocessing
The study’s summary is presented in Figure 1. From the TARGET database, osteosarcoma samples with clinical information and transcriptome data were obtained (https://ocg.cancer.gov/programs/target). Sequencing data and clinical information were complete in 84 cases. Using the GTEx database, we obtained gene expression data for musculoskeletal tissues (http://www.gtexportal.org), comprising a total of 396 healthy individuals. Prior to analysis, log-transformation of FPKM (fragments per kilobase of transcript per million mapped reads) transcriptome data and conversion to transcripts per million (TPM). A total of 1,136 mitochondrial-localized genes (Supplementary Table 1) were obtained from MitoCarta 3.0 (https://www.broadinstitute.org/mitocarta/), based on subcellular localization [23]. From the GEO database, we downloaded the GSE21257 dataset, which contained 53 osteosarcoma patients (https://www.ncbi.nlm.nih.gov/geo/). The GSE225588 dataset comprises six adjacent normal tissues and six osteosarcoma tissues, and GSE99671 dataset comprises eighteen adjacent normal tissues and eighteen osteosarcoma tissues.
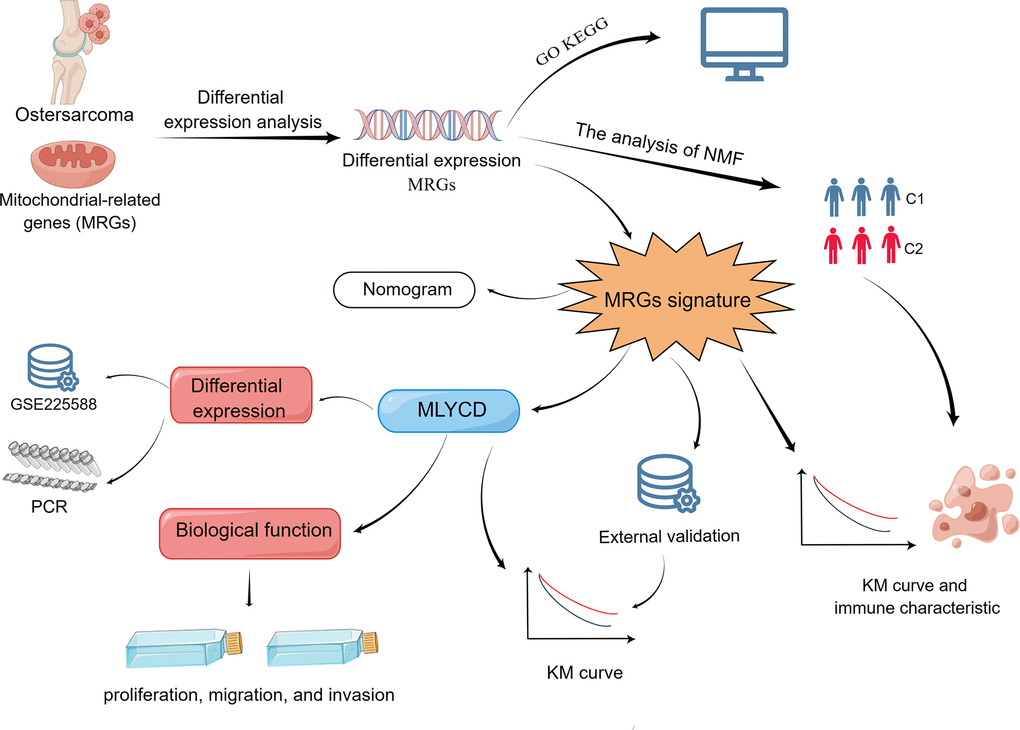
Figure 1. Flow chart of the program process.
Biological functions and protein-protein interaction (PPI) networks
The GTEx gene expression dataset was merged with the TARGET gene expression dataset. “VennDiagram” package was used to identify MRGs from the three gene groups TARGET, GSE21257, and GTEX. Cut-off values for screening differentially expressed MRGs in osteosarcoma patients were set as expression >0.5, log2 FC>1, and adjusted P<0.05. Gene Ontology (GO) analysis was used to explore the biological function, pathway, or cellular localization of the enrichment. Kyoto Encyclopedia of Genes and Genomes (KEGG) was used to explore the enrichment pathways. Interactions between differentially expressed MRGs were analyzed by the STRING online tool (http://www.string-db.org/). Cytoscape software (version 3.7.2) was used for the construction and visualization of PPI networks.
The clustering analysis
The subtypes based on MRGs in the osteosarcoma were determined using the non-negative matrix factorization (NMF) algorithm, through the “NMF” R package. The NMF algorithm is an effective method in bioinformatics to reduce the dimensionality of data such as gene expression microarrays. Clustering k-values ranging from 2 to 10 were tested, with the optimal k-value determined to be 2 based on the affinity coefficient. The levels of immune infiltration between clusters were compared using the MCPcounter algorithm.
Development of the prognostic signature
A univariate Cox regression analysis was performed utilizing the “survival” R package, considering a significance level of p<0.05 to determine the prognostic relevance of 92 MRGs. The “glmnet” R package was employed to conduct 1000 iterations of LASSO analysis. Finally, through multivariate regression analysis, the key prognostic genes were determined and acquisition of risk coefficients for each gene were accomplished. Based on gene expression, a risk score equation was constructed as shown:
The Coefi denotes the risk coefficients, and xi denotes the MRG expression value.
Evaluation and validation of prognostic signature
Patients with osteosarcoma were subjected to risk score calculation, and subsequently sorted by ascending order. Based on the median, the patients were then categorized into low and high-risk groups. The analysis of prognosis disparity between the two groups was conducted, and time-related ROC curves were plotted using the “timeROC” R package. Univariate and multivariate Cox regression analyses were used to explore independent prognostic factors in clinical characteristics. By using the “rms” package, a nomogram was established, and calibration curves was used to compare actual and predicted results.
Immune infiltration analysis
The relative levels of immune infiltration were estimated by utilizing the single-sample Gene Set Enrichment Analysis (ssGSEA). Enrichment scores derived from ssGSEA were then used to represent the relative abundance of each leukocyte subpopulation, which was normalized to a unit distribution ranging from 0 to 1. The biological similarity of infiltrating immune cells was estimated via the application of multidimensional scaling and a Gaussian fitting model.
Cell culture
Two osteosarcoma cell lines (143B and MG63) and osteoblasts (hFOB 1.19) were obtained from the Cell Bank of the Chinese Academy of Sciences (Shanghai, China). Cells were cultured accordingly in DMEM (Procell, China) supplemented with 1% penicillin–streptomycin solution (Biosharp, China) and10% fetal bovine serum (FBS, Gibco, USA). A 37° C and 5% CO2 environment was used for osteosarcoma cells, and 34° C and 5% CO2 environment for osteoblasts. Trypsin-EDTA (Gibco, USA) was used to digest the cells.
Extraction of RNA and RT-qPCR
Triazole treatment was applied to the cells, followed by extraction of total RNA and subsequent generation of cDNA through reverse transcription. Using qPCR kits and GAPDH as an internal reference, MLYCD expression was detected and quantified using relative qPCR. The primers used for MLYCD were those previously reported by Chen et al. [24]. The specific sequences are shown in Supplementary Table 2.
Lentivirus infection
The ability of the stable transfection strain to elevate MLYCD levels was measured in the MG63 cell line and compared to a negative control lentivirus. The stable transfectants were selected with puromycin (1.0μg/mL), and the overexpression of MLYCD was confirmed by Western blot.
Western blotting
Protein extraction from cells was performed using RIPA lysis buffer, followed by quantification using the BCA method. Subsequently, the protein samples were then separated by 10% SDS-PAGE gel electrophoresis and transferred onto a PVDF membrane. Blocking was performed with 5% skim milk, followed by incubation with anti-MLYCD (Proteintech: 15265-1-AP) antibody at 4° C overnight. To remove unbound antibodies, the membranes underwent three 10-min washes with TBST solution. Next, the second antibody was incubated for 2 h at room temperature. Finally, the expression of MLYCD was observed.
CCK-8 and colony formation assays
A CCK-8 and colony formation assay were used to evaluate osteosarcoma cell proliferation. A total of 2000 cells with 100 μL medium were seeded in 96-well dishes. At the times indicated, each well was incubated for 2.5 hours at 37° C with 10 ul of CCK-8 solution. The absorbance of each well was measured at 450 nm. Regarding the clone formation assay, 1000 transfected cells were cultivated in 6-well culture dishes, and subsequent to a 14-day incubation period, the cells were fixed and stained.
Cell migration and invasion assays
Transwell assays and wound healing assays were used to assess osteosarcoma cell migration and invasion. For the wound healing assay, approximately 95% confluence was reached after osteosarcoma cells were seeded onto a 6-well plate. The cell bed was scratch wounded with a 100-ul tip, after which the cells were cultured in serum-free medium. Intercellular spaces were observed and photographed with an inverted microscope within 0 and 24 h. For transwell experiments, osteosarcoma cells were seeded into the upper cell compartment, and 600 μL of medium containing 10% FBS was added to the lower cell compartment. The cells were fixed and stained 24 hours after incubation.
Clinical specimens
Three samples of osteosarcoma and three samples of adjacent healthy tissues were collected.
Immunohistochemical staining
The levels of MLYCD were assessed using immunohistochemistry in accordance with established protocols. The tissue sections of osteosarcoma underwent staining using a primary antibody, namely rabbit anti-MLYCD antibody (Proteintech, 15265-1-AP, diluted at a ratio of 1:200), after which the application of goat anti-rabbit IgG antibody.
Statistical analysis
Data were analyzed using SPSS Statistics 22.0 and R software (v4.2.0). Students’ t-test was used to compare the differences between the two groups. A significance level of P<0.05 was used to determine whether the differences were statistically significant.
Data availability
The datasets supporting the conclusions of this article are available in the TARGET-OS (https://ocg.cancer.gov/programs/target), the Gene Expression Omnibus (https://www.ncbi.nlm.nih.gov/geo/), the TCGA database (https://portal.gdc.cancer.gov/).
Results
Identification and evaluation of subgroups
We considered the intersection of MRGs with the three datasets, and the Venn diagram showed that 804 MRGs were present in all three datasets (Supplementary Figure 1). After merging TARGET and GTEx and post-transforming them with TPM, a total of 111 MRGs were identified by differential analysis. To filter out low-expressed genes, we selected MRGs with expression greater than 0.5 in the osteosarcoma, and a total of 92 MRGs were selected and visualized using heatmaps (Figure 2A). The GO analysis showed 92 MRGs were mainly enriched in mitochondrial metabolic process (Supplementary Figure 2). The KEGG results showed that these MRGs were mainly enriched in oxidative phosphorylation (Supplementary Figure 3). Additionally, we conducted a PPI analysis; the larger the node, the darker the color, and the more interacting proteins. A significant role was played by MLYCD in the PPI network (Supplementary Figure 4).
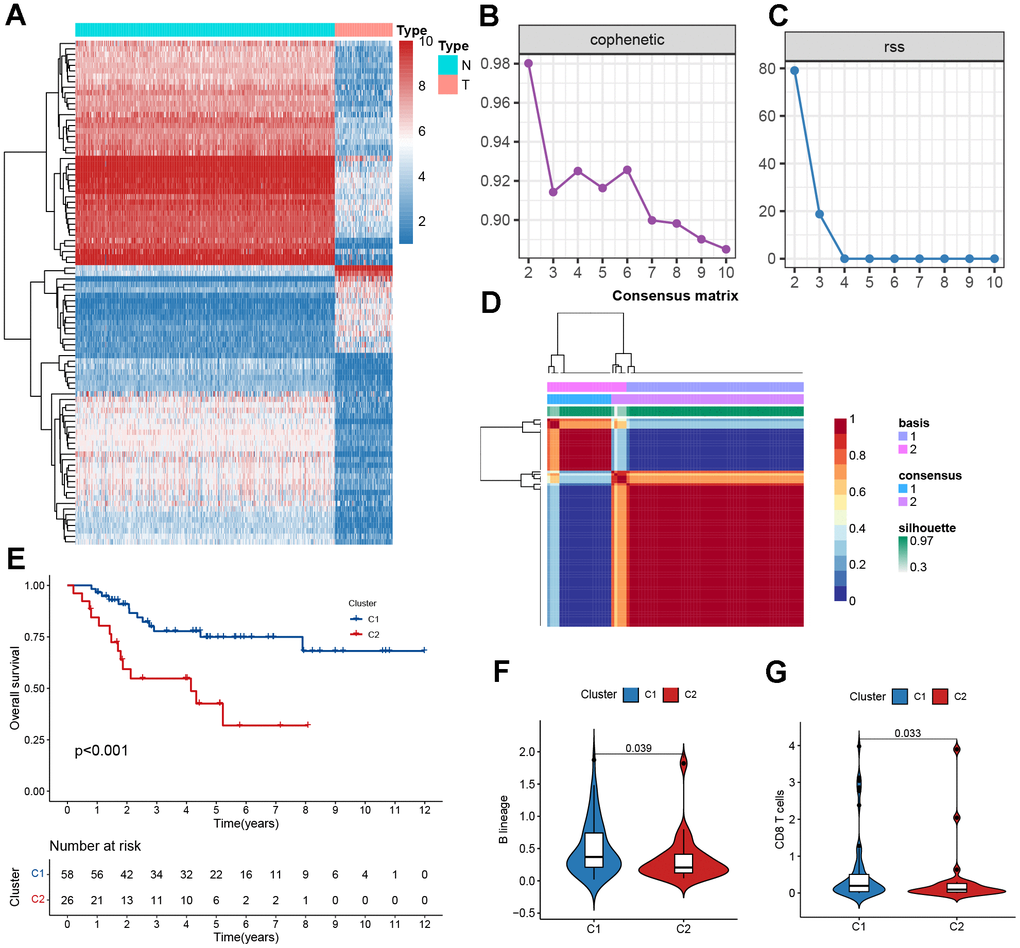
Figure 2. Clustering based on NMF. (A) The heatmaps of differentially expressed mitochondrial genes. (B) The cophenetic correlation coefficient is used to reflect the stability of the cluster obtained from NMF. (C) RSS is used to reflect the clustering performance of the model. (D) Consensus map clustered via the NMF algorithm. (E) Kaplan–Meier curve analysis for the two subtypes. (F, G) Immune scores of cells of the tumor microenvironment (TME) showing significant differences.
To determine the molecular subtypes of patients with osteosarcoma, the following studies were performed. First, 92 differentially expressed MRGs matrices were constructed. Second, 84 samples from the TARGET cohort were included in the NMF analysis, and C1 and C2 were formed based on covariance and RSS when k=2 (Figure 2B–2D). We further evaluated the difference in survival between the two subtypes and found that the C1 subtype had a better survival rate than the C2 subtype (Figure 1E, P<0.001). The C2 subtype exhibited low levels of immune infiltration, with significant differences in B lineage and CD8 T cells, which was consistent with the concept of immune response inhibition in cancer (Figure 2F, 2G). In Sankey’s study, it was found that patients with the C1 subtype had a better prognosis (Supplementary Figure 5).
Construction of prognostic signature
For the purpose of determining prognostic risk models, 92 MRGs were analyzed. First, 12 prognosis-related MRGs were identified using univariate regression analysis (Figure 3A). Next, LASSO regression analysis was performed on the 12 MRGs to obtain 11 genes (Figure 3B, 3C). Finally, the modeling parameters and six model genes (EPHX2, NUDT13, MLYCD, ALDH1L2, ABCB6, COX6A2) were obtained using multivariate regression analysis. Upon visualizing the parameters of the model genes and their coefficients, it was observed that only MLYCD exhibited a negative correlation with the risk feature, whereas the other five genes exhibited a positive correlation with the risk feature (Figure 3D). We also performed correlation analysis and visualized the model genes (Figure 3E).
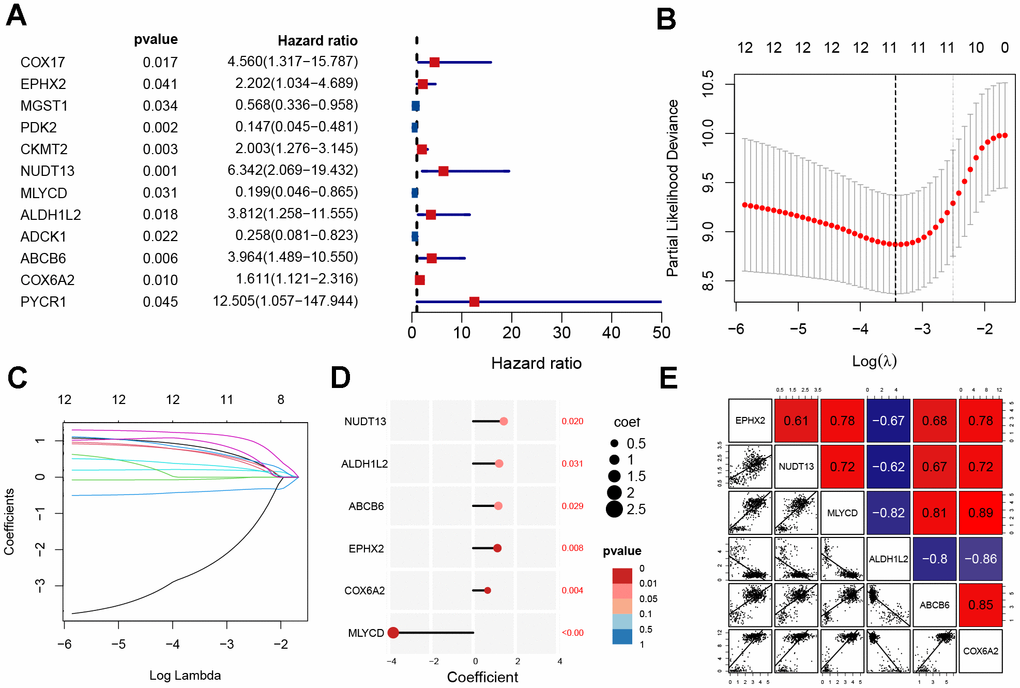
Figure 3. Construction of mitochondrial-related gene signature. (A) Univariate analysis of potential prognostic factors. (B, C) Lasso regression for MRGs in univariate Cox regression. (D) The coefficients and P-value of the six MRGs. (E) Correlation diagram of six gene expression levels.
Evaluation of the prognostic signature
Osteosarcoma samples were divided into high-risk score and low-risk score groups according to the score medians, and survival curves were plotted using the Kaplan–Meier (KM) curve. The low-risk group had a significantly better prognosis than the high-risk group (Figure 4A, P<0.001). ROC analysis showed that the area under the curve (AUC) of the model was >0.77 at 1, 3, and 5 years (Figure 4B). Additionally, the distribution of risk scores and survival status revealed a higher risk score was associated with a higher probability of death. (Figure 4C). We performed principal component analysis (PCA) to demonstrate the predictive power of our model, which indicated significant differences in patient distribution (Supplementary Figure 6). We also performed survival analysis for each model gene and found that NUDT13, MLYCD, ALDH1L2, ABCB6, and COX6A2 were associated with patient prognosis (Figure 4D–4I). In addition, MLYCD was shown to be the sole protective factor (P=0.004).
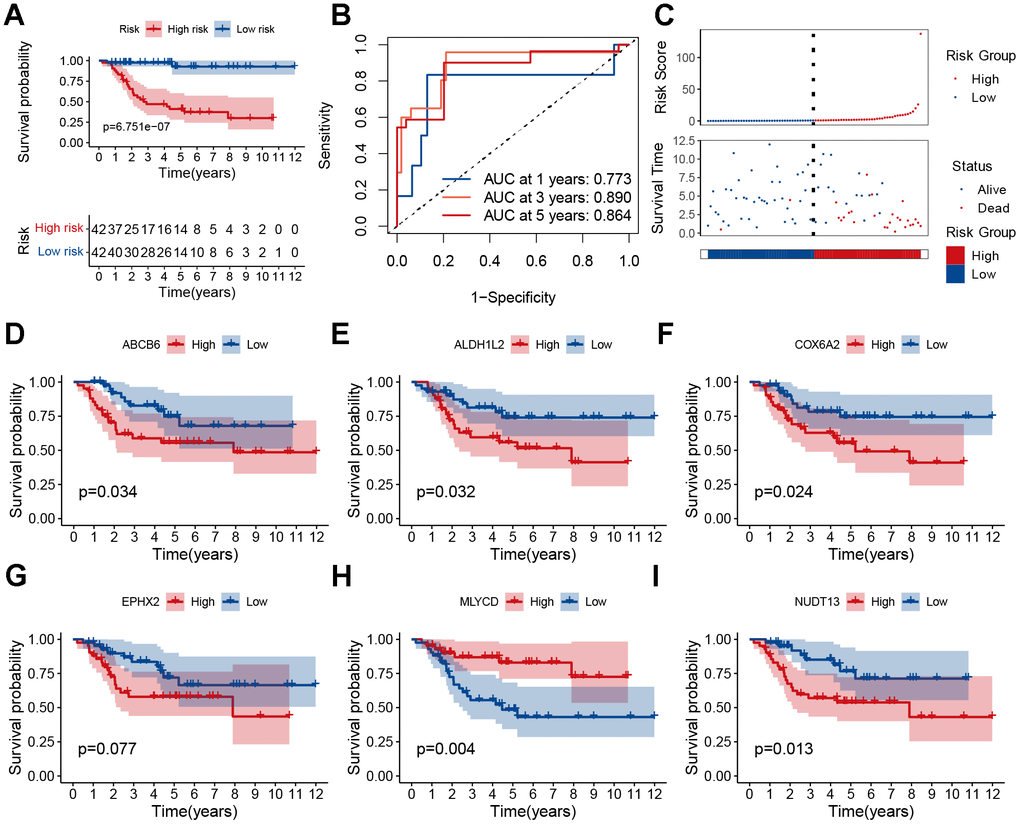
Figure 4. Prognostic analysis of the MRGs signature. (A) Kaplan–Meier survival curve analysis of patients in the high-risk group and low-risk group. (B) The AUC of time-dependent ROC curves. (C) The distributions of survival status and risk score. (D–I) Kaplan–Meier survival analysis of single genes in the TARGET cohort.
Verification of the prognostic signature
To demonstrate the predictive power of our established model, the GSE2125 cohort was used as a test set for validation. It was also significant that the low-risk group had a better prognosis than the high-risk group (Figure 5A, p<0.05). As the patient’s risk increased, their mortality rate also increased (Figure 5B). The AUC for overall survival at 1, 3, and 5 years was greater than 0.66 (Figure 5C). PCA analysis showed that the model could well differentiate between high- and low-risk patients (Figure 5D). According to the single gene survival analysis, the GSE21257 cohort had similar results (Supplementary Figure 7). In summary, our model also had good predictive power in the external dataset GSE21257.
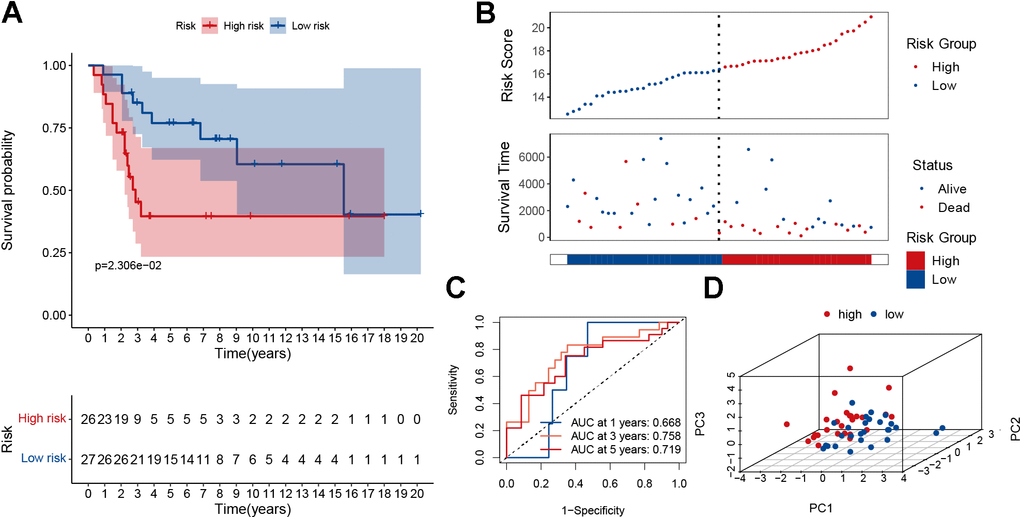
Figure 5. Validation of the MRGs signature in the GSE21257 dataset. (A) Kaplan–Meier survival curve analysis of patients in the high-risk group and low-risk group. (B) The distributions of survival status and risk score. (C) The AUC of time-dependent ROC curves. (D) PCA plot based on the MRGs signature.
Independent prognosis and clinical relevance
Univariate Cox analyses were performed for the TARGET cohort after integrating the risk scores and clinical information. The risk score was a significant predictor of osteosarcoma, as shown in Figure 6A. Multivariate Cox analysis indicated that poor prognosis was significantly associated with risk score (Figure 6B). The AUC of the risk score was 0.770 (Figure 6C). This indicates that our risk model was capable of effectively predicting patient prognosis. After that, we plotted a heatmap of model genes versus clinical traits to roughly demonstrate the relationship between genes and clinical traits (Figure 6D). The MLYCD expression levels were negatively correlated with risk scores, suggesting that MLYCD may act as a protective factor; however, ABCB6 was positively correlated with the risk score. Box plots showing the relationship between clinical and risk scores (including metastasis, sex, and age) revealed that age and sex did not differ between subgroups (Figure 6E–6J).
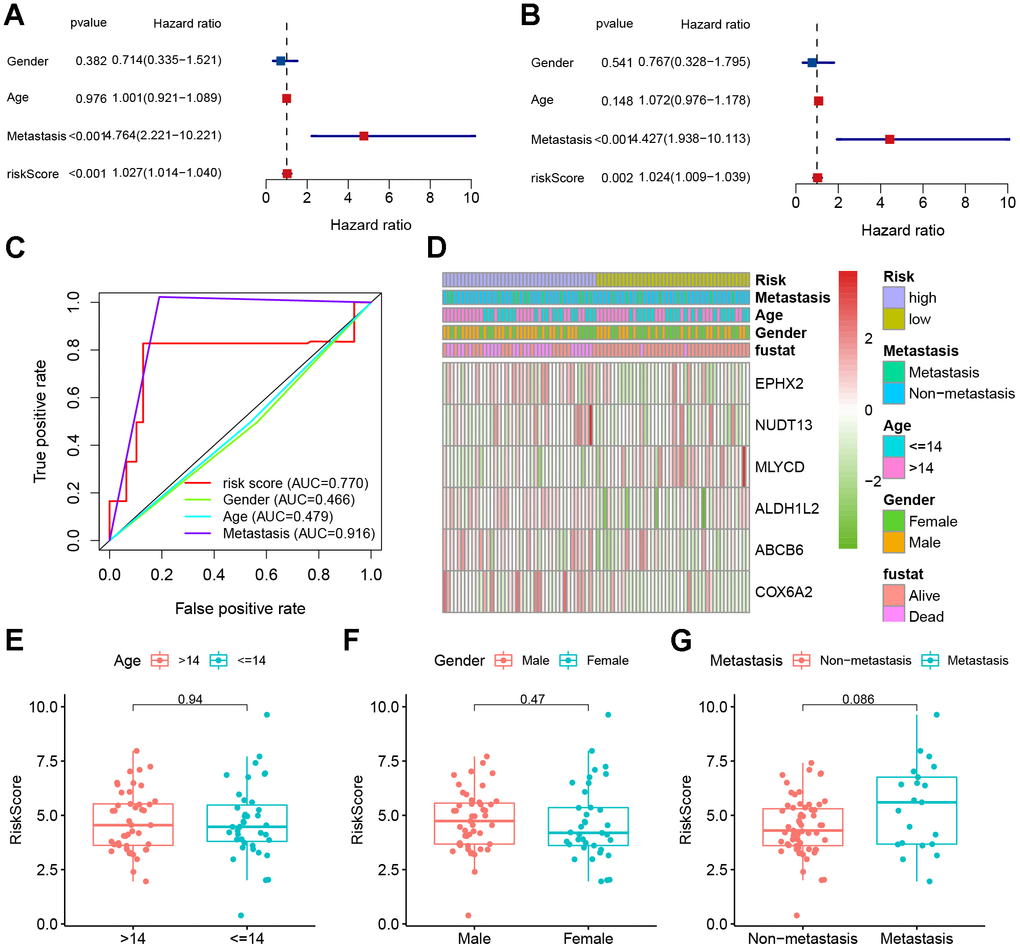
Figure 6. Clinical correlation analyses. (A) Univariate Cox analysis. (B) Multivariate Cox analysis. (C) AUC value predicts clinical characteristics and risk score. (D) Heatmap and the clinical characteristics of the two groups. (E–G) Relationship between risk score and clinical pathological factors.
Clinical nomogram and immune characteristics
To predict the risk of osteosarcoma in patients and understand the relationships between variables, a nomogram was constructed. The results showed that our constructed risk model contributed the most to predicting the outcome (Figure 7A). In addition, prediction accuracy of the columnar graph was evaluated using the C-index. The column line graph showed an ideal predictive ability for the 1-, 3-, and 5-years’ survival probability of patients (Figure 7B, 7C and Supplementary Figure 8). Using the TARGET dataset, an ssGSEA was conducted to evaluate immune cell infiltration levels. Immune cell infiltration and related functions in the high-risk group showed a downward trend (Figure 7D). To investigate the relationship between six genes (EPHX2, NUDT13, MLYCD, ALDH1L2, ABCB6, COX6A2) and immune infiltration, correlation plots were generated. Positive correlations were found between immune infiltration and MLYCD expression (Figure 7E). There was evidence to show that low-risk patients may experience higher levels of immune cell infiltration.
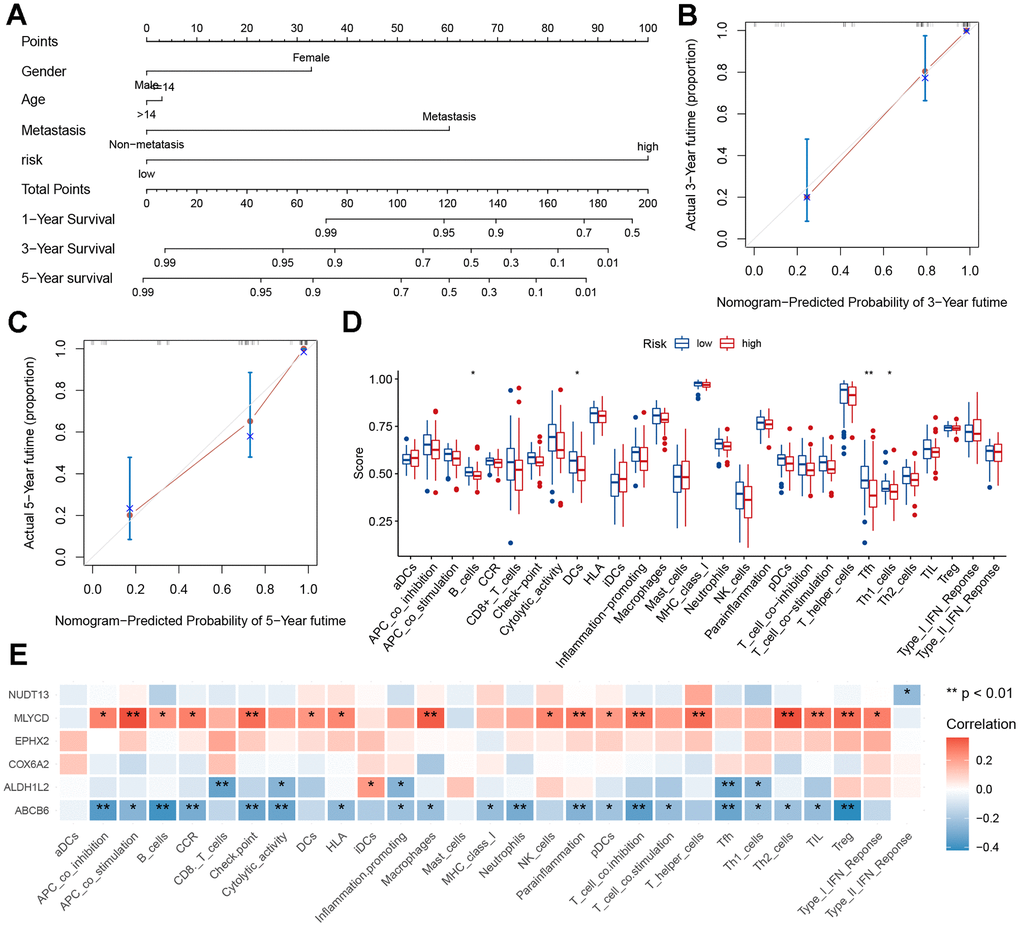
Figure 7. Nomogram and immune signature of the risk model. (A) Nomogram based on risk score, age, sex, and metastasis for predicting the 1-, 3-, and 5-year death rate. (B, C) Calibration plots of the nomogram for predicting the 3- and 5-year’ survival of osteosarcoma. (D) Relationship between risk score and immune cell infiltration and related functions via ssGSEA analysis. (E) Relationship between MRGs signature and immune cell infiltration and related functions via ssGSEA analysis.
MLYCD is lowly expressed in osteosarcoma
Only MLYCD was identified as a protective gene (Figure 3D), so further experiments on this gene were performed. First, its expression was verified using the GEO dataset, and both GSE225588 and GSE99671 showed that MLYCD was lowly expressed in osteosarcoma tissues (Figure 8A, 8B). Next, the expression level of MLYCD gene in osteosarcoma cell lines (MG63 and 143B) and osteoblasts (hFOB 1.19) were verified by PCR (Figure 8C) and western blotting (Figure 8D, 8E). The expression level of MLYCD in osteosarcoma cells was lower than osteoblasts. Finally, by IHC staining of three pairs of osteosarcoma tissues and adjacent tissues, MLYCD was found to be lowly expressed in in osteosarcoma tissues (Figure 8F). All of the above results suggested that MLYCD was lowly expressed in osteosarcoma tissues.
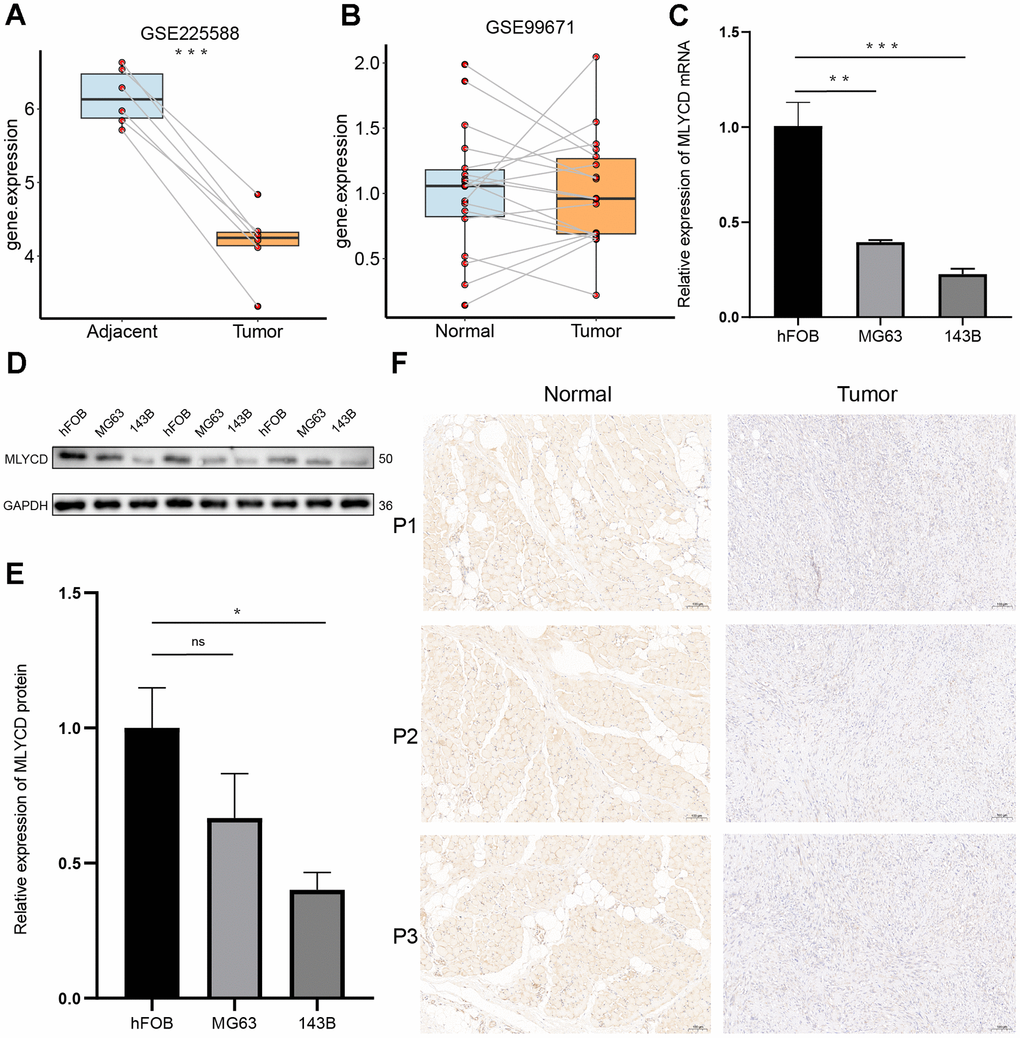
Figure 8. The expression levels of MLYCD. (A, B) The MLYCD expression level in osteosarcoma and adjacent paired samples, based on the GSE99671 and GSE225588 cohort. (C) The qRT-PCR result of MLYCD in hFOB 1.19, 143B, MG63 cell lines. (D, E) The western blotting result of MLYCD in hFOB 1.19, 143B, MG63 cell lines. (F) The expressions of MLYCD in tumor and adjacent normal tissues. *P<0.05, **P<0.01 and ***P<0.001.
MLYCD suppressed osteosarcoma cell proliferation, migration, and invasion
To further investigate the role of MLYCD in osteosarcoma, overexpression of MLYCD in the MG63 cell line. Western blot confirmed the up-regulated expression of MLYCD in MG63 cells by lentiviral transduction (Figure 9A). CCK8 and plate colony formation assay showed that MLYCD overexpression led to decreased MG63 cell proliferation (Figure 9B–9D). In wound healing assays, MLYCD overexpression significantly suppressed MG63 cell migration (Figure 9E, 9F). In addition, transwell assays showed that MLYCD overexpression significantly reduced MG63 cell migration and invasion (Figure 9G–9J). In this study, the upregulation of MLYCD inhibits MG63 cell proliferation, migration, and invasion.
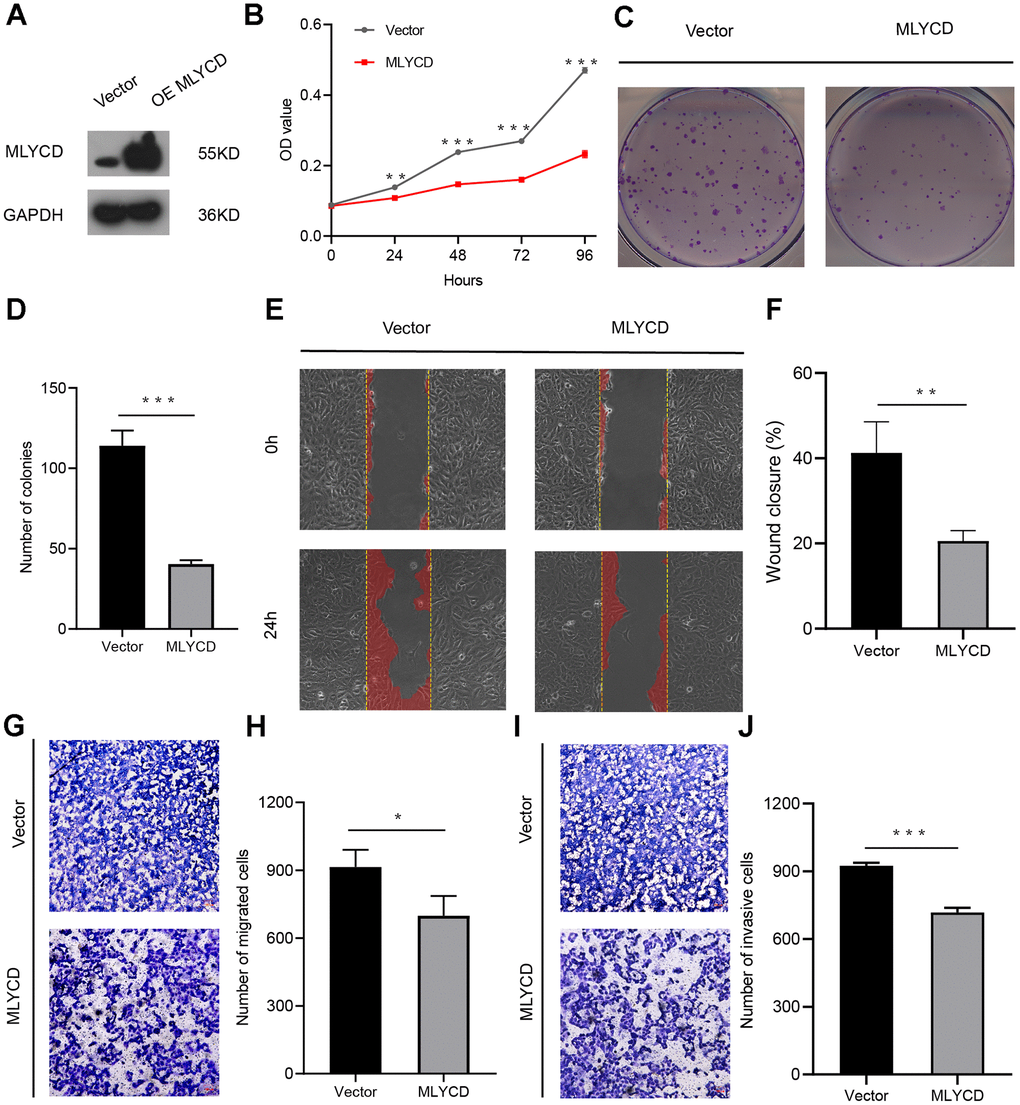
Figure 9. The effect of MLYCD on osteosarcoma cell proliferation, migration, and invasion. (A) Protein expression levels of MLYCD were measured by western blotting. (B–D) CCK-8 and colony-formation assays were used to assess osteosarcoma cell proliferation. (E, F) The wound healing assay was performed to estimate the effect of MLYCD overexpression on cell migration. (G–J) The transwell assay was conducted to assess the effect of MLYCD overexpression on osteosarcoma cell invasion and migration. Scale bar = 100um. *P<0.05, **P<0.01, and ***P<0.001.
Discussion
Osteosarcoma is the most common primary malignant bone tumor worldwide, and it primarily affects children and young adults [25, 26]. Despite progress in surgical and comprehensive treatment strategies, prognostic markers and effective targeted therapies are still lacking [27–30]. Mitochondria are central nodes of cellular metabolism and fate determination [31]. Mitochondria are important bioenergetic organelles that produce ATP to meet the energy needs of cells. In addition, they are essential for the regulation of Ca2+ homeostasis and signaling [32], redox homeostasis [33], and for determining cell survival or death [34]. In osteosarcoma, synthesizing and catabolizing reactions provide cancer cells with the ability to cope with the demands of proliferation and adapt to unfavorable survival conditions. Therefore, identifying MRGs may help discover new therapeutic targets and improve patient survival.
In this study, we utilized the NMF algorithm to perform cohesive clustering on patients with osteosarcoma, identifying two distinct groups with different prognosis.
Subsequently, we constructed a robust prognostic model whose accurate predictive ability was validated using an external validation set. Additionally, we discovered that MLYCD serves as a protective factor in the model. The study demonstrated that MRGs can serve as independent predictors of osteosarcoma. A line chart was constructed using age, sex, signature, and metastasis to display good predictability of the 1-, 3-, and 5-year survival rates, which may help promote individualized treatment for osteosarcoma patients. Additionally, we found that high-risk groups exhibit a low degree of immune infiltration. Furthermore, we identified a potential therapeutic target, MLYCD, which is positively correlated with immune cells.
Various prognostic models associated with mitochondria have been developed. For example, Li et al. (2022) analyzed RNAseq data from 594 patients with Lung adenocarcinoma from TCGA and obtained a 6-gene signature with predictive prognostic value [35]. Jiang et al. (2021) also proposed a 16-gene prognostic marker as a potential survival predictive marker [36]. However, the results of these studies have not been validated in experiments. In addition, Zhang et al. (2022) established a 16-mitochondrial gene signature in osteosarcoma [37]. In this study, the TARGET tumor dataset and the normal tissue GTEx dataset were combined to develop a prognostic model for osteosarcoma osteosarcoma-related markers. The model was validated using an independent database and its reliability was verified in experiments.
MLYCD is a type of enzyme called propionyl-CoA carboxylase, which can catalyze the breakdown of propionyl-CoA into acetyl-CoA and carbon dioxide, providing a metabolic pathway for propionyl-CoA in mitochondria and peroxisomes. Mutations in the MLYCD gene can lead to a deficiency in propionyl-CoA carboxylase, a rare inherited metabolic disorder that presents as metabolic acidosis, hypoglycemia, and/or cardiomyopathy [38–40]. Currently, there is limited research on the role of MLYCD in cancers. Yizhak et al. found that silencing the MLYCD gene with small interfering RNA (siRNA) significantly inhibited the proliferation of RPMI-8226 and K562 [41], but MLYCD was not been studied in osteosarcoma at the time. Our KM survival curves showed that MLYCD was a good prognostic indicator and that its expression level was positively correlated with immune cells. Therefore, we investigated whether MLYCD was downregulated in osteosarcoma cells and found that overexpression of MLYCD significantly suppressed osteosarcoma cell proliferation, migration, and invasion. According to these findings, MLYCD may be a potentially useful therapeutic target.
The main limitation of our study was the small number of tumor samples. In future research, we plan to apply a larger sample size to build a more accurate prediction model. In addition, the mechanism of action of MLYCD on osteosarcoma progression needs further to be investigated by further molecular biology experiments.
Conclusions
In summary, we identify molecular subtypes of osteosarcoma and establish prognostic models based on MRGs. The model showed good predictive performance in training and independent testing. We also confirmed the cancer suppressive function of MLYCD by proliferation and migration related experiments. The results of this study suggest that our signature may be used to evaluate the prognosis and provide a potential target for the treatment of osteosarcoma.
Author Contributions
XZ contributed to data analysis, methodology, number construction, and article writing. XC contributed to investigation and validation. JZ, QC, CC, JY, XM, and TW contributed to methodology and validation. All authors contributed to the article and approved the submitted version.
Conflicts of Interest
No potential conflicts of interest were disclosed.
Ethical Statement and Consent
The study collected samples from individuals diagnosed with osteosarcoma at the Second Affiliated Hospital of Nanchang University. The research received ethical approval from the Hospital Research Ethics Committee, and all participants gave informed permission.
Funding
This work was supported by the National Natural Science Foundation of China (no. 82060403), the Thousand Talents Program of Jiangxi Province (no. JXSQ2019201026), and the Natural Science Foundation of Jiangxi Province of China (no. 20202ACBL206012).
References
- 1. Fan TM, Roberts RD, Lizardo MM. Understanding and Modeling Metastasis Biology to Improve Therapeutic Strategies for Combating Osteosarcoma Progression. Front Oncol. 2020; 10:13. https://doi.org/10.3389/fonc.2020.00013 [PubMed]
- 2. Rubio R, Abarrategi A, Garcia-Castro J, Martinez-Cruzado L, Suarez C, Tornin J, Santos L, Astudillo A, Colmenero I, Mulero F, Rosu-Myles M, Menendez P, Rodriguez R. Bone environment is essential for osteosarcoma development from transformed mesenchymal stem cells. Stem Cells. 2014; 32:1136–48. https://doi.org/10.1002/stem.1647 [PubMed]
- 3. Ottaviani G, Jaffe N. The epidemiology of osteosarcoma. Cancer Treat Res. 2009; 152:3–13. https://doi.org/10.1007/978-1-4419-0284-9_1 [PubMed]
- 4. Moore DD, Luu HH. Osteosarcoma. Cancer Treat Res. 2014; 162:65–92. https://doi.org/10.1007/978-3-319-07323-1_4 [PubMed]
- 5. Simpson E, Brown HL. Understanding osteosarcomas. JAAPA. 2018; 31:15–9. https://doi.org/10.1097/01.JAA.0000541477.24116.8d [PubMed]
- 6. Jones KB, Ferguson PC, Lam B, Biau DJ, Hopyan S, Deheshi B, Griffin AM, White LM, Wunder JS. Effects of neoadjuvant chemotherapy on image-directed planning of surgical resection for distal femoral osteosarcoma. J Bone Joint Surg Am. 2012; 94:1399–405. https://doi.org/10.2106/JBJS.K.00971 [PubMed]
- 7. Martin JW, Squire JA, Zielenska M. The genetics of osteosarcoma. Sarcoma. 2012; 2012:627254. https://doi.org/10.1155/2012/627254 [PubMed]
- 8. Bacci G, Ruggieri P, Bertoni F, Ferrari S, Longhi A, Biagini R, Zavatta M, Versari M, Forni C. Local and systemic control for osteosarcoma of the extremity treated with neoadjuvant chemotherapy and limb salvage surgery: the Rizzoli experience. Oncol Rep. 2000; 7:1129–33. https://doi.org/10.3892/or.7.5.1129 [PubMed]
- 9. Harris MA, Hawkins CJ. Recent and Ongoing Research into Metastatic Osteosarcoma Treatments. Int J Mol Sci. 2022; 23:3817. https://doi.org/10.3390/ijms23073817 [PubMed]
- 10. O’Neill LA, Pearce EJ. Immunometabolism governs dendritic cell and macrophage function. J Exp Med. 2016; 213:15–23. https://doi.org/10.1084/jem.20151570 [PubMed]
- 11. Cottet-Rousselle C, Ronot X, Leverve X, Mayol JF. Cytometric assessment of mitochondria using fluorescent probes. Cytometry A. 2011; 79:405–25. https://doi.org/10.1002/cyto.a.21061 [PubMed]
- 12. Wang K, Xu Y, Sun Q, Long J, Liu J, Ding J. Mitochondria regulate cardiac contraction through ATP-dependent and independent mechanisms. Free Radic Res. 2018; 52:1256–65. https://doi.org/10.1080/10715762.2018.1453137 [PubMed]
- 13. Kourtis N, Tavernarakis N. Autophagy and cell death in model organisms. Cell Death Differ. 2009; 16:21–30. https://doi.org/10.1038/cdd.2008.120 [PubMed]
- 14. Roderick HL, Cook SJ. Ca2+ signalling checkpoints in cancer: remodelling Ca2+ for cancer cell proliferation and survival. Nat Rev Cancer. 2008; 8:361–75. https://doi.org/10.1038/nrc2374 [PubMed]
- 15. Aguilar-López BA, Moreno-Altamirano MMB, Dockrell HM, Duchen MR, Sánchez-García FJ. Mitochondria: An Integrative Hub Coordinating Circadian Rhythms, Metabolism, the Microbiome, and Immunity. Front Cell Dev Biol. 2020; 8:51. https://doi.org/10.3389/fcell.2020.00051 [PubMed]
- 16. Weinberg SE, Chandel NS. Targeting mitochondria metabolism for cancer therapy. Nat Chem Biol. 2015; 11:9–15. https://doi.org/10.1038/nchembio.1712 [PubMed]
- 17. Warburg O. On the origin of cancer cells. Science. 1956; 123:309–14. https://doi.org/10.1126/science.123.3191.309 [PubMed]
- 18. Reinfeld BI, Rathmell WK, Kim TK, Rathmell JC. The therapeutic implications of immunosuppressive tumor aerobic glycolysis. Cell Mol Immunol. 2022; 19:46–58. https://doi.org/10.1038/s41423-021-00727-3 [PubMed]
- 19. Liu X, Du S, Wang S, Ye K. Ferroptosis in osteosarcoma: A promising future. Front Oncol. 2022; 12:1031779. https://doi.org/10.3389/fonc.2022.1031779 [PubMed]
- 20. Lai HT, Naumova N, Marchais A, Gaspar N, Geoerger B, Brenner C. Insight into the interplay between mitochondria-regulated cell death and energetic metabolism in osteosarcoma. Front Cell Dev Biol. 2022; 10:948097. https://doi.org/10.3389/fcell.2022.948097 [PubMed]
- 21. Ying H, Li ZQ, Li MP, Liu WC. Metabolism and senescence in the immune microenvironment of osteosarcoma: focus on new therapeutic strategies. Front Endocrinol (Lausanne). 2023; 14:1217669. https://doi.org/10.3389/fendo.2023.1217669 [PubMed]
- 22. Ma X, Zhao J, Feng H. Targeting iron metabolism in osteosarcoma. Discov Oncol. 2023; 14:31. https://doi.org/10.1007/s12672-023-00637-y [PubMed]
- 23. Rath S, Sharma R, Gupta R, Ast T, Chan C, Durham TJ, Goodman RP, Grabarek Z, Haas ME, Hung WH, Joshi PR, Jourdain AA, Kim SH, et al. MitoCarta3.0: an updated mitochondrial proteome now with sub-organelle localization and pathway annotations. Nucleic Acids Res. 2021; 49:D1541–7. https://doi.org/10.1093/nar/gkaa1011 [PubMed]
- 24. Chen MC, Chang JP, Lin YS, Pan KL, Ho WC, Liu WH, Chang TH, Huang YK, Fang CY, Chen CJ. Deciphering the gene expression profile of peroxisome proliferator-activated receptor signaling pathway in the left atria of patients with mitral regurgitation. J Transl Med. 2016; 14:157. https://doi.org/10.1186/s12967-016-0871-3 [PubMed]
- 25. Gill J, Gorlick R. Advancing therapy for osteosarcoma. Nat Rev Clin Oncol. 2021; 18:609–24. https://doi.org/10.1038/s41571-021-00519-8 [PubMed]
- 26. Casali PG, Bielack S, Abecassis N, Aro HT, Bauer S, Biagini R, Bonvalot S, Boukovinas I, Bovee JV, Brennan B, Brodowicz T, Broto JM, Brugières L, et al, and ESMO Guidelines Committee, PaedCan and ERN EURACAN. Bone sarcomas: ESMO-PaedCan-EURACAN Clinical Practice Guidelines for diagnosis, treatment and follow-up. Ann Oncol. 2018 (Suppl 4); 29:iv79–95. https://doi.org/10.1093/annonc/mdy310 [PubMed]
- 27. Saraf AJ, Fenger JM, Roberts RD. Osteosarcoma: Accelerating Progress Makes for a Hopeful Future. Front Oncol. 2018; 8:4. https://doi.org/10.3389/fonc.2018.00004 [PubMed]
- 28. Thanindratarn P, Dean DC, Nelson SD, Hornicek FJ, Duan Z. Advances in immune checkpoint inhibitors for bone sarcoma therapy. J Bone Oncol. 2019; 15:100221. https://doi.org/10.1016/j.jbo.2019.100221 [PubMed]
- 29. Zhai X, Xia Z, Du G, Zhang X, Xia T, Ma D, Li X, Jin B, Zhang H. LRP1B suppresses HCC progression through the NCSTN/PI3K/AKT signaling axis and affects doxorubicin resistance. Genes Dis. 2022; 10:2082–96. https://doi.org/10.1016/j.gendis.2022.10.021 [PubMed]
- 30. Li Z, Zhou H, Xia Z, Xia T, Du G, Franziska SD, Li X, Zhai X, Jin B. HMGA1 augments palbociclib efficacy via PI3K/mTOR signaling in intrahepatic cholangiocarcinoma. Biomark Res. 2023; 11:33. https://doi.org/10.1186/s40364-023-00473-w [PubMed]
- 31. Strasser A, Vaux DL. Cell Death in the Origin and Treatment of Cancer. Mol Cell. 2020; 78:1045–54. https://doi.org/10.1016/j.molcel.2020.05.014 [PubMed]
- 32. Loncke J, Kaasik A, Bezprozvanny I, Parys JB, Kerkhofs M, Bultynck G. Balancing ER-Mitochondrial Ca2+ Fluxes in Health and Disease. Trends Cell Biol. 2021; 31:598–612. https://doi.org/10.1016/j.tcb.2021.02.003 [PubMed]
- 33. Boese AC, Kang S. Mitochondrial metabolism-mediated redox regulation in cancer progression. Redox Biol. 2021; 42:101870. https://doi.org/10.1016/j.redox.2021.101870 [PubMed]
- 34. Bock FJ, Tait SWG. Mitochondria as multifaceted regulators of cell death. Nat Rev Mol Cell Biol. 2020; 21:85–100. https://doi.org/10.1038/s41580-019-0173-8 [PubMed]
- 35. Li YP, Liu GX, Wu ZL, Tu PH, Wei G, Yuan M, Zhong MH, Deng KL. A Novel Mitochondrial-Related Gene Signature for the Tumor Immune Microenvironment Evaluation and Prognosis Prediction in Lung Adenocarcinoma. J Immunol Res. 2022; 2022:5366185. https://doi.org/10.1155/2022/5366185 [PubMed]
- 36. Jiang X, Xia Y, Meng H, Liu Y, Cui J, Huang H, Yin G, Shi B. Identification of a Nuclear Mitochondrial-Related Multi-Genes Signature to Predict the Prognosis of Bladder Cancer. Front Oncol. 2021; 11:746029. https://doi.org/10.3389/fonc.2021.746029 [PubMed]
- 37. Zhang L, Wu S, Huang J, Shi Y, Yin Y, Cao X. A mitochondria-related signature for predicting immune microenvironment and therapeutic response in osteosarcoma. Front Oncol. 2022; 12:1085065. https://doi.org/10.3389/fonc.2022.1085065 [PubMed]
- 38. de Wit MC, de Coo IF, Verbeek E, Schot R, Schoonderwoerd GC, Duran M, de Klerk JB, Huijmans JG, Lequin MH, Verheijen FW, Mancini GM. Brain abnormalities in a case of malonyl-CoA decarboxylase deficiency. Mol Genet Metab. 2006; 87:102–6. https://doi.org/10.1016/j.ymgme.2005.09.009 [PubMed]
- 39. Wightman PJ, Santer R, Ribes A, Dougherty F, McGill N, Thorburn DR, FitzPatrick DR. MLYCD mutation analysis: evidence for protein mistargeting as a cause of MLYCD deficiency. Hum Mutat. 2003; 22:288–300. https://doi.org/10.1002/humu.10264 [PubMed]
- 40. Prada CE, Jefferies JL, Grenier MA, Huth CM, Page KI, Spicer RL, Towbin JA, Leslie ND. Malonyl coenzyme A decarboxylase deficiency: early dietary restriction and time course of cardiomyopathy. Pediatrics. 2012; 130:e456–60. https://doi.org/10.1542/peds.2011-2927 [PubMed]
- 41. Yizhak K, Gaude E, Le Dévédec S, Waldman YY, Stein GY, van de Water B, Frezza C, Ruppin E. Phenotype-based cell-specific metabolic modeling reveals metabolic liabilities of cancer. Elife. 2014; 3:e03641. https://doi.org/10.7554/eLife.03641 [PubMed]