


Introduction
Oral squamous cell carcinoma (OSCC) is one of the malignancies. The incidence of OSCC has remained elevated in recent years. Studies have demonstrated that some biomarkers are associated with the prognosis of OSCC patients [1–5]. However, due to the lacking specific diagnostic biomarkers and effective therapeutic targets in the early stages of OSCC patients, the prognosis remained poor. Therefore, it is critical to find new targets to improve the survival time of OSCC patients.
Ubiquitin Fold Modifier 1 (UFM1) is a ubiquitin-like protein that could be coupled to the target protein like ubiquitination through the E1-like activating enzyme UBA5 and E2-like coupling enzyme UFC1 [6]. Previous studies confirmed that the changes in UFM1 expression were related to the progression of gastric cancer (GC), hepatocellular carcinoma (HCC), and breast cancer [7–10]. For example, the levels of UFM1 were down-regulated in GC tissues. Decreased UFM1 expression was associated with 5-year survival in GC patients. Increased UFM1 expression could reduce the invasion and migration ability of GC AGS and HGC-27 cells, while downregulation of UFM1 expression could promote the invasion and migration of GC cells. UFM1 could increase the ubiquitination levels of pyruvate dehydrogenase kinase 1 (PDK1), and inhibit the expression of PDK1 protein, thereby inhibiting the phosphorylation level of AKT serine/threonine kinase 1 (AKT) at Ser473 [7]. Long strand non-coding RNA B3GALT5-AS1 expression was significantly decreased in HCC. B3GALT5-AS1 overexpression could delay the malignant features of HCC HCCLM3 cells. UFM1 overexpression could reduce the invasion and migration ability in HCC HCCLM3 cells, indicating that B3GALT5-AS1 could inhibit the HCC progression by promoting UFM1 expression [8]. Currently, the roles and mechanisms of UFM1 in OSCC have not been reported. Therefore, we aimed to identify the role of UFM1 in OSCC via data analysis and basic research and explore the relationship between the expression levels of UFM1 and the immune infiltrating cells and ubiquitination in OSCC to provide a new candidate marker for OSCC patients.
Materials and Methods
Data sources and identification of UFM1 gene expression
In August 2022, the UFM1 gene expression data of 32 normal tissues and 329 primary OSCC tissues were downloaded from the Cancer Genome Atlas (TCGA (https://www.cancer.gov/TCGA)) database, covering both data types: the reads per kilobase of transcript per million reads mapped (FPKM) and transcripts per million (TPM). The UFM1 gene expression data in normal and OSCC tissues were extracted using Perl language. Subsequently, the expression levels of UFM1 in normal and OSCC tissues were identified. In addition, the data from normal tissues and cancer tissues were matched and sorted. It was found that 32 patients had the normal tissues and matched cancer tissues. The expression levels of UFM1 in normal and cancer tissues from 32 paired cancer patients were identified.
Prognostic values of UFM1
The UFM1 gene expression data were matched to the data of overall survival (OS), disease-specific survival (DSS) and progression-free interval (PFI) of cancer patients into groups. Dichotomous grouping was performed via the UFM1 expression level, and survival analysis was used to investigate the relationship between UFM1 expression and the OS, DSS, and cancer progression in OSCC patients.
The roles of UFM1 expression in the prognosis of subgroup patients with OSCC
In the OS, DSS, and disease progression of OSCC patients, cancer patients were divided into subgroups according to the T stage, lymph node metastasis (N stage) and distant metastasis (M stage). The affiliation between UFM1 expression and OS, DSS, and disease progression in OSCC patients was identified through survival analysis.
Relationship between UFM1 expression and clinical characteristics of OSCC patients
The expression levels of UFM1 in the tissues of deceased and surviving patients were identified under OS, DSS, and disease progression in OSCC patients. UFM1 expression was used for the classification. Moreover, the chi-square test was conducted to identify the relationship between the UFM1 expression and T stage, N stage, M stage, clinical stage, radiotherapy treatment, age, gender, tissue grade, smoking history, and OS, DSS, and PFI endpoint events in OSCC patients.
Cox regression analysis and construction of nomogram
Univariate Cox regression analysis was performed on T stage (T1, T2, T3 and T4), N stage (N0, N1, N2 and N3), M stage (M0 and M1), and UFM1 (overexpression and low expression) and association among OSCC patients and OS, DSS, and disease progression. Furthermore, multivariate Cox regression analysis was executed based on P < 0.05. In addition, the prognostic nomograms of T stage, N stage, M stage and UFM1 expression and nomogram-related visualizations were constructed based multivariate Cox regression analysis by rms package in R language.
The pathways of UFM1 co-expressed genes
UFM1 co-expressed genes were obtained by correlation analysis and defined as UFM1 strongly co-expressed genes based on the absolute value of the coefficient of 0.4 and the P-value less than 0.001. KEGG analysis could explore the pathways involved in multiple genes. Therefore, we utilized KEGG analysis to analyze the signaling pathways involved in UFM1 co-expressed genes in the DAVID (https://david.ncifcrf.gov/) database [11].
Analysis of the relationship between UFM1 expression levels and immune infiltrating cells
The immune cells of OSCC tissues were scored by single sample gene set enrichment analysis (GSEA) technology, and the Pearson correlation was used to analyze the relationship between the expression levels of UFM1 and 24 types of immune cells (NK CD56bright cells, aDC, Th2 cells, DC, T cells, iDC, Tem, mast cells, TReg, B cells, NK cells, T helper cells, pDC, macrophages, Tcm, neutrophils, TFH, Tgd, CD8 T cells, Th1 cells, cytotoxic cells, Th17 cells, T helper cells, and NK CD56dim cells) levels, and the significantly correlated immune cells were obtained based on the P<0.05.
Identification of the relationship between UFM1 expression and ubiquitination
The ubiquitination was entered into on the official website of GSEA (https://www.gsea-msigdb.org/gsea/) and the histone ubiquitination gene set was selected [12]. Correlation analysis between UFM1 expression and histone ubiquitination genes PCGF3, LEO1, DTX3L, DDB1, DDB2, RNF168, RYBP, UHRF1, TRIM37, WAC, PAF1, BCOR, RNF20, ATXN7L3, RAG1, RING1, RNF2, BMI1, SKP1, UBE2E1, PCGF2, CDC73, PCGF6, PCGF5, CUL4B, KDM2B, PCGF1, CTR9, and RNF40 expression levels were conducted, and the significantly correlated ubiquitination genes were obtained based on the P<0.05.
Cell culture and transfection
OSCC cells (cal27) were donated by laboratory researchers in the Affiliated Hospital of Zunyi Medical University. The cells were cultured in DMEM medium with 10% fetal bovine serum. UFM1 expression levels were interfered with by siRNA technology, cells were in a good state of growth and culture, and the density was suitable [13]. The siRNA target sequence for UFM1 was CCTGCTGCAACAAGTGCAATT. Total RNA and proteins from the control group (NC) and UFM1 expression inhibition group (si-UFM1) were collected 24 h after transfection to verify the success of the cell model and conduct subsequent cell function studies.
Identification of UFM1 expression in the cell model
Total cell RNAs were transcribed, and the Polymerase Chain Reaction (PCR) was performed according to standard procedure [13]. UFM1 expression levels in both cell groups were then calculated via the 2−ΔΔCt formula. The PCR primers of UFM1 were: forward 5’-TCGGAAGTGCTGATGAGTT-3’ and reverse 5’-CCTCCTTAATA GAAGCCTGGT-3’. The collected proteins were subjected to BCA quantification, protein denaturation, electrophoresis, electrolysis, membrane washing, incubation of 1:1000 UFM1 antibody (Abcam, UK), secondary antibody incubation, and protein exposure.
Cell proliferation
After the transfection of cal27 cells, 96-well plates were laid, and the number of cal27 cells in each hole was 2500. Furthermore, the proliferation ability of the cal27 cells in the control group and the interfered with the UFM1 expression group was detected by using the Cell Counting Kit-8 (CCK-8) assay. After adding 10 μL CCK-8 solution to each well and incubating at 37° C and 5% CO2 for 2 h, the cell activity was detected using an enzyme marker.
Cell migration
In the control group and interfered with the UFM1 expression group, the straight line in the six-hole plate was drawn using a 200 μL gun head. The suspended cal27 cells were then washed with phosphate buffers, and then cal27 cells were fed in serum-free medium at 37° C and 5% CO2 and photographed at 0 h after the scratch. The cell migration distance was observed 24 and 48 h after the scratch, and photographs were taken when significant differences were reached. Finally, the migration distance of the two groups of cal27 cells was calculated.
Cell invasion
The transfected cal27 cells were digested and suspended in a serum-free medium. After the cell count, the concentration was adjusted to 1×10⁵/mL. Diluted Matrigel glue was evenly applied to the surface of the film. Moreover, 800 μL medium containing 10% serum was added to the lower chamber of Transwell, 200 μL cell suspension was added to the upper chamber of Transwell, and cultured in a cell culture incubator for 24 h. Cell counts were performed after cell fixation and staining.
Statistical analysis
Wilcoxon rank-sum and chi-square tests were used to assess the expression of UFM1 in OSCC tissues and to explore whether there was statistical significance between UFM1 expression and clinicopathological characteristics of cancer patients. Survival analysis was used to understand the affiliation between UFM1 overexpression and poor prognosis in OSCC patients. The role of UFM1 expression on proliferation, migration, and invasion was tested using the t-test. Correlation analysis coefficients represented gene-to-gene relationships, and UFM1 expression levels and immune cells. The significance threshold is based on P < 0.05, which was considered significant.
Availability of data and materials
The data generated during this study are available upon request from the corresponding authors.
Results
UFM1 overexpression in OSCC was associated with poor prognosis
Compared with normal tissues, the expression of UFM1 was significantly enhanced in unpaired and paired tissues (Figure 1A, 1B). Regarding the OS, DSS, and PFI endpoints, UFM1 expression levels were significantly elevated in the tissues of deceased OSCC patients (Figure 2A–2C). Survival analysis displayed that elevated UFM1 expression levels were significantly associated with poor prognostic indicators (OS, DSS, and PFI) in OSCC patients (Figure 3A–3C). Grouping by high- and low-UFM1 expression revealed that UFM1 expression was associated with the OS, DSS, and PFI in OSCC patients (Table 1).
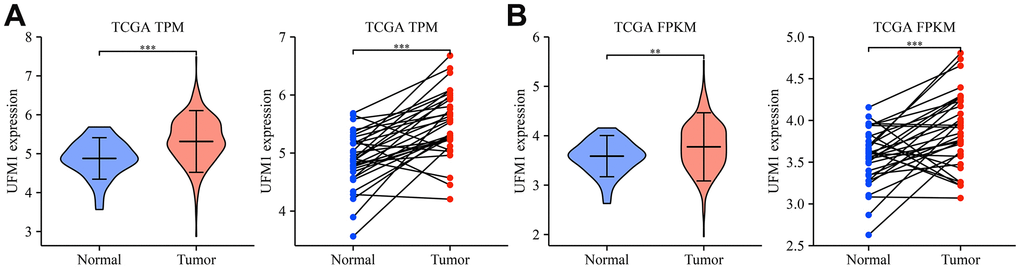
Figure 1. UFM1 expression significantly increased in OSCC tissues of the TCGA database. (A) The data of TPM type in TCGA database; (B) The data of FPKM type in TCGA database. Note: OSCC, oral squamous cell carcinoma; TCGA, The Cancer Genome Atlas; FPKM, reads per kilobase of transcript per million reads mapped; TPM, transcripts per million.
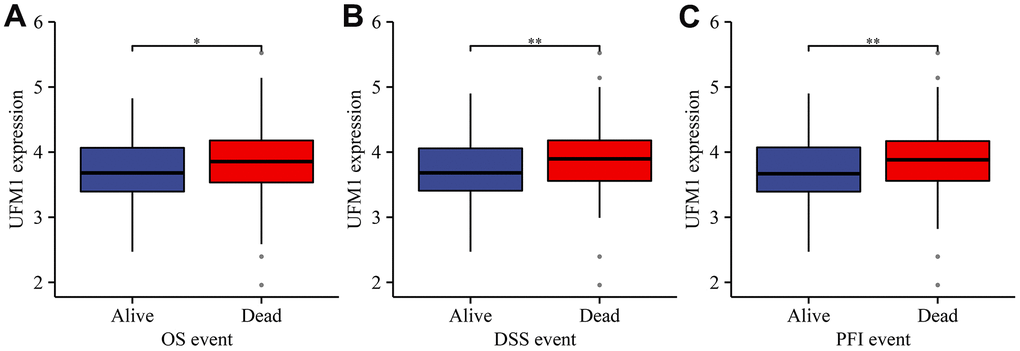
Figure 2. The relationship between UFM1 expression and dismal prognosis was explored based on the status of cancer patients in TCGA database. (A) OS; (B) DSS; (C) PFI. Note: OS, overall survival; DSS, disease-specific survival; PFI, progression-free interval.
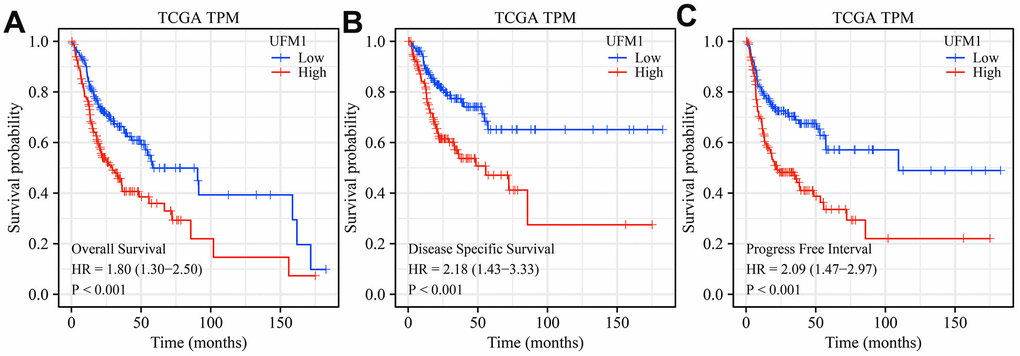
Figure 3. Elevated UFM1 expression levels associated with dismal prognosis in OSCC patients based on the data of TPM type in TCGA database. (A) OS; (B) DSS; (C) PFI. Note: OSCC, oral squamous cell carcinoma; TPM, transcripts per million; OS, overall survival; DSS, disease-specific survival; PFI, progression-free interval; TCGA, The Cancer Genome Atlas.
Table 1. The relationship between UFM1 expression and clinical characteristics of OSCC patients.
| Characteristic | Low UFM1 expression | High UFM1 expression | P | ||||||||||||||||||||||||||||||||||||||||||||||||||||||||||||||||||||||||||||||||||||||||||||||||
| N | 164 | 165 | |||||||||||||||||||||||||||||||||||||||||||||||||||||||||||||||||||||||||||||||||||||||||||||||||
| T stage | 0.174 | ||||||||||||||||||||||||||||||||||||||||||||||||||||||||||||||||||||||||||||||||||||||||||||||||||
| T1 | 11 (3.4%) | 7 (2.2%) | |||||||||||||||||||||||||||||||||||||||||||||||||||||||||||||||||||||||||||||||||||||||||||||||||
| T2 | 56 (17.6%) | 49 (15.4%) | |||||||||||||||||||||||||||||||||||||||||||||||||||||||||||||||||||||||||||||||||||||||||||||||||
| T3 | 45 (14.1%) | 37 (11.6%) | |||||||||||||||||||||||||||||||||||||||||||||||||||||||||||||||||||||||||||||||||||||||||||||||||
| T4 | 48 (15%) | 66 (20.7%) | |||||||||||||||||||||||||||||||||||||||||||||||||||||||||||||||||||||||||||||||||||||||||||||||||
| N stage | 0.930 | ||||||||||||||||||||||||||||||||||||||||||||||||||||||||||||||||||||||||||||||||||||||||||||||||||
| N0 | 86 (27.3%) | 82 (26%) | |||||||||||||||||||||||||||||||||||||||||||||||||||||||||||||||||||||||||||||||||||||||||||||||||
| N1 | 27 (8.6%) | 29 (9.2%) | |||||||||||||||||||||||||||||||||||||||||||||||||||||||||||||||||||||||||||||||||||||||||||||||||
| N2 | 43 (13.7%) | 45 (14.3%) | |||||||||||||||||||||||||||||||||||||||||||||||||||||||||||||||||||||||||||||||||||||||||||||||||
| N3 | 2 (0.6%) | 1 (0.3%) | |||||||||||||||||||||||||||||||||||||||||||||||||||||||||||||||||||||||||||||||||||||||||||||||||
| M stage | 1.000 | ||||||||||||||||||||||||||||||||||||||||||||||||||||||||||||||||||||||||||||||||||||||||||||||||||
| M0 | 157 (50.3%) | 153 (49%) | |||||||||||||||||||||||||||||||||||||||||||||||||||||||||||||||||||||||||||||||||||||||||||||||||
| M1 | 1 (0.3%) | 1 (0.3%) | |||||||||||||||||||||||||||||||||||||||||||||||||||||||||||||||||||||||||||||||||||||||||||||||||
| Clinical stage | 0.190 | ||||||||||||||||||||||||||||||||||||||||||||||||||||||||||||||||||||||||||||||||||||||||||||||||||
| Stage I | 6 (1.9%) | 5 (1.6%) | |||||||||||||||||||||||||||||||||||||||||||||||||||||||||||||||||||||||||||||||||||||||||||||||||
| Stage II | 39 (12.2%) | 40 (12.5%) | |||||||||||||||||||||||||||||||||||||||||||||||||||||||||||||||||||||||||||||||||||||||||||||||||
| Stage III | 40 (12.5%) | 25 (7.8%) | |||||||||||||||||||||||||||||||||||||||||||||||||||||||||||||||||||||||||||||||||||||||||||||||||
| Stage IV | 75 (23.5%) | 89 (27.9%) | |||||||||||||||||||||||||||||||||||||||||||||||||||||||||||||||||||||||||||||||||||||||||||||||||
| Gender | 0.934 | ||||||||||||||||||||||||||||||||||||||||||||||||||||||||||||||||||||||||||||||||||||||||||||||||||
| Female | 50 (15.2%) | 52 (15.8%) | |||||||||||||||||||||||||||||||||||||||||||||||||||||||||||||||||||||||||||||||||||||||||||||||||
| Male | 114 (34.7%) | 113 (34.3%) | |||||||||||||||||||||||||||||||||||||||||||||||||||||||||||||||||||||||||||||||||||||||||||||||||
| Age | 0.917 | ||||||||||||||||||||||||||||||||||||||||||||||||||||||||||||||||||||||||||||||||||||||||||||||||||
| <=60 | 78 (23.8%) | 77 (23.5%) | |||||||||||||||||||||||||||||||||||||||||||||||||||||||||||||||||||||||||||||||||||||||||||||||||
| >60 | 85 (25.9%) | 88 (26.8%) | |||||||||||||||||||||||||||||||||||||||||||||||||||||||||||||||||||||||||||||||||||||||||||||||||
| Histologic grade | 0.161 | ||||||||||||||||||||||||||||||||||||||||||||||||||||||||||||||||||||||||||||||||||||||||||||||||||
| G1 | 31 (9.7%) | 21 (6.5%) | |||||||||||||||||||||||||||||||||||||||||||||||||||||||||||||||||||||||||||||||||||||||||||||||||
| G2 | 102 (31.8%) | 98 (30.5%) | |||||||||||||||||||||||||||||||||||||||||||||||||||||||||||||||||||||||||||||||||||||||||||||||||
| G3 | 27 (8.4%) | 40 (12.5%) | |||||||||||||||||||||||||||||||||||||||||||||||||||||||||||||||||||||||||||||||||||||||||||||||||
| G4 | 1 (0.3%) | 1 (0.3%) | |||||||||||||||||||||||||||||||||||||||||||||||||||||||||||||||||||||||||||||||||||||||||||||||||
| OS event | 0.013 | ||||||||||||||||||||||||||||||||||||||||||||||||||||||||||||||||||||||||||||||||||||||||||||||||||
| Alive | 101 (30.7%) | 78 (23.7%) | |||||||||||||||||||||||||||||||||||||||||||||||||||||||||||||||||||||||||||||||||||||||||||||||||
| Dead | 63 (19.1%) | 87 (26.4%) | |||||||||||||||||||||||||||||||||||||||||||||||||||||||||||||||||||||||||||||||||||||||||||||||||
| DSS event | 0.003 | ||||||||||||||||||||||||||||||||||||||||||||||||||||||||||||||||||||||||||||||||||||||||||||||||||
| Alive | 122 (39.1%) | 97 (31.1%) | |||||||||||||||||||||||||||||||||||||||||||||||||||||||||||||||||||||||||||||||||||||||||||||||||
| Dead | 34 (10.9%) | 59 (18.9%) | |||||||||||||||||||||||||||||||||||||||||||||||||||||||||||||||||||||||||||||||||||||||||||||||||
| PFI event | < 0.001 | ||||||||||||||||||||||||||||||||||||||||||||||||||||||||||||||||||||||||||||||||||||||||||||||||||
| Alive | 112 (34%) | 82 (24.9%) | |||||||||||||||||||||||||||||||||||||||||||||||||||||||||||||||||||||||||||||||||||||||||||||||||
| Dead | 52 (15.8%) | 83 (25.2%) | |||||||||||||||||||||||||||||||||||||||||||||||||||||||||||||||||||||||||||||||||||||||||||||||||
| Note: OSCC, oral squamous cell carcinoma. | |||||||||||||||||||||||||||||||||||||||||||||||||||||||||||||||||||||||||||||||||||||||||||||||||||
Elevated UFM1 expression levels were associated with poor prognosis in OSCC patients based on TNM stage
In patients with OSCC of T1-3, T2-3, T2-4, T3, T3-4, T4, N1-2, N1-3, N2, N2-3, and M0 stages, elevated UFM1 expression was significantly associated with poor survival time in cancer patients (Figure 4). In patients with OSCC of T1-3, T2-3, T2-4, T3, T3-4, N0, N1-2, N1-3, N2, N2-3, and M0 stages, elevated UFM1 expression was significantly associated with the poorer DSS in cancer patients (Figure 5). In patients with OSCC of T1-2, T1-3, T2-3, T2-4, T3, T3-4, N0, N1-2, N1-3, N2, N2-3 and M0 stages, elevated UFM1 expression was significantly associated with the poorer PFI in cancer patients (Figure 6).
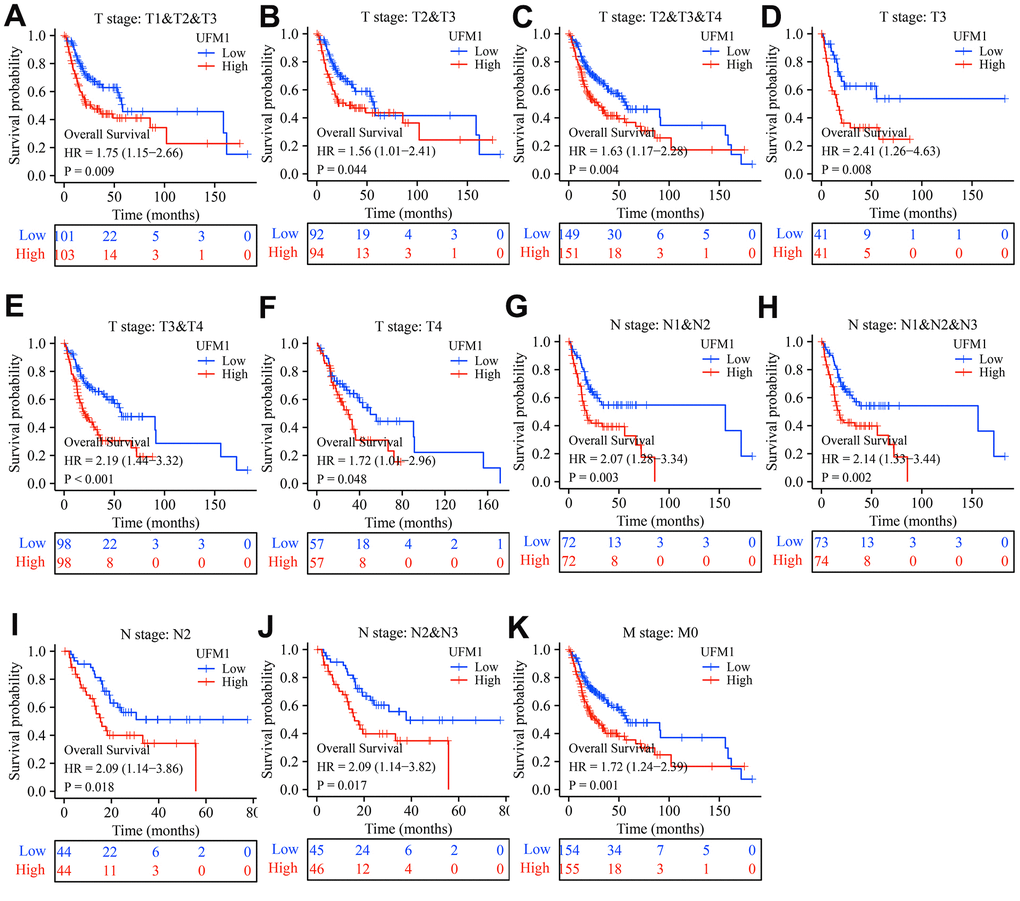
Figure 4. Elevated UFM1 expression associated with the shorter OS in OSCC patients based on the data of TPM type in TCGA database. (A) Stage T1-3; (B) Stage T2-3; (C) Stage T2-4; (D) Stage T3; (E) Stage T3-4; (F) Stage T4; (G) N1-2; (H) N1-3; (I) N2; (J) N2-3; (K) M0. Note: OSCC, oral squamous cell carcinoma; OS, overall survival; TPM, transcripts per million; TCGA, The Cancer Genome Atlas.

Figure 5. Elevated UFM1 expression associated with the shorter DSS in OSCC patients based on the data of TPM type in TCGA database. (A) Stage T1-3; (B) Stage T2-3; (C) Stage T2-4; (D) Stage T3; (E) Stage T3-4; (F) N0; (G) N1-2; (H) N1-3; (I) N2; (J) N2-3; (K) M0. Note: OSCC, oral squamous cell carcinoma; DSS, disease-specific survival; TPM, transcripts per million; TCGA, The Cancer Genome Atlas.
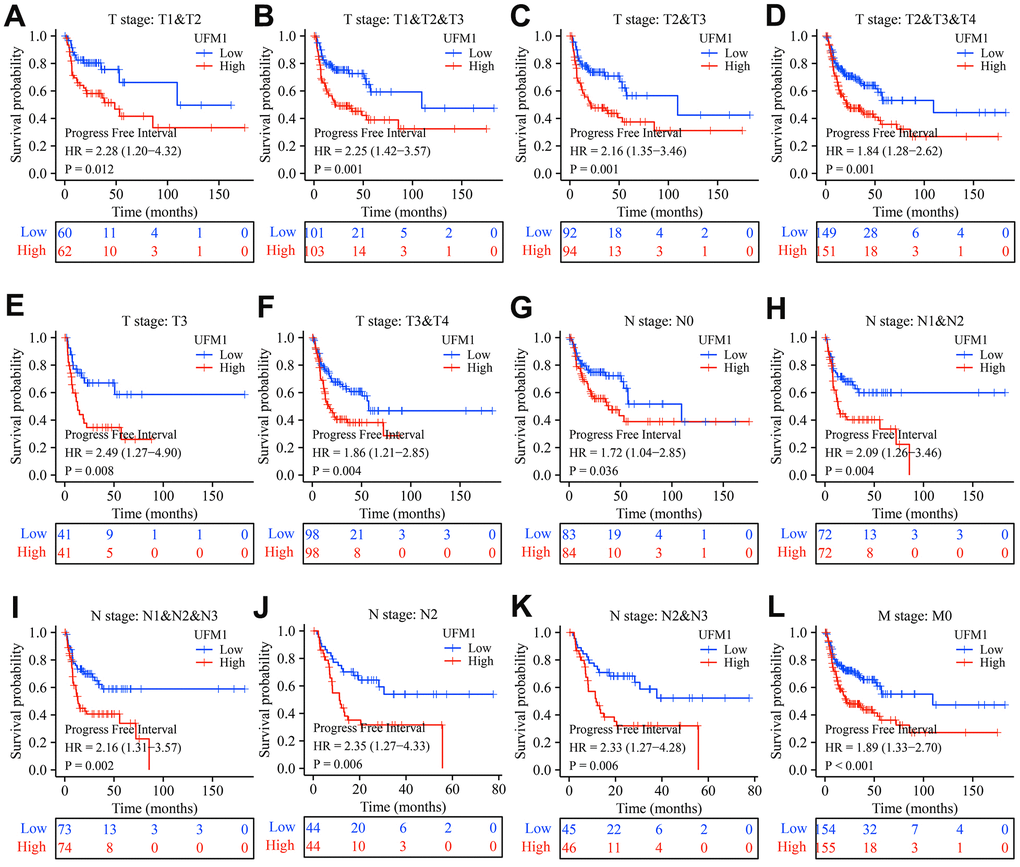
Figure 6. Elevated UFM1 expression associated with the shorter PFI in OSCC patients based on the data of TPM type in TCGA database. (A) Stage T1-2; (B) Stage T1-3; (C) Stage T2-3; (D) Stage T2-4; (E) Stage T3; (F) Stage T3-4; (G) N0; (H) N1-2; (I) N1-3; (J) N2; (K) N2-3; (L) M0. Note: OSCC, oral squamous cell carcinoma; PFI, progression-free interval; TPM, transcripts per million; TCGA, The Cancer Genome Atlas.
Nomograms of UFM1
Univariate Cox regression analysis depicted that UFM1 overexpression was an influencing factor of poor prognosis indicators OS, DSS and PFI in OSCC patients (Tables 2–4). In addition, N stage was also an influencing factor for DSS and PFI in OSCC patients (Tables 3, 4). T, N, and M stages were risk factors for dismal prognosis in OSCC patients. Therefore, we constructed the nomograms of the T, N, and M stages and UFM1 expression levels (Figure 7).
Table 2. The factors affecting prognostic indicator overall survival by univariate Cox regression analysis.
| Characteristics | N | HR (95% CI) | P |
| T stage | 318 | ||
| T1 | 18 | Reference | |
| T2 | 104 | 1.056 (0.475-2.349) | 0.893 |
| T3 | 82 | 1.511 (0.676-3.378) | 0.315 |
| T4 | 114 | 1.378 (0.629-3.020) | 0.423 |
| N stage | 314 | ||
| N0 | 167 | Reference | |
| N1 | 56 | 1.131 (0.737-1.735) | 0.574 |
| N2&N3 | 91 | 1.493 (1.022-2.180) | 0.038 |
| M stage | 311 | ||
| M0 | 309 | Reference | |
| M1 | 2 | 2.621 (0.365-18.838) | 0.338 |
| UFM1 expression | 328 | ||
| Low | 163 | Reference | |
| High | 165 | 1.770 (1.277-2.454) | <0.001 |
Table 3. The factors affecting prognostic indicator DSS by univariate Cox regression analysis.
| Characteristics | N | HR (95% CI) | P | ||||||||||||||||||||||||||||||||||||||||||||||||||||||||||||||||||||||||||||||||||||||||||||||||
| T stage | 301 | ||||||||||||||||||||||||||||||||||||||||||||||||||||||||||||||||||||||||||||||||||||||||||||||||||
| T1 | 18 | Reference | |||||||||||||||||||||||||||||||||||||||||||||||||||||||||||||||||||||||||||||||||||||||||||||||||
| T2 | 96 | 0.998 (0.342-2.908) | 0.996 | ||||||||||||||||||||||||||||||||||||||||||||||||||||||||||||||||||||||||||||||||||||||||||||||||
| T3 | 78 | 2.101 (0.741-5.959) | 0.163 | ||||||||||||||||||||||||||||||||||||||||||||||||||||||||||||||||||||||||||||||||||||||||||||||||
| T4 | 109 | 1.587 (0.565-4.454) | 0.381 | ||||||||||||||||||||||||||||||||||||||||||||||||||||||||||||||||||||||||||||||||||||||||||||||||
| N stage | 297 | ||||||||||||||||||||||||||||||||||||||||||||||||||||||||||||||||||||||||||||||||||||||||||||||||||
| N0 | 156 | Reference | |||||||||||||||||||||||||||||||||||||||||||||||||||||||||||||||||||||||||||||||||||||||||||||||||
| N1 | 50 | 1.013 (0.550-1.866) | 0.966 | ||||||||||||||||||||||||||||||||||||||||||||||||||||||||||||||||||||||||||||||||||||||||||||||||
| N2&N3 | 91 | 2.116 (1.351-3.314) | 0.001 | ||||||||||||||||||||||||||||||||||||||||||||||||||||||||||||||||||||||||||||||||||||||||||||||||
| M stage | 294 | ||||||||||||||||||||||||||||||||||||||||||||||||||||||||||||||||||||||||||||||||||||||||||||||||||
| M0 | 292 | Reference | |||||||||||||||||||||||||||||||||||||||||||||||||||||||||||||||||||||||||||||||||||||||||||||||||
| M1 | 2 | 3.773 (0.522-27.287) | 0.188 | ||||||||||||||||||||||||||||||||||||||||||||||||||||||||||||||||||||||||||||||||||||||||||||||||
| UFM1 expression | 311 | ||||||||||||||||||||||||||||||||||||||||||||||||||||||||||||||||||||||||||||||||||||||||||||||||||
| Low | 155 | Reference | |||||||||||||||||||||||||||||||||||||||||||||||||||||||||||||||||||||||||||||||||||||||||||||||||
| High | 156 | 2.150 (1.408-3.282) | <0.001 | ||||||||||||||||||||||||||||||||||||||||||||||||||||||||||||||||||||||||||||||||||||||||||||||||
| Note: DSS, disease-specific survival. | |||||||||||||||||||||||||||||||||||||||||||||||||||||||||||||||||||||||||||||||||||||||||||||||||||
Table 4. The factors affecting prognostic indicator PFI by univariate Cox regression analysis.
| Characteristics | N | HR (95% CI) | P | ||||||||||||||||||||||||||||||||||||||||||||||||||||||||||||||||||||||||||||||||||||||||||||||||
| T stage | 318 | ||||||||||||||||||||||||||||||||||||||||||||||||||||||||||||||||||||||||||||||||||||||||||||||||||
| T1 | 18 | Reference | |||||||||||||||||||||||||||||||||||||||||||||||||||||||||||||||||||||||||||||||||||||||||||||||||
| T2 | 104 | 1.697 (0.606-4.750) | 0.314 | ||||||||||||||||||||||||||||||||||||||||||||||||||||||||||||||||||||||||||||||||||||||||||||||||
| T3 | 82 | 2.402 (0.855-6.744) | 0.096 | ||||||||||||||||||||||||||||||||||||||||||||||||||||||||||||||||||||||||||||||||||||||||||||||||
| T4 | 114 | 2.129 (0.769-5.894) | 0.146 | ||||||||||||||||||||||||||||||||||||||||||||||||||||||||||||||||||||||||||||||||||||||||||||||||
| N stage | 314 | ||||||||||||||||||||||||||||||||||||||||||||||||||||||||||||||||||||||||||||||||||||||||||||||||||
| N0 | 167 | Reference | |||||||||||||||||||||||||||||||||||||||||||||||||||||||||||||||||||||||||||||||||||||||||||||||||
| N1 | 56 | 0.975 (0.594-1.599) | 0.919 | ||||||||||||||||||||||||||||||||||||||||||||||||||||||||||||||||||||||||||||||||||||||||||||||||
| N2&N3 | 91 | 1.649 (1.121-2.425) | 0.011 | ||||||||||||||||||||||||||||||||||||||||||||||||||||||||||||||||||||||||||||||||||||||||||||||||
| M stage | 311 | ||||||||||||||||||||||||||||||||||||||||||||||||||||||||||||||||||||||||||||||||||||||||||||||||||
| M0 | 309 | Reference | |||||||||||||||||||||||||||||||||||||||||||||||||||||||||||||||||||||||||||||||||||||||||||||||||
| M1 | 2 | 2.524 (0.352-18.116) | 0.357 | ||||||||||||||||||||||||||||||||||||||||||||||||||||||||||||||||||||||||||||||||||||||||||||||||
| UFM1 expression | 328 | ||||||||||||||||||||||||||||||||||||||||||||||||||||||||||||||||||||||||||||||||||||||||||||||||||
| Low | 163 | Reference | |||||||||||||||||||||||||||||||||||||||||||||||||||||||||||||||||||||||||||||||||||||||||||||||||
| High | 165 | 1.947 (1.375-2.757) | <0.001 | ||||||||||||||||||||||||||||||||||||||||||||||||||||||||||||||||||||||||||||||||||||||||||||||||
| Note: OPFI, progression-free interval. | |||||||||||||||||||||||||||||||||||||||||||||||||||||||||||||||||||||||||||||||||||||||||||||||||||
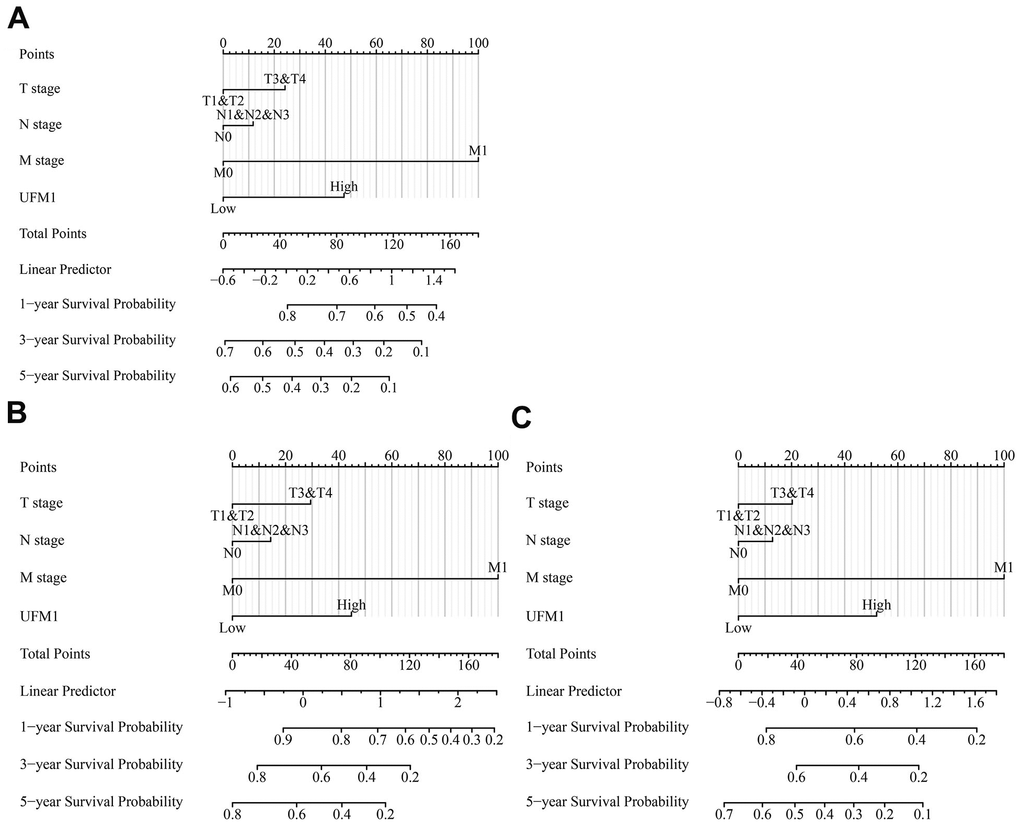
Figure 7. The OS, DSS and PFI-related nomograms based on the T, N, and M stages and UFM1 expression based on the data of TPM type in TCGA database. (A) OS; (B) DSS; (C) PFI. Note: OS, overall survival; DSS, disease-specific survival; PFI, progression-free interval; TPM, transcripts per million; TCGA, The Cancer Genome Atlas.
Pathways of UFM1 co-expressed genes
There were 148 UFM1 positively correlated co-expressed genes (Table 5). In the David database, KEGG analysis showed that UFM1 co-expressed genes involved the autophagy, Biosynthesis of nucleotide sugars, Metabolic pathways, Amino sugar and nucleotide sugar metabolism, and N-Glycan biosynthesis B signal mechanism (P <0.05). In addition, Figure 8 showed that UFM1 was significantly correlated with the expression levels of SUPT20H, COG6, COG3, MTRF1, GPALPP1, WBP4, USPL1, ALG5, ALG11, NUP58, N4BP2L2, and CDK8.
Table 5. UFM1 co-expressed genes.
| Gene | Cor | Gene | Cor | Gene | Cor | Gene | Cor |
| SUPT20H | 0.761 | SEPTIN7 | 0.483 | ODR4 | 0.450 | TRMT11 | 0.412 |
| COG6 | 0.716 | NAA16 | 0.483 | CKAP2 | 0.445 | TRMT13 | 0.412 |
| COG3 | 0.704 | RFC3 | 0.482 | IMPA1 | 0.443 | PCNX4 | 0.411 |
| MTRF1 | 0.665 | EXOSC8 | 0.481 | SLC25A15 | 0.442 | TMED2 | 0.410 |
| GPALPP1 | 0.657 | SLC25A30 | 0.479 | POT1 | 0.437 | TARS1 | 0.410 |
| WBP4 | 0.644 | PROSER1 | 0.479 | SBDSP1 | 0.437 | LACC1 | 0.410 |
| USPL1 | 0.627 | NUDT15 | 0.477 | SNX14 | 0.437 | DCAF17 | 0.410 |
| ALG5 | 0.613 | MICU2 | 0.476 | KATNAL1 | 0.436 | BBIP1 | 0.409 |
| ALG11 | 0.603 | NEK3 | 0.474 | ZDHHC17 | 0.433 | MPHOSPH8 | 0.409 |
| NUP58 | 0.602 | CCDC122 | 0.473 | PCID2 | 0.433 | SPCS3 | 0.409 |
| N4BP2L2 | 0.598 | HMGB1 | 0.472 | DNAJC24 | 0.431 | DPM1 | 0.409 |
| CDK8 | 0.584 | VWA8 | 0.468 | STARD3NL | 0.431 | SNX6 | 0.409 |
| NUFIP1 | 0.570 | ELF1 | 0.468 | ARF4 | 0.431 | SELENOF | 0.409 |
| MRPS31 | 0.549 | OBI1 | 0.4681 | ZRANB2 | 0.429 | RAP2A | 0.408 |
| ESD | 0.544 | MZT1 | 0.465 | MAP3K7 | 0.427 | TM9SF2 | 0.407 |
| LRCH1 | 0.538 | CDADC1 | 0.464 | CAPZA2 | 0.426 | AKAP10 | 0.407 |
| FNDC3A | 0.537 | VPS36 | 0.464 | FAM76B | 0.426 | PRELID3B | 0.407 |
| UGGT2 | 0.532 | CCDC82 | 0.464 | USP12 | 0.426 | STAM2 | 0.407 |
| MTMR6 | 0.526 | PIBF1 | 0.464 | ABCE1 | 0.426 | AL390728.4 | 0.407 |
| NHLRC3 | 0.526 | MRPS31P4 | 0.463 | GLS | 0.424 | ZMYM2 | 0.407 |
| SPRYD7 | 0.521 | TMCO3 | 0.462 | DPY19L4 | 0.423 | GOLGA5 | 0.407 |
| MED4 | 0.517 | PAN3 | 0.462 | EIF2A | 0.423 | GNPDA2 | 0.406 |
| RFXAP | 0.514 | BFAR | 0.461 | SLC39A10 | 0.419 | PGM3 | 0.405 |
| GTF2F2 | 0.513 | IFT88 | 0.461 | RPE | 0.419 | MTRR | 0.404 |
| INTS6 | 0.509 | TMEM87B | 0.460 | C2orf49 | 0.416 | HMGN4 | 0.404 |
| RCBTB1 | 0.509 | KBTBD6 | 0.459 | SETDB2 | 0.416 | XRN2 | 0.404 |
| RNF6 | 0.504 | COPB1 | 0.459 | SUCLA2 | 0.416 | ZNF143 | 0.404 |
| UTP14C | 0.502 | PRKAA1 | 0.458 | TAF1A | 0.415 | STX2 | 0.404 |
| TGDS | 0.502 | TPP2 | 0.458 | CDC16 | 0.414 | PCNP | 0.403 |
| PDS5B | 0.499 | DNAJB14 | 0.456 | POLR1D | 0.414 | SLC25A32 | 0.403 |
| ZMYM5 | 0.499 | GPR180 | 0.455 | ZCCHC4 | 0.414 | TMED5 | 0.402 |
| KPNA3 | 0.498 | LRRC40 | 0.455 | NUDCD1 | 0.414 | FBXL2 | 0.401 |
| DGKH | 0.495 | PMM2 | 0.454 | RBM18 | 0.413 | GOPC | 0.401 |
| AKAP11 | 0.495 | RB1 | 0.452 | GTF2H1 | 0.413 | TMEM267 | 0.401 |
| TANK | 0.488 | ZC3H7A | 0.452 | IPO5 | 0.412 | ZDHHC20 | 0.401 |
| ABHD13 | 0.487 | SUGT1 | 0.452 | SNRNP27 | 0.412 | CUL4A | 0.400 |
| ZC3H13 | 0.4858 | TES | 0.452 | BBS7 | 0.412 | UFM1 | 1.00 |
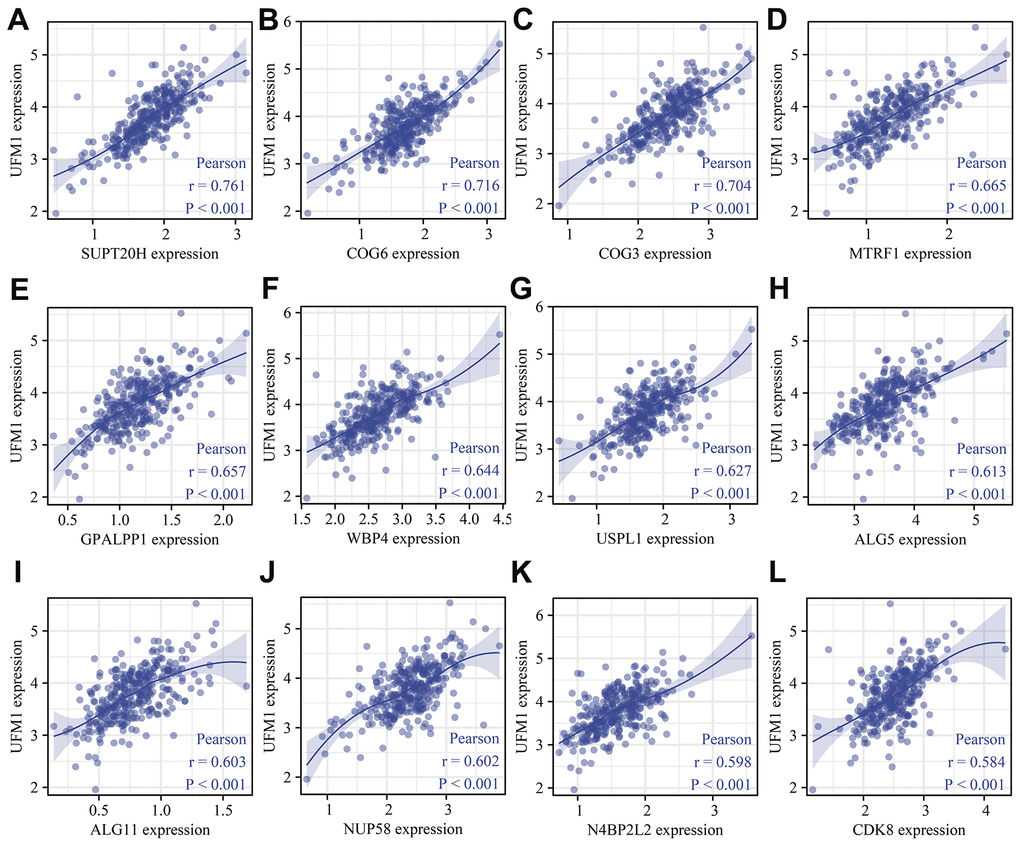
Figure 8. UFM1 co-expressed genes were shown using scatter plot. (A) SUPT20H; (B) COG6; (C) COG3; (D) MTRF1; (E) GPALPP1; (F) WBP4; (G) USPL1; (H) ALG5; (I) ALG11; (J) NUP58; (K) N4BP2L2; (L) CDK8.
Decreased UFM1 expression inhibited the growth and migration of OSCC cells
The mRNA and protein expression levels of UFM1 in the si-UFM1 group were significantly decreased using RT-PCR and Western blotting (Figure 9A–9C). CCK-8 detection exposed that inhibition of UFM1 expression significantly inhibited the cal27 cell proliferation, with statistically significant results (Figure 9D). The migration and invasion ability of cal27 cells were significantly decreased when UFM1 expression was inhibited (Figures 9E, 10).
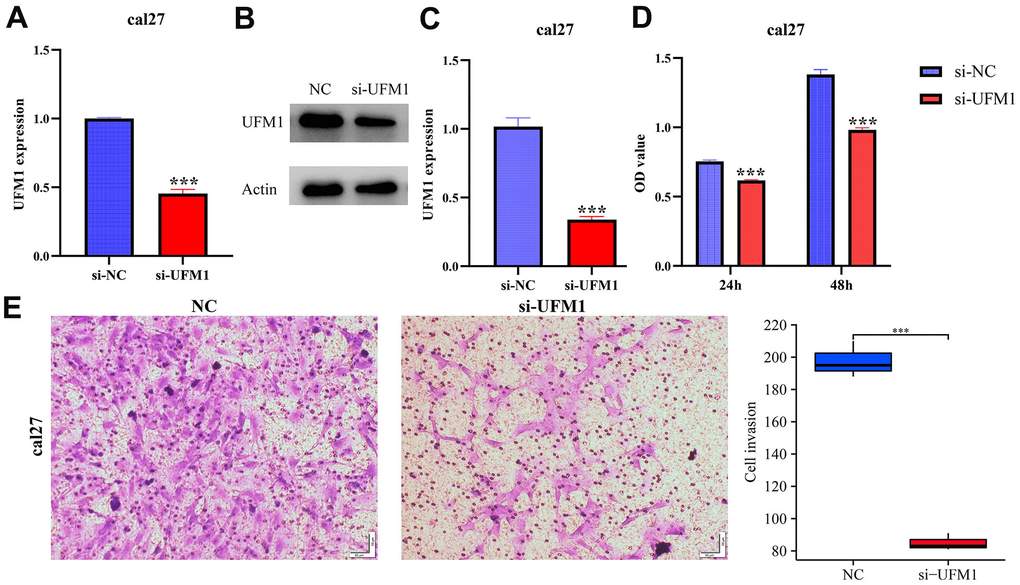
Figure 9. Inhibiting UFM1 expression significantly reduces cell proliferation and invasion via CCK-8 and Transwell. (A–C) Establishment of cell model; (D) Cell proliferation; (E) Cell invasion.
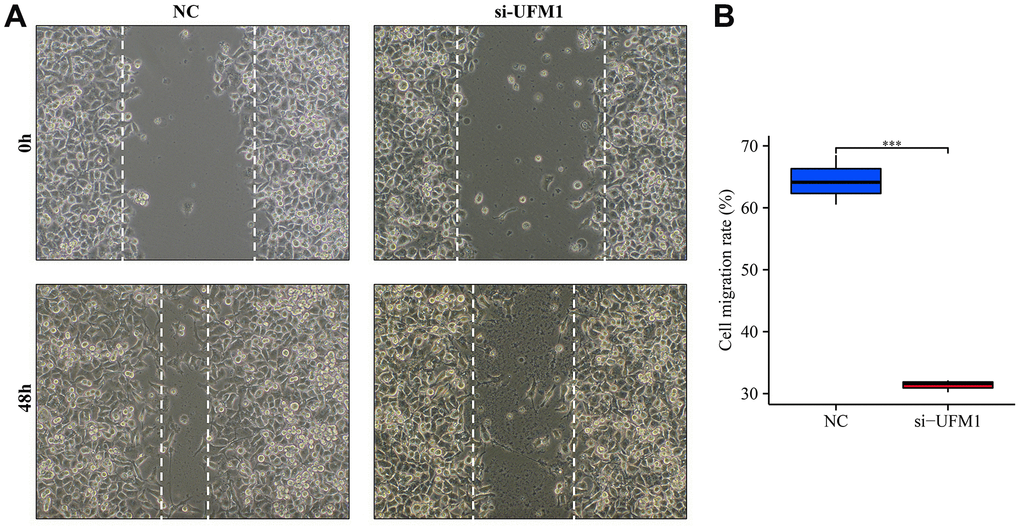
Figure 10. Inhibition of UFM1 expression significantly reduces cell migration. (A) Wound healing of cancer cells; (B) Cell migration rate in si-UFM1 vs. NC groups.
UFM1 expression levels correlated with ubiquitination and immune cell infiltration in OSCC
Twenty-nine histone ubiquitination genes were obtained from the GSEA (Table 6). We found that the expression levels of UFM1 were significantly associated with the levels of ubiquitinated genes CDC73, RNF2, BMI1, RAG1, PCGF3, PCGF6, TRIM37, PAF1, CTR9, RYBP, CUL4B, PCGF1, PCGF2, UBE2E1, RNF40, WAC, UHRF1, and PCGF5 (Table 6). In addition, UFM1 expression levels significantly correlated with the Th17 cells, T helper cells, Tgd, pDC, Tcm, cytotoxic cells, mast cells, NK CD56dim cells, B cells, TReg, and DC levels in OSCC using bubble and scatter plots (Figures 11, 12).
Table 6. UFM1 expression levels correlated with ubiquitination in OSCC.
| Gene | Cor | P | Gene | Cor | P | ||||||||||||||||||||||||||||||||||||||||||||||||||||||||||||||||||||||||||||||||||||||||||||||
| PCGF3 | 0.275 | <0.001 | RING1 | -0.011 | 0.844 | ||||||||||||||||||||||||||||||||||||||||||||||||||||||||||||||||||||||||||||||||||||||||||||||
| LEO1 | 0.064 | 0.245 | RNF2 | 0.364 | <0.001 | ||||||||||||||||||||||||||||||||||||||||||||||||||||||||||||||||||||||||||||||||||||||||||||||
| DTX3L | 0.090 | 0.102 | BMI1 | 0.324 | <0.001 | ||||||||||||||||||||||||||||||||||||||||||||||||||||||||||||||||||||||||||||||||||||||||||||||
| DDB1 | 0.096 | 0.081 | SKP1 | 0.008 | 0.885 | ||||||||||||||||||||||||||||||||||||||||||||||||||||||||||||||||||||||||||||||||||||||||||||||
| DDB2 | 0.020 | 0.719 | UBE2E1 | 0.175 | 0.001 | ||||||||||||||||||||||||||||||||||||||||||||||||||||||||||||||||||||||||||||||||||||||||||||||
| RNF168 | 0.057 | 0.304 | PCGF2 | 0.185 | <0.001 | ||||||||||||||||||||||||||||||||||||||||||||||||||||||||||||||||||||||||||||||||||||||||||||||
| RYBP | 0.187 | <0.001 | CDC73 | 0.379 | <0.001 | ||||||||||||||||||||||||||||||||||||||||||||||||||||||||||||||||||||||||||||||||||||||||||||||
| UHRF1 | 0.122 | 0.026 | PCGF6 | 0.252 | <0.001 | ||||||||||||||||||||||||||||||||||||||||||||||||||||||||||||||||||||||||||||||||||||||||||||||
| TRIM37 | 0.246 | <0.001 | PCGF5 | 0.121 | 0.029 | ||||||||||||||||||||||||||||||||||||||||||||||||||||||||||||||||||||||||||||||||||||||||||||||
| WAC | 0.131 | 0.017 | CUL4B | 0.186 | <0.001 | ||||||||||||||||||||||||||||||||||||||||||||||||||||||||||||||||||||||||||||||||||||||||||||||
| PAF1 | -0.222 | <0.001 | KDM2B | 0.033 | 0.551 | ||||||||||||||||||||||||||||||||||||||||||||||||||||||||||||||||||||||||||||||||||||||||||||||
| BCOR | 0.023 | 0.678 | PCGF1 | 0.186 | <0.001 | ||||||||||||||||||||||||||||||||||||||||||||||||||||||||||||||||||||||||||||||||||||||||||||||
| RNF20 | 0.086 | 0.121 | CTR9 | 0.205 | <0.001 | ||||||||||||||||||||||||||||||||||||||||||||||||||||||||||||||||||||||||||||||||||||||||||||||
| ATXN7L3 | 0.071 | 0.200 | RNF40 | 0.161 | 0.003 | ||||||||||||||||||||||||||||||||||||||||||||||||||||||||||||||||||||||||||||||||||||||||||||||
| RAG1 | 0.312 | <0.001 | |||||||||||||||||||||||||||||||||||||||||||||||||||||||||||||||||||||||||||||||||||||||||||||||||
| Note: OSCC, oral squamous cell carcinoma. | |||||||||||||||||||||||||||||||||||||||||||||||||||||||||||||||||||||||||||||||||||||||||||||||||||
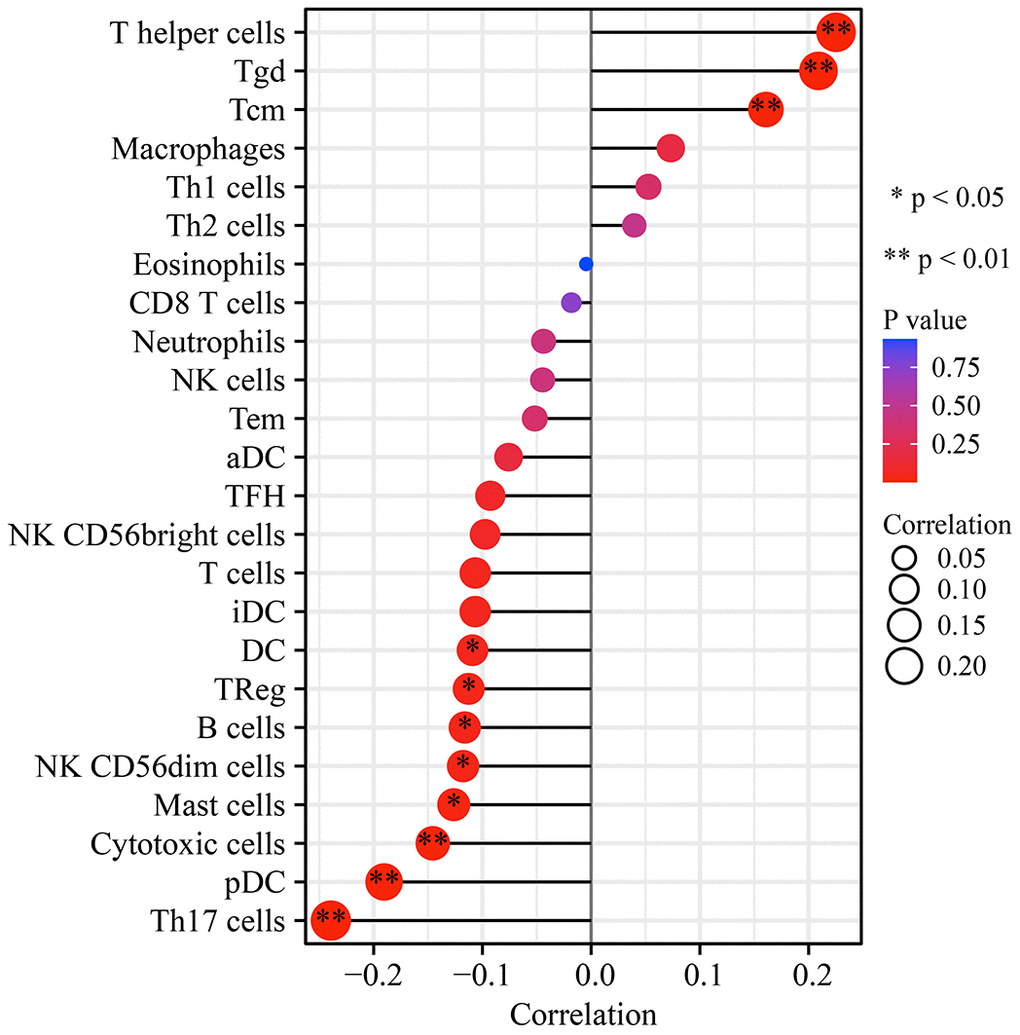
Figure 11. UFM1 expression correlation with immune infiltrating cells in OSCC using bubble plot. Note: OSCC, oral squamous cell carcinoma.
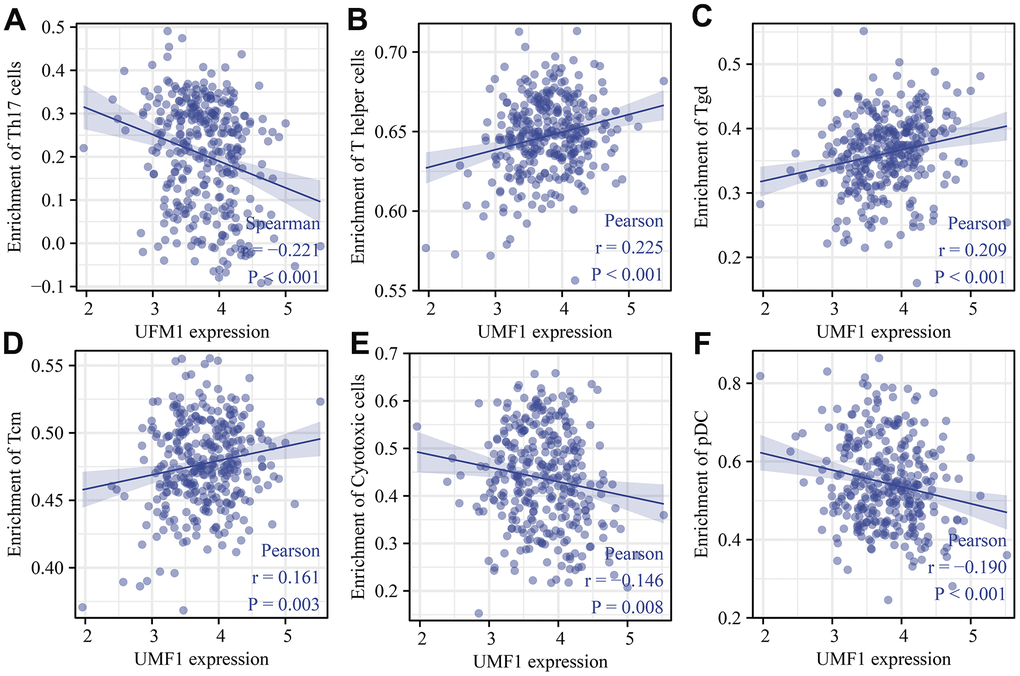
Figure 12. UFM1 expression correlated with immune infiltrating cells in OSCC using scatter plot. (A) Th17 cells; (B) T helper cells; (C) Tgd; (D) Tcm; (E) Cytotoxic cells; (F) pDC. Note: OSCC, oral squamous cell carcinoma.
Discussion
OSCC is increasing annually and has become younger. The living habits of OSCC patients are affected greatly, and the prognosis is often poor. Studies have displayed that some biomarkers could predict the prognosis of OSCC patients, and inhibiting or promoting their expression could cause tumor growth arrest [2, 5, 14]. Several studies have reported the association of UFM1 with prognosis in GC, HCC, and breast cancer patients [7–10]. Currently, the role of UFM1 in OSCC has not been revealed. Our study found that UFM1 was overexpressed in unpaired and paired OSCC tissues. Cox regression and survival analyses revealed that UFM1 overexpression was significantly associated with shorter OS, DSS, and PFI in OSCC patients. The nomograms of T, N, and M stages and UFM1 expression levels were related to the prognosis of OSCC patients. In addition, inhibition of UFM1 expression could inhibit the proliferation, migration, and invasion of OSCC cells. It was discovered preliminarily that UFM1 overexpression was a risk factor for poor prognosis in OSCC patients and subsequently could be a potential biomarker for poor prognosis in OSCC patients.
Ubiquitination plays an important role in protein localization, metabolism, function, regulation and degradation, and in the cell cycle, proliferation, apoptosis, differentiation, metastasis, gene expression, transcriptional regulation, and signaling transmission in cancer [15–18]. UFM1 is a ubiquitin-like protein, and can bind to the target proteins UBA5 (E1), UFC1 (E2), and UFL1 (E3) through a three-step enzyme system. The protein modification of UFM1 can be reversed by UFM1 specific protease (UFSP), which in turn involves tumorigenesis [19]. We found that UFM1 is associated with the ubiquitinating genes: CDC73, RNF2, BMI1, RAG1, PCGF3, PCGF6, TRIM37, PAF1, CTR9, RYBP, CUL4B, PCGF1, PCGF2, UBE2E1, RNF40, WAC, UHRF1, and PCGF5 levels. Studies have depicted that RNF2, BMI1, TRIM37, and other ubiquitinating genes were related to cancer progression [20–24]. These results further suggested that the ubiquitin-like protein UFM1 has an important role in OSCC progression.
Tumor heterogeneity, immune status, and interrelationships between tumor and stromal cells within the tumor microenvironment might influence therapeutic efficacy [25]. A disturbed immune microenvironment was significantly associated with the progression of OSCC [25–27]. For example, Lenouvel et al. found that PD-L1 expression levels were associated with poor DSS and disease-free survival in OSCC patients. PD-L1 overexpression was positively associated with females, non-smokers, non-smokers and drinkers, advanced tumors, and high levels of PD-1, CD4+ and CD8+ [28]. Anti-PD-1 therapy improved the prognosis of patients with OSCC [29]. Our study found that the expression levels of UFM1 were significantly correlated with the levels of immune cells (Th17 cells, T helper cells, Tgd, pDC, Tcm, cytotoxic cells, mast cells, NK CD56dim cells, B cells, TReg, and DC), and immune cell markers, indicating that UFM1 might be related to immunity and the members of immune microenvironment homeostasis.
The roles of the UFM1 gene in OSCC were explored in this study via the high-quality samples from the available databases and basic research, deeming it reliable. However, this study had some limitations. First, the expression and prognostic values of UFM1 in OSCC, and the relationship between UFM1 expression and immune infiltration in OSCC were found using bioinformatics analysis, necessitating the collection of tissue samples from our hospital to verify in the future. Second, we must explore the roles and signaling mechanisms of UFM1 involved in the occurrence and development of OSCC in vivo and in vitro. In general, the results demonstrated that UFM1 was overexpressed in OSCC. The increased expression of UFM1 was associated with poor prognosis and immunity in OSCC patients. Inhibition of UFM1 expression could delay the progress of OSCC, indicating that UFM1 has the potential to become a prognostic biomarker and therapeutic target for the prognosis of OSCC patients for OSCC patients.
Conclusions
Elevated UFM1 expression was associated with poor prognosis and immune infiltration in OSCC. Inhibition of UFM1 expression could inhibit the proliferation, migration, and invasion of OSCC cells. UFM1 could be a biomarker for prognosis and treating OSCC patients.
Author Contributions
Di Ke, Hao-Han Guo, and Ni Jiang developed a research plan, analyzed data, and wrote the manuscript. Teng-Yang Fan, and Rong-Shu Shi conceived the research plan and reviewed the manuscript. Ni Jiang, and Di Ke designed the experiment, and carried it out. The final manuscript was read and approved by all authors.
Acknowledgments
Thanks to TCGA database for providing the data of OSCC patients for this study.
Conflicts of Interest
The authors declare that they have no conflicts of interest.
Funding
This research was supported by Zunyi City Joint Fund (Zun Shi Ke He HZ Word (2022) No. 244).
References
- 1. Liu J, Cao W, Chen W, Xu L, Zhang C. Decreased expression of Kallmann syndrome 1 sequence gene (KAL1) contributes to oral squamous cell carcinoma progression and significantly correlates with poorly differentiated grade. J Oral Pathol Med. 2015; 44:109–14. https://doi.org/10.1111/jop.12206 [PubMed]
- 2. Xu L, Li Q, Wang Y, Wang L, Guo Y, Yang R, Zhao N, Ge N, Wang Y, Guo C. m6A methyltransferase METTL3 promotes oral squamous cell carcinoma progression through enhancement of IGF2BP2-mediated SLC7A11 mRNA stability. Am J Cancer Res. 2021; 11:5282–98. [PubMed]
- 3. Mao L, Wu X, Gong Z, Yu M, Huang Z. PDIA6 contributes to aerobic glycolysis and cancer progression in oral squamous cell carcinoma. World J Surg Oncol. 2021; 19:88. https://doi.org/10.1186/s12957-021-02190-w [PubMed]
- 4. Huang Y, Chen Z, Chen X, Chen X, Xu M. TOMM34 promotes cell proliferation, migration, and invasion of OSCC and modulates mitochondrial function. J Oral Pathol Med. 2023; 52:47–55. https://doi.org/10.1111/jop.13382 [PubMed]
- 5. Zhang G, Zhao X, Liu W. NEDD4L inhibits glycolysis and proliferation of cancer cells in oral squamous cell carcinoma by inducing ENO1 ubiquitination and degradation. Cancer Biol Ther. 2022; 23:243–53. https://doi.org/10.1080/15384047.2022.2054244 [PubMed]
- 6. Komatsu M, Chiba T, Tatsumi K, Iemura S, Tanida I, Okazaki N, Ueno T, Kominami E, Natsume T, Tanaka K. A novel protein-conjugating system for Ufm1, a ubiquitin-fold modifier. EMBO J. 2004; 23:1977–86. https://doi.org/10.1038/sj.emboj.7600205 [PubMed]
- 7. Lin JX, Xie XS, Weng XF, Qiu SL, Yoon C, Lian NZ, Xie JW, Wang JB, Lu J, Chen QY, Cao LL, Lin M, Tu RH, et al. UFM1 suppresses invasive activities of gastric cancer cells by attenuating the expres7sion of PDK1 through PI3K/AKT signaling. J Exp Clin Cancer Res. 2019; 38:410. https://doi.org/10.1186/s13046-019-1416-4 [PubMed]
- 8. Chen E, Zhou B, Bian S, Ni W, Chen Z. The lncRNA B3GALT5-AS1 Functions as an HCC Suppressor by Regulating the miR-934/UFM1 Axis. J Oncol. 2021; 2021:1776432. https://doi.org/10.1155/2021/1776432 [PubMed]
- 9. Yoo HM, Kang SH, Kim JY, Lee JE, Seong MW, Lee SW, Ka SH, Sou YS, Komatsu M, Tanaka K, Lee ST, Noh DY, Baek SH, et al. Modification of ASC1 by UFM1 is crucial for ERα transactivation and breast cancer development. Mol Cell. 2014; 56:261–74. https://doi.org/10.1016/j.molcel.2014.08.007 [PubMed]
- 10. Yoo HM, Park JH, Kim JY, Chung CH. Modification of ERα by UFM1 Increases Its Stability and Transactivity for Breast Cancer Development. Mol Cells. 2022; 45:425–34. https://doi.org/10.14348/molcells.2022.0029 [PubMed]
- 11. Xu M, Kong Y, Chen N, Peng W, Zi R, Jiang M, Zhu J, Wang Y, Yue J, Lv J, Zeng Y, Chin YE. Identification of Immune-Related Gene Signature and Prediction of CeRNA Network in Active Ulcerative Colitis. Front Immunol. 2022; 13:855645. https://doi.org/10.3389/fimmu.2022.855645 [PubMed]
- 12. Guo Q, Liu XL, Liu HS, Luo XY, Yuan Y, Ji YM, Liu T, Guo JL, Zhang J. The Risk Model Based on the Three Oxidative Stress-Related Genes Evaluates the Prognosis of LAC Patients. Oxid Med Cell Longev. 2022; 2022:4022896. https://doi.org/10.1155/2022/4022896 [PubMed]
- 13. Li D, Liu X, Jiang N, Ke D, Guo Q, Zhai K, Han H, Xiao X, Fan T. Interfering with ITGB1-DT expression delays cancer progression and promotes cell sensitivity of NSCLC to cisplatin by inhibiting the MAPK/ERK pathway. Am J Cancer Res. 2022; 12:2966–88. [PubMed]
- 14. Zhang H, Che Y, Xuan B, Wu X, Li H. Serine hydroxymethyltransferase 2 (SHMT2) potentiates the aggressive process of oral squamous cell carcinoma by binding to interleukin enhancer-binding factor 2 (ILF2). Bioengineered. 2022; 13:8785–97. https://doi.org/10.1080/21655979.2022.2051886 [PubMed]
- 15. Wang F, Wang J, Wang J, Zhang L, Fu H, Li J, Tian T, Zuo J, Lv W, Ma X. BCCIPβ facilitates p53 ubiquitination via binding with E6 protein in high-risk HPV positive head and neck squamous cell carcinoma. Biochem Biophys Res Commun. 2020; 529:685–91. https://doi.org/10.1016/j.bbrc.2020.05.183 [PubMed]
- 16. Cui Z, Sun S, Li J, Li J, Sha T, He J, Zuo L. Inhibitor of Growth 4 (ING4) Plays a Tumor-repressing Role in Oral Squamous Cell Carcinoma via Nuclear Factor Kappa-B (NF-kB)/DNA Methyltransferase 1 (DNMT1) Axis-mediated Regulation of Aldehyde Dehydrogenase 1A2 (ALDH1A2). Curr Cancer Drug Targets. 2022; 22:771–83. https://doi.org/10.2174/1568009622666220406104732 [PubMed]
- 17. Liu L, Guo B, Han Y, Xu S, Liu S. MARCH1 silencing suppresses growth of oral squamous cell carcinoma through regulation of PHLPP2. Clin Transl Oncol. 2022; 24:1311–21. https://doi.org/10.1007/s12094-021-02769-5 [PubMed]
- 18. Li M, Gao F, Zhao Q, Zuo H, Liu W, Li W. Tanshinone IIA inhibits oral squamous cell carcinoma via reducing Akt-c-Myc signaling-mediated aerobic glycolysis. Cell Death Dis. 2020; 11:381. https://doi.org/10.1038/s41419-020-2579-9 [PubMed]
- 19. Chung CH, Yoo HM. Emerging role of protein modification by UFM1 in cancer. Biochem Biophys Res Commun. 2022; 633:61–3. https://doi.org/10.1016/j.bbrc.2022.08.093 [PubMed]
- 20. Wang J, Ouyang X, Zhou Z, Mao S, Niu X, Li H, Xu W, Song Y, Cao J, Lai B. RNF2 promotes the progression of colon cancer by regulating ubiquitination and degradation of IRF4. Biochim Biophys Acta Mol Cell Res. 2022; 1869:119162. https://doi.org/10.1016/j.bbamcr.2021.119162 [PubMed]
- 21. Liu Z, Hu C, Zheng L, Liu J, Li K, Li X, Wang Y, Mu W, Chen T, Shi A, Qiu B, Zhang X, Zhang Z, Xu Y. BMI1 promotes cholangiocarcinoma progression and correlates with antitumor immunity in an exosome-dependent manner. Cell Mol Life Sci. 2022; 79:469. https://doi.org/10.1007/s00018-022-04500-1 [PubMed]
- 22. Endoh M, Endo TA, Shinga J, Hayashi K, Farcas A, Ma KW, Ito S, Sharif J, Endoh T, Onaga N, Nakayama M, Ishikura T, Masui O, et al. PCGF6-PRC1 suppresses premature differentiation of mouse embryonic stem cells by regulating germ cell-related genes. Elife. 2017; 6:e21064. https://doi.org/10.7554/eLife.21064 [PubMed]
- 23. Cui G, Gao Z, Chang S, Narwade N, Chen Y, Poudel B, Lei KM, Zhang W, Li G, Poon TC, Cheung E. TRIM37 Augments AP-2γ Transcriptional Activity and Cellular Localization via K63-linked Ubiquitination to Drive Breast Cancer Progression. Int J Biol Sci. 2022; 18:4316–28. https://doi.org/10.7150/ijbs.69466 [PubMed]
- 24. Miao C, Liang C, Li P, Liu B, Qin C, Yuan H, Liu Y, Zhu J, Cui Y, Xu A, Wang S, Su S, Li J, et al. TRIM37 orchestrates renal cell carcinoma progression via histone H2A ubiquitination-dependent manner. J Exp Clin Cancer Res. 2021; 40:195. https://doi.org/10.1186/s13046-021-01980-0 [PubMed]
- 25. Gao A, Pan X, Yang X, Lin Z. Predictive factors in the treatment of oral squamous cell carcinoma using PD-1/PD-L1 inhibitors. Invest New Drugs. 2021; 39:1132–8. https://doi.org/10.1007/s10637-021-01082-w [PubMed]
- 26. Wang G, Zhang M, Cheng M, Wang X, Li K, Chen J, Chen Z, Chen S, Chen J, Xiong G, Xu X, Wang C, Chen D. Tumor microenvironment in head and neck squamous cell carcinoma: Functions and regulatory mechanisms. Cancer Lett. 2021; 507:55–69. https://doi.org/10.1016/j.canlet.2021.03.009 [PubMed]
- 27. Elmusrati A, Wang J, Wang CY. Tumor microenvironment and immune evasion in head and neck squamous cell carcinoma. Int J Oral Sci. 2021; 13:24. https://doi.org/10.1038/s41368-021-00131-7 [PubMed]
- 28. Lenouvel D, González-Moles MÁ, Ruiz-Ávila I, Gonzalez-Ruiz L, Gonzalez-Ruiz I, Ramos-García P. Prognostic and clinicopathological significance of PD-L1 overexpression in oral squamous cell carcinoma: A systematic review and comprehensive meta-analysis. Oral Oncol. 2020; 106:104722. https://doi.org/10.1016/j.oraloncology.2020.104722 [PubMed]
- 29. Hanna GJ, O’Neill A, Shin KY, Wong K, Jo VY, Quinn CT, Cutler JM, Flynn M, Lizotte PH, Annino DJ
Jr , Goguen LA, Kass JI, Rettig EM, et al. Neoadjuvant and Adjuvant Nivolumab and Lirilumab in Patients with Recurrent, Resectable Squamous Cell Carcinoma of the Head and Neck. Clin Cancer Res. 2022; 28:468–78. https://doi.org/10.1158/1078-0432.CCR-21-2635 [PubMed]