Submit an Article
Navigate
Home
Editorial Board
Editorial Policies
Current Volume
Archive
Scientific Integrity
Publication Ethics Statements
Interviews with Outstanding Authors
Newsroom
Sponsored Conferences
Podcast
Contact
Special Collections
Submit an Article
Online ISSN: 1945-4589
Research Paper
|
Volume 15, Issue 22
|
pp. 13059–13076
Inhibition of UFM1 expression suppresses cancer progression and is linked to the dismal prognosis and immune infiltration in oral squamous cell carcinoma
Back to article
Figure 8
(8 of 12)
−
100%
+
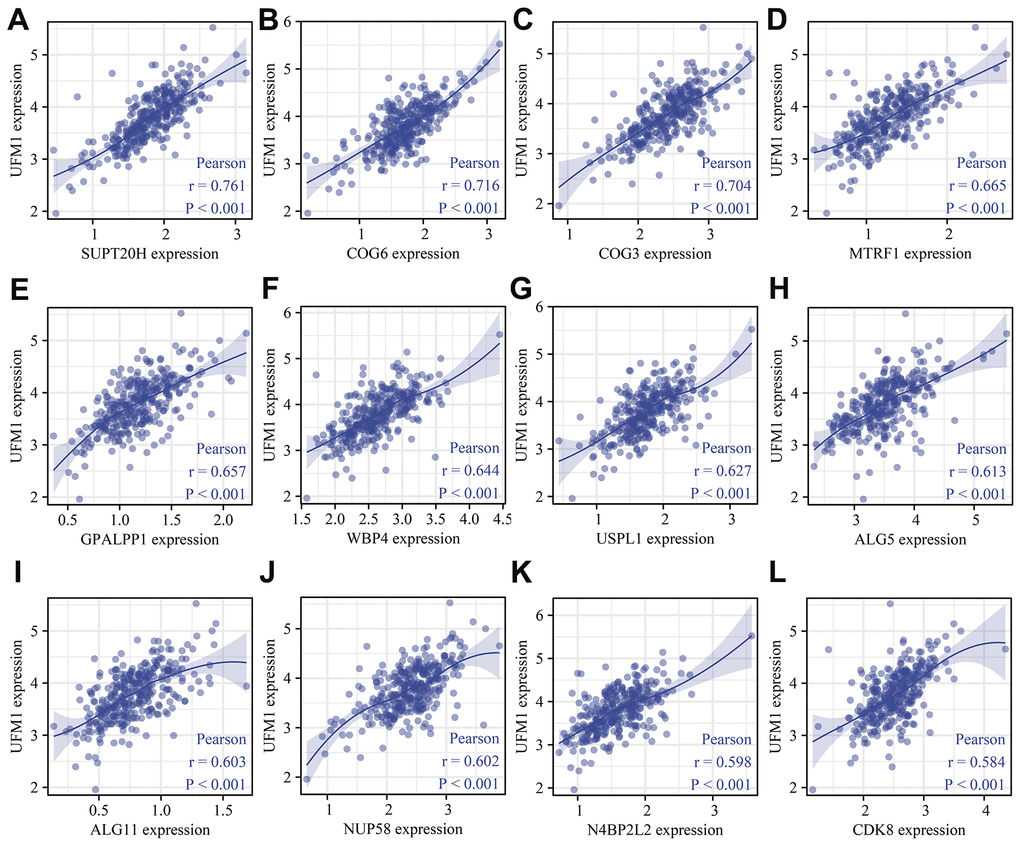
Figure 8.
UFM1 co-expressed genes were shown using scatter plot.
(
A
) SUPT20H; (
B
) COG6; (
C
) COG3; (
D
) MTRF1; (
E
) GPALPP1; (
F
) WBP4; (
G
) USPL1; (
H
) ALG5; (
I
) ALG11; (
J
) NUP58; (
K
) N4BP2L2; (
L
) CDK8.
Figure 8 — Inhibition of UFM1 expression suppresses cancer progression and is linked to the dismal prognosis and immune infiltration in oral squamous cell carcinoma | Aging