


Introduction
Lung adenocarcinoma (LAC) had a high morbidity and mortality rate [1, 2]. The prognosis of patients with early LAC could be improved by surgery and neoadjuvant chemotherapy. However, despite complete tumour resection, primary and secondary drug resistance often leaded to poor patient prognosis [2, 3]. Novel targeted therapies had enhanced the prognosis of patients with LAC. However, the overall prognosis remains unsatisfactory [4–6]. Therefore, it is of great clinical and scientific significance to elucidate the unfavourable prognostic biomarkers involved in the progression of LAC.
Mitochondrial fission regulator (MTFR) 1 was a member of the MTFR family. Mitochondrial abnormality has been related to the progression of cancer and other diseases [7–10]. Zeng et al. reported that Faciogenital Dysplasia 1 (FGD1) was upregulated in hepatocellular carcinoma (HCC), and increased FGD1 expression correlated with the progression and unfavourable prognosis of patients with HCC. Moreover, knocking out FGD1 in cancer cells significantly inhibited the malignant behaviour of HCC, causing mitochondrial dysfunction and highlighting its oncogenic properties [10]. MTFR1 was a mitochondrial regulator that played a role in regulating mitochondrial fission and cell progression [11–16]. Wang et al. reported that miR-324-5p reduced mitochondrial fission, myocardial cell apoptosis and myocardial infarction by inhibiting MTFR1 [11]. Similarly, Huang et al. found that myocardial ischemia-reperfusion injury increased the expression of the long-chain non-coding RNA (lncRNA) GPR19. The inhibition of lncRNA GPR19 expression in C57BL/6 mice improved the cardiac function and reduced the apoptosis and myocardial fibrosis scar formation. Additionally, lncRNA GPR19 reduced oxidative stress and apoptosis in neonatal rat ventricular cardiomyocytes induced by oxygen-glucose deprivation/recovery by miR-324-5p/MTFR1 [14]. Wang et al. observed that MTFR1 could be used to classify tumours based on the extracapsular spread status. In cancer patients with negative lymph nodes, the overall survival (OS) of patients with extracapsular spread-positive tumours was significantly worse [15]. Consistently, Li et al. reported that MTFR1 was overexpressed in LAC and associated with unfavourable prognosis of patients with cancer. MTFR1 could enhance the proliferation, invasion, migration and glycolysis of LAC cells [16]. However, the roles and pathways of MTFR1 in the resistance of LAC cells to cisplatin remain unreported. Therefore, this study investigates the roles and mechanisms of MTFR1 in LAC progression using comprehensive analysis, and basic research to evaluate whether MTFR1 has the potential as a therapeutic marker for patients with LAC.
Results
MTFR1 expression was increased in LAC tissues
The Cancer Genome Atlas (TCGA) and XENA database analysis revealed that MTFR1 expression was increased in LAC tissues (Figure 1 and Supplementary Figure 1). In detail, the levels of MTFR1 increased significantly in unpaired and 57 paired LAC patents from TCGA and XENA transcripts per million (TPM) type data (Figure 1A–1C), and in unpaired and 57 paired LAC patents from TCGA fragments Per Kilobase Million (FPKM) type data (Figure 1D, 1E). Additionally, MTFR1 expression levels were also significantly increased in LAC tissues based on the meta-analysis of the TCGA and Gene Expression Omnibus (GEO) databases (Supplementary Figure 1).
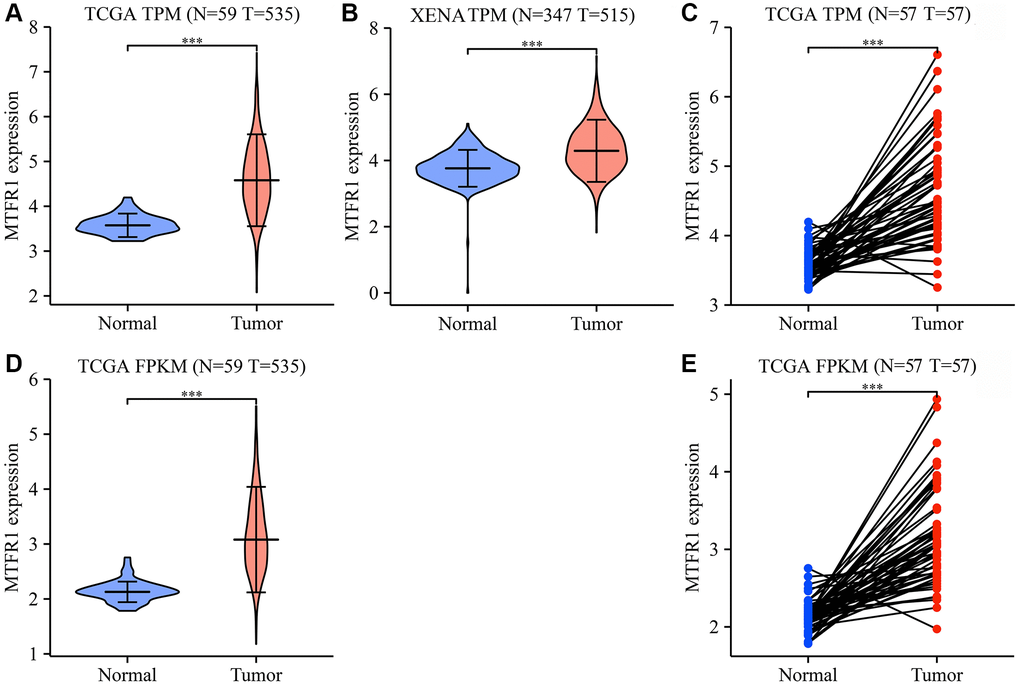
Figure 1. MTFR1 expression levels in LAC tissues from the TCGA and XENA databases. (A–C) The data of TPM type; (D, E) The data of FPKM type. Abbreviations: LAC: lung adenocarcinoma; TCGA: The Cancer Genome Atlas; TPM: transcripts per million; FPKM: Fragments Per Kilobase Million; ***P < 0.001.
MTFR1 overexpression correlated with diagnosis, sex, age, therapy outcome, smoking and T stage in patients with LAC
Receiver operating characteristic (ROC) analysis revealed that the area under the curves of MTRF1 in normal tissues and LAC tissues were 0.915, 0.744, and 0.941 based on the TPM and FPKM data from TCGA and XENA database, respectively (Figure 2). This indicated that MTRF1 has significant diagnostic values in LAC. MTFR1 expression correlated with sex, age, primary pathological outcome, smoking and the T stage of patients with LAC (Figure 3). Furthermore, in the high- and low-expression groups of MTFR1, the expression levels of MTFR1 were significantly correlated with T stage, N stage, sex and age (Table 1).
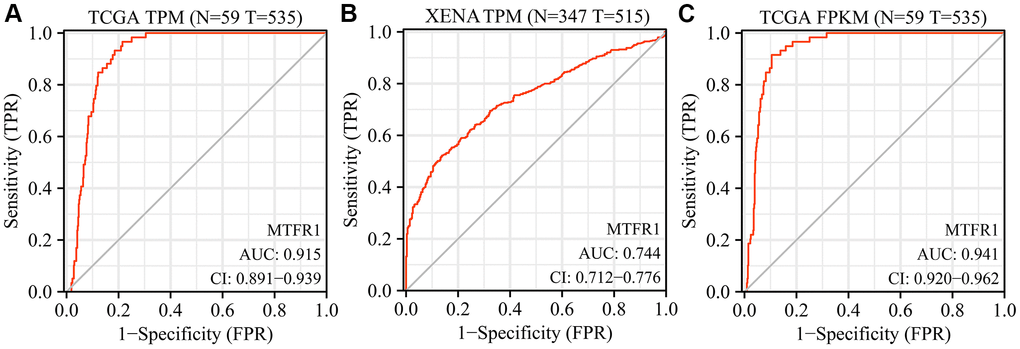
Figure 2. Diagnostic values of MTFR1 in LAC from the TCGA and XENA databases. (A, B) The data of TPM type; (C) The data of FPKM type. Abbreviations: LAC: lung adenocarcinoma; TCGA: The Cancer Genome Atlas; TPM: transcripts per million; FPKM: Fragments Per Kilobase Million.
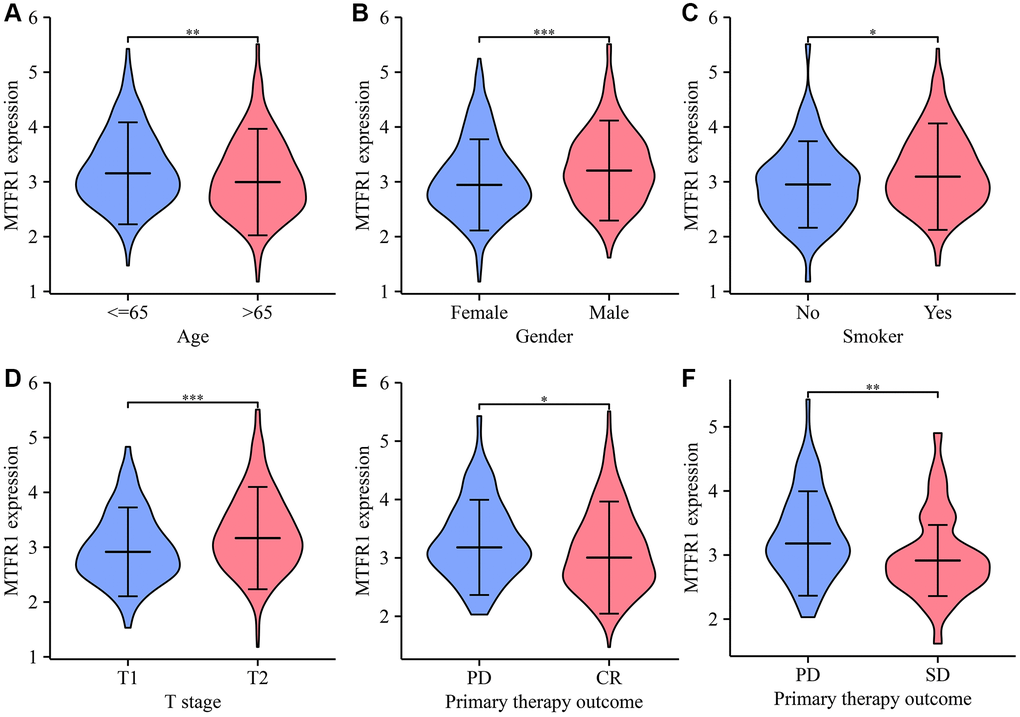
Figure 3. The levels of MTFR1 have a significant difference in the clinicopathological features of patients with LAC. (A) Age; (B) Gender; (C) Smoking; (D) T stage; (E, F) Treatment effects. Abbreviation: LAC: lung adenocarcinoma; *P < 0.05; **P < 0.01; ***P < 0.001.
Table 1. The relationship between MTFR1 expression and clinical features in LAC.
| Characteristic | Low expression of MTFR1 | High expression of MTFR1 | P | ||||||||||||||||||||||||||||||||||||||||||||||||||||||||||||||||||||||||||||||||||||||||||||||||
| T stage | 0.001 | ||||||||||||||||||||||||||||||||||||||||||||||||||||||||||||||||||||||||||||||||||||||||||||||||||
| T1 | 108 (20.3%) | 67 (12.6%) | |||||||||||||||||||||||||||||||||||||||||||||||||||||||||||||||||||||||||||||||||||||||||||||||||
| T2 | 127 (23.9%) | 162 (30.5%) | |||||||||||||||||||||||||||||||||||||||||||||||||||||||||||||||||||||||||||||||||||||||||||||||||
| T3 | 20 (3.8%) | 29 (5.5%) | |||||||||||||||||||||||||||||||||||||||||||||||||||||||||||||||||||||||||||||||||||||||||||||||||
| T4 | 11 (2.1%) | 8 (1.5%) | |||||||||||||||||||||||||||||||||||||||||||||||||||||||||||||||||||||||||||||||||||||||||||||||||
| N stage | 0.035 | ||||||||||||||||||||||||||||||||||||||||||||||||||||||||||||||||||||||||||||||||||||||||||||||||||
| N0 | 175 (33.7%) | 173 (33.3%) | |||||||||||||||||||||||||||||||||||||||||||||||||||||||||||||||||||||||||||||||||||||||||||||||||
| N1 | 54 (10.4%) | 41 (7.9%) | |||||||||||||||||||||||||||||||||||||||||||||||||||||||||||||||||||||||||||||||||||||||||||||||||
| N2 | 28 (5.4%) | 46 (8.9%) | |||||||||||||||||||||||||||||||||||||||||||||||||||||||||||||||||||||||||||||||||||||||||||||||||
| N3 | 2 (0.4%) | 0 (0%) | |||||||||||||||||||||||||||||||||||||||||||||||||||||||||||||||||||||||||||||||||||||||||||||||||
| M stage | 0.631 | ||||||||||||||||||||||||||||||||||||||||||||||||||||||||||||||||||||||||||||||||||||||||||||||||||
| M0 | 170 (44%) | 191 (49.5%) | |||||||||||||||||||||||||||||||||||||||||||||||||||||||||||||||||||||||||||||||||||||||||||||||||
| M1 | 10 (2.6%) | 15 (3.9%) | |||||||||||||||||||||||||||||||||||||||||||||||||||||||||||||||||||||||||||||||||||||||||||||||||
| Pathologic stage | 0.470 | ||||||||||||||||||||||||||||||||||||||||||||||||||||||||||||||||||||||||||||||||||||||||||||||||||
| Stage I | 154 (29.2%) | 140 (26.6%) | |||||||||||||||||||||||||||||||||||||||||||||||||||||||||||||||||||||||||||||||||||||||||||||||||
| Stage II | 60 (11.4%) | 63 (12%) | |||||||||||||||||||||||||||||||||||||||||||||||||||||||||||||||||||||||||||||||||||||||||||||||||
| Stage III | 37 (7%) | 47 (8.9%) | |||||||||||||||||||||||||||||||||||||||||||||||||||||||||||||||||||||||||||||||||||||||||||||||||
| Stage IV | 11 (2.1%) | 15 (2.8%) | |||||||||||||||||||||||||||||||||||||||||||||||||||||||||||||||||||||||||||||||||||||||||||||||||
| Gender | < 0.001 | ||||||||||||||||||||||||||||||||||||||||||||||||||||||||||||||||||||||||||||||||||||||||||||||||||
| Female | 163 (30.5%) | 123 (23%) | |||||||||||||||||||||||||||||||||||||||||||||||||||||||||||||||||||||||||||||||||||||||||||||||||
| Male | 104 (19.4%) | 145 (27.1%) | |||||||||||||||||||||||||||||||||||||||||||||||||||||||||||||||||||||||||||||||||||||||||||||||||
| Age | 0.035 | ||||||||||||||||||||||||||||||||||||||||||||||||||||||||||||||||||||||||||||||||||||||||||||||||||
| ≤65 | 115 (22.3%) | 140 (27.1%) | |||||||||||||||||||||||||||||||||||||||||||||||||||||||||||||||||||||||||||||||||||||||||||||||||
| >65 | 143 (27.7%) | 118 (22.9%) | |||||||||||||||||||||||||||||||||||||||||||||||||||||||||||||||||||||||||||||||||||||||||||||||||
| Residual tumor | 0.606 | ||||||||||||||||||||||||||||||||||||||||||||||||||||||||||||||||||||||||||||||||||||||||||||||||||
| R0 | 166 (44.6%) | 189 (50.8%) | |||||||||||||||||||||||||||||||||||||||||||||||||||||||||||||||||||||||||||||||||||||||||||||||||
| R1 | 6 (1.6%) | 7 (1.9%) | |||||||||||||||||||||||||||||||||||||||||||||||||||||||||||||||||||||||||||||||||||||||||||||||||
| R2 | 3 (0.8%) | 1 (0.3%) | |||||||||||||||||||||||||||||||||||||||||||||||||||||||||||||||||||||||||||||||||||||||||||||||||
| Smoker | 0.293 | ||||||||||||||||||||||||||||||||||||||||||||||||||||||||||||||||||||||||||||||||||||||||||||||||||
| No | 42 (8.1%) | 33 (6.3%) | |||||||||||||||||||||||||||||||||||||||||||||||||||||||||||||||||||||||||||||||||||||||||||||||||
| Yes | 217 (41.7%) | 229 (44%) | |||||||||||||||||||||||||||||||||||||||||||||||||||||||||||||||||||||||||||||||||||||||||||||||||
| OS event | 0.026 | ||||||||||||||||||||||||||||||||||||||||||||||||||||||||||||||||||||||||||||||||||||||||||||||||||
| Alive | 184 (34.4%) | 159 (29.7%) | |||||||||||||||||||||||||||||||||||||||||||||||||||||||||||||||||||||||||||||||||||||||||||||||||
| Dead | 83 (15.5%) | 109 (20.4%) | |||||||||||||||||||||||||||||||||||||||||||||||||||||||||||||||||||||||||||||||||||||||||||||||||
| DSS event | 0.071 | ||||||||||||||||||||||||||||||||||||||||||||||||||||||||||||||||||||||||||||||||||||||||||||||||||
| Alive | 199 (39.9%) | 180 (36.1%) | |||||||||||||||||||||||||||||||||||||||||||||||||||||||||||||||||||||||||||||||||||||||||||||||||
| Dead | 51 (10.2%) | 69 (13.8%) | |||||||||||||||||||||||||||||||||||||||||||||||||||||||||||||||||||||||||||||||||||||||||||||||||
| PFI event | 0.202 | ||||||||||||||||||||||||||||||||||||||||||||||||||||||||||||||||||||||||||||||||||||||||||||||||||
| Alive | 162 (30.3%) | 147 (27.5%) | |||||||||||||||||||||||||||||||||||||||||||||||||||||||||||||||||||||||||||||||||||||||||||||||||
| Dead | 105 (19.6%) | 121 (22.6%) | |||||||||||||||||||||||||||||||||||||||||||||||||||||||||||||||||||||||||||||||||||||||||||||||||
| Abbreviations: LAC: lung adenocarcinoma; OS: overall survival; DSS: disease-specific survival; PFI: progression-free interval. | |||||||||||||||||||||||||||||||||||||||||||||||||||||||||||||||||||||||||||||||||||||||||||||||||||
MTFR1 overexpression correlated with unfavourable prognosis in patients with LAC
Kaplan Meier (K-M) survival analysis revealed that increased MTFR1 expression was significantly associated with unfavourable OS, disease-specific survival (DSS), and progression-free interval (PFI) in patients with LAC based on the data of the FPKM type (Figure 4). Consistently, the Lung cancer explorer (LCE) database analysis also revealed that patients with high MTFR1 expression had an unfavourable prognosis (Figure 5). Additionally, univariate COX regression analysis revealed that T stage, N stage, M stage, pathological stage and MTFR1 overexpression were the risk factors for unfavourable OS (Table 2). Moreover, the T stage, N stage, M stage and pathological stage were the risk factors for unfavourable DSS (Table 3). Additionally, T stage, N stage, pathological stage and MTFR1 overexpression were the risk factors for unfavourable PFI (Table 4). The MTFR1-related nomograms in the OS and PFI were established based on the results of Cox analysis to assess the survival time of patients with cancer (Figure 6).
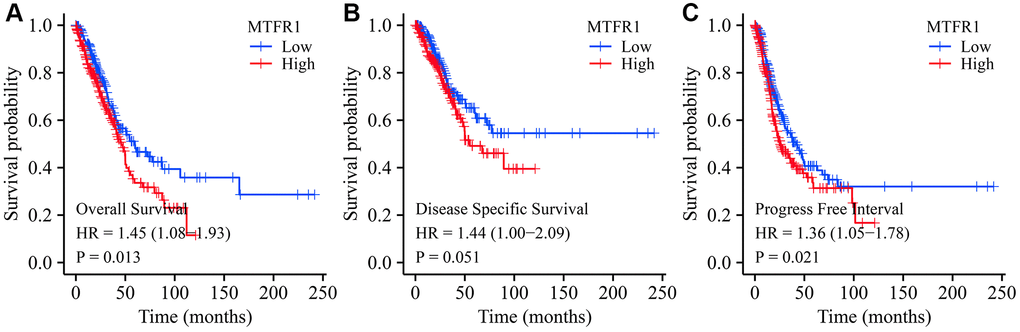
Figure 4. Prognostic values of MTFR1 in LAC from the TCGA database. (A) Overall survival; (B) DSS; (C) PFI. Abbreviations: LAC: lung adenocarcinoma; DSS: disease-free survival; PFI: progression-free interval; TCGA: The Cancer Genome Atlas.
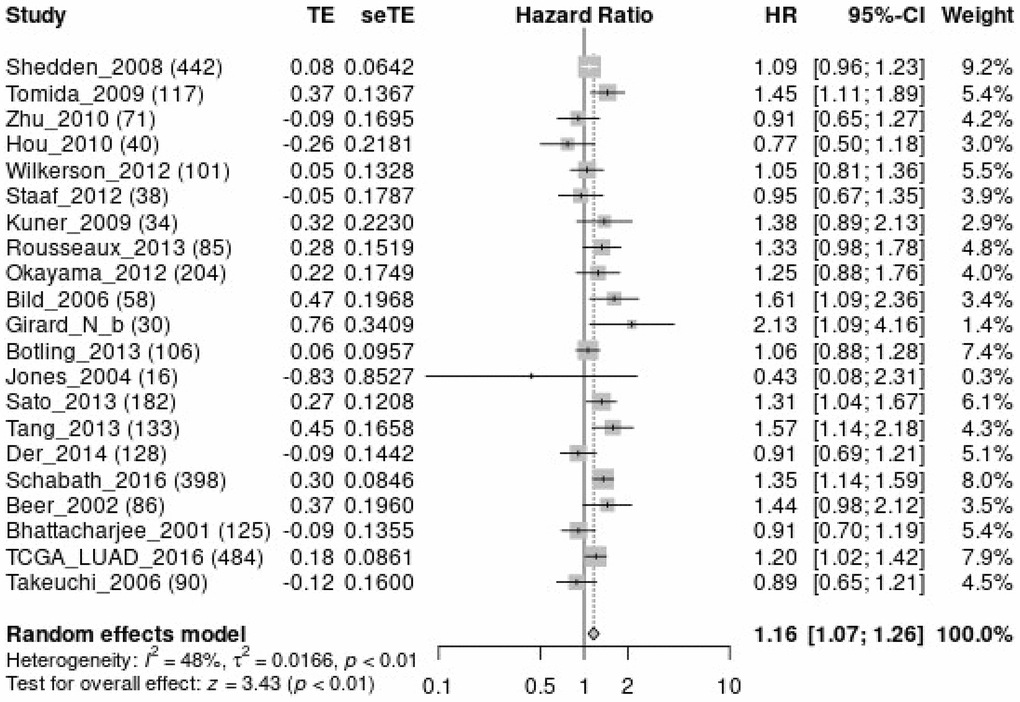
Figure 5. MTFR1 over-expression was related to the overall survival time in patients with LAC using meta-analysis. Abbreviations: LAC: lung adenocarcinoma.
Table 2. Risk factors affecting OS in LAC.
| Characteristics | N | HR (95% CI) | P | ||||||||||||||||||||||||||||||||||||||||||||||||||||||||||||||||||||||||||||||||||||||||||||||||
| T stage | 523 | ||||||||||||||||||||||||||||||||||||||||||||||||||||||||||||||||||||||||||||||||||||||||||||||||||
| T1 | 175 | Reference | |||||||||||||||||||||||||||||||||||||||||||||||||||||||||||||||||||||||||||||||||||||||||||||||||
| T2 | 282 | 1.521 (1.068–2.166) | 0.020 | ||||||||||||||||||||||||||||||||||||||||||||||||||||||||||||||||||||||||||||||||||||||||||||||||
| T3 | 47 | 2.937 (1.746–4.941) | <0.001 | ||||||||||||||||||||||||||||||||||||||||||||||||||||||||||||||||||||||||||||||||||||||||||||||||
| T4 | 19 | 3.326 (1.751–6.316) | <0.001 | ||||||||||||||||||||||||||||||||||||||||||||||||||||||||||||||||||||||||||||||||||||||||||||||||
| N stage | 510 | ||||||||||||||||||||||||||||||||||||||||||||||||||||||||||||||||||||||||||||||||||||||||||||||||||
| N0 | 343 | Reference | |||||||||||||||||||||||||||||||||||||||||||||||||||||||||||||||||||||||||||||||||||||||||||||||||
| N1 | 94 | 2.381 (1.695–3.346) | <0.001 | ||||||||||||||||||||||||||||||||||||||||||||||||||||||||||||||||||||||||||||||||||||||||||||||||
| N2 | 71 | 3.108 (2.136–4.521) | <0.001 | ||||||||||||||||||||||||||||||||||||||||||||||||||||||||||||||||||||||||||||||||||||||||||||||||
| N3 | 2 | 0.000 (0.000–Inf) | 0.994 | ||||||||||||||||||||||||||||||||||||||||||||||||||||||||||||||||||||||||||||||||||||||||||||||||
| M stage | 377 | ||||||||||||||||||||||||||||||||||||||||||||||||||||||||||||||||||||||||||||||||||||||||||||||||||
| M0 | 352 | Reference | |||||||||||||||||||||||||||||||||||||||||||||||||||||||||||||||||||||||||||||||||||||||||||||||||
| M1 | 25 | 2.136 (1.248–3.653) | 0.006 | ||||||||||||||||||||||||||||||||||||||||||||||||||||||||||||||||||||||||||||||||||||||||||||||||
| Pathologic stage | 518 | ||||||||||||||||||||||||||||||||||||||||||||||||||||||||||||||||||||||||||||||||||||||||||||||||||
| Stage I | 290 | Reference | |||||||||||||||||||||||||||||||||||||||||||||||||||||||||||||||||||||||||||||||||||||||||||||||||
| Stage II | 121 | 2.418 (1.691–3.457) | <0.001 | ||||||||||||||||||||||||||||||||||||||||||||||||||||||||||||||||||||||||||||||||||||||||||||||||
| Stage III | 81 | 3.544 (2.437–5.154) | <0.001 | ||||||||||||||||||||||||||||||||||||||||||||||||||||||||||||||||||||||||||||||||||||||||||||||||
| Stage IV | 26 | 3.790 (2.193–6.548) | <0.001 | ||||||||||||||||||||||||||||||||||||||||||||||||||||||||||||||||||||||||||||||||||||||||||||||||
| Gender | 526 | ||||||||||||||||||||||||||||||||||||||||||||||||||||||||||||||||||||||||||||||||||||||||||||||||||
| Female | 280 | Reference | |||||||||||||||||||||||||||||||||||||||||||||||||||||||||||||||||||||||||||||||||||||||||||||||||
| Male | 246 | 1.070 (0.803–1.426) | 0.642 | ||||||||||||||||||||||||||||||||||||||||||||||||||||||||||||||||||||||||||||||||||||||||||||||||
| Age | 516 | ||||||||||||||||||||||||||||||||||||||||||||||||||||||||||||||||||||||||||||||||||||||||||||||||||
| ≤65 | 255 | Reference | |||||||||||||||||||||||||||||||||||||||||||||||||||||||||||||||||||||||||||||||||||||||||||||||||
| >65 | 261 | 1.223 (0.916–1.635) | 0.172 | ||||||||||||||||||||||||||||||||||||||||||||||||||||||||||||||||||||||||||||||||||||||||||||||||
| Smoker | 512 | ||||||||||||||||||||||||||||||||||||||||||||||||||||||||||||||||||||||||||||||||||||||||||||||||||
| No | 72 | Reference | |||||||||||||||||||||||||||||||||||||||||||||||||||||||||||||||||||||||||||||||||||||||||||||||||
| Yes | 440 | 0.894 (0.592–1.348) | 0.591 | ||||||||||||||||||||||||||||||||||||||||||||||||||||||||||||||||||||||||||||||||||||||||||||||||
| MTFR1 | 526 | ||||||||||||||||||||||||||||||||||||||||||||||||||||||||||||||||||||||||||||||||||||||||||||||||||
| Low | 262 | Reference | |||||||||||||||||||||||||||||||||||||||||||||||||||||||||||||||||||||||||||||||||||||||||||||||||
| High | 264 | 1.446 (1.081–1.935) | 0.013 | ||||||||||||||||||||||||||||||||||||||||||||||||||||||||||||||||||||||||||||||||||||||||||||||||
| Abbreviations: LAC: lung adenocarcinoma; OS: overall survival. | |||||||||||||||||||||||||||||||||||||||||||||||||||||||||||||||||||||||||||||||||||||||||||||||||||
Table 3. Risk factors affecting DSS in LAC.
| Characteristics | N | HR (95% CI) | P | ||||||||||||||||||||||||||||||||||||||||||||||||||||||||||||||||||||||||||||||||||||||||||||||||
| T stage | 488 | ||||||||||||||||||||||||||||||||||||||||||||||||||||||||||||||||||||||||||||||||||||||||||||||||||
| T1 | 168 | Reference | |||||||||||||||||||||||||||||||||||||||||||||||||||||||||||||||||||||||||||||||||||||||||||||||||
| T2 | 262 | 1.701 (1.085–2.668) | 0.021 | ||||||||||||||||||||||||||||||||||||||||||||||||||||||||||||||||||||||||||||||||||||||||||||||||
| T3 | 43 | 2.846 (1.453–5.572) | 0.002 | ||||||||||||||||||||||||||||||||||||||||||||||||||||||||||||||||||||||||||||||||||||||||||||||||
| T4 | 15 | 2.770 (1.061–7.230) | 0.037 | ||||||||||||||||||||||||||||||||||||||||||||||||||||||||||||||||||||||||||||||||||||||||||||||||
| N stage | 475 | ||||||||||||||||||||||||||||||||||||||||||||||||||||||||||||||||||||||||||||||||||||||||||||||||||
| N0 | 327 | Reference | |||||||||||||||||||||||||||||||||||||||||||||||||||||||||||||||||||||||||||||||||||||||||||||||||
| N1 | 83 | 2.751 (1.808–4.185) | <0.001 | ||||||||||||||||||||||||||||||||||||||||||||||||||||||||||||||||||||||||||||||||||||||||||||||||
| N2 | 63 | 2.762 (1.698–4.493) | <0.001 | ||||||||||||||||||||||||||||||||||||||||||||||||||||||||||||||||||||||||||||||||||||||||||||||||
| N3 | 2 | 0.000 (0.000–Inf) | 0.995 | ||||||||||||||||||||||||||||||||||||||||||||||||||||||||||||||||||||||||||||||||||||||||||||||||
| M stage | 344 | ||||||||||||||||||||||||||||||||||||||||||||||||||||||||||||||||||||||||||||||||||||||||||||||||||
| M0 | 323 | Reference | |||||||||||||||||||||||||||||||||||||||||||||||||||||||||||||||||||||||||||||||||||||||||||||||||
| M1 | 21 | 2.455 (1.269–4.749) | 0.008 | ||||||||||||||||||||||||||||||||||||||||||||||||||||||||||||||||||||||||||||||||||||||||||||||||
| Pathologic stage | 483 | ||||||||||||||||||||||||||||||||||||||||||||||||||||||||||||||||||||||||||||||||||||||||||||||||||
| Stage I | 277 | Reference | |||||||||||||||||||||||||||||||||||||||||||||||||||||||||||||||||||||||||||||||||||||||||||||||||
| Stage II | 112 | 3.017 (1.931–4.715) | <0.001 | ||||||||||||||||||||||||||||||||||||||||||||||||||||||||||||||||||||||||||||||||||||||||||||||||
| Stage III | 72 | 3.326 (2.028–5.457) | <0.001 | ||||||||||||||||||||||||||||||||||||||||||||||||||||||||||||||||||||||||||||||||||||||||||||||||
| Stage IV | 22 | 4.632 (2.371–9.050) | <0.001 | ||||||||||||||||||||||||||||||||||||||||||||||||||||||||||||||||||||||||||||||||||||||||||||||||
| Gender | 491 | ||||||||||||||||||||||||||||||||||||||||||||||||||||||||||||||||||||||||||||||||||||||||||||||||||
| Female | 262 | Reference | |||||||||||||||||||||||||||||||||||||||||||||||||||||||||||||||||||||||||||||||||||||||||||||||||
| Male | 229 | 0.989 (0.687–1.424) | 0.954 | ||||||||||||||||||||||||||||||||||||||||||||||||||||||||||||||||||||||||||||||||||||||||||||||||
| Age | 481 | ||||||||||||||||||||||||||||||||||||||||||||||||||||||||||||||||||||||||||||||||||||||||||||||||||
| ≤65 | 243 | Reference | |||||||||||||||||||||||||||||||||||||||||||||||||||||||||||||||||||||||||||||||||||||||||||||||||
| >65 | 238 | 1.013 (0.701–1.464) | 0.944 | ||||||||||||||||||||||||||||||||||||||||||||||||||||||||||||||||||||||||||||||||||||||||||||||||
| Smoker | 477 | ||||||||||||||||||||||||||||||||||||||||||||||||||||||||||||||||||||||||||||||||||||||||||||||||||
| No | 69 | Reference | |||||||||||||||||||||||||||||||||||||||||||||||||||||||||||||||||||||||||||||||||||||||||||||||||
| Yes | 408 | 1.040 (0.602–1.796) | 0.889 | ||||||||||||||||||||||||||||||||||||||||||||||||||||||||||||||||||||||||||||||||||||||||||||||||
| MTFR1 | 491 | ||||||||||||||||||||||||||||||||||||||||||||||||||||||||||||||||||||||||||||||||||||||||||||||||||
| Low | 245 | Reference | |||||||||||||||||||||||||||||||||||||||||||||||||||||||||||||||||||||||||||||||||||||||||||||||||
| High | 246 | 1.443 (0.998–2.086) | 0.051 | ||||||||||||||||||||||||||||||||||||||||||||||||||||||||||||||||||||||||||||||||||||||||||||||||
| Abbreviations: LAC: lung adenocarcinoma; DSS: disease-specific survival. | |||||||||||||||||||||||||||||||||||||||||||||||||||||||||||||||||||||||||||||||||||||||||||||||||||
Table 4. Risk factors affecting PFI in LAC.
| Characteristics | N | HR (95% CI) | P | ||||||||||||||||||||||||||||||||||||||||||||||||||||||||||||||||||||||||||||||||||||||||||||||||
| T stage | 523 | ||||||||||||||||||||||||||||||||||||||||||||||||||||||||||||||||||||||||||||||||||||||||||||||||||
| T1 | 175 | Reference | |||||||||||||||||||||||||||||||||||||||||||||||||||||||||||||||||||||||||||||||||||||||||||||||||
| T2 | 282 | 1.758 (1.276–2.422) | <0.001 | ||||||||||||||||||||||||||||||||||||||||||||||||||||||||||||||||||||||||||||||||||||||||||||||||
| T3 | 47 | 3.495 (2.199–5.556) | <0.001 | ||||||||||||||||||||||||||||||||||||||||||||||||||||||||||||||||||||||||||||||||||||||||||||||||
| T4 | 19 | 1.113 (0.444–2.791) | 0.819 | ||||||||||||||||||||||||||||||||||||||||||||||||||||||||||||||||||||||||||||||||||||||||||||||||
| N stage | 510 | ||||||||||||||||||||||||||||||||||||||||||||||||||||||||||||||||||||||||||||||||||||||||||||||||||
| N0 | 343 | Reference | |||||||||||||||||||||||||||||||||||||||||||||||||||||||||||||||||||||||||||||||||||||||||||||||||
| N1 | 94 | 1.540 (1.118–2.122) | 0.008 | ||||||||||||||||||||||||||||||||||||||||||||||||||||||||||||||||||||||||||||||||||||||||||||||||
| N2 | 71 | 1.498 (1.018–2.205) | 0.040 | ||||||||||||||||||||||||||||||||||||||||||||||||||||||||||||||||||||||||||||||||||||||||||||||||
| N3 | 2 | 0.906 (0.127–6.485) | 0.922 | ||||||||||||||||||||||||||||||||||||||||||||||||||||||||||||||||||||||||||||||||||||||||||||||||
| M stage | 377 | ||||||||||||||||||||||||||||||||||||||||||||||||||||||||||||||||||||||||||||||||||||||||||||||||||
| M0 | 352 | Reference | |||||||||||||||||||||||||||||||||||||||||||||||||||||||||||||||||||||||||||||||||||||||||||||||||
| M1 | 25 | 1.513 (0.855–2.676) | 0.155 | ||||||||||||||||||||||||||||||||||||||||||||||||||||||||||||||||||||||||||||||||||||||||||||||||
| Pathologic stage | 518 | ||||||||||||||||||||||||||||||||||||||||||||||||||||||||||||||||||||||||||||||||||||||||||||||||||
| Stage I | 290 | Reference | |||||||||||||||||||||||||||||||||||||||||||||||||||||||||||||||||||||||||||||||||||||||||||||||||
| Stage II | 121 | 2.013 (1.478–2.742) | <0.001 | ||||||||||||||||||||||||||||||||||||||||||||||||||||||||||||||||||||||||||||||||||||||||||||||||
| Stage III | 81 | 1.831 (1.257–2.669) | 0.002 | ||||||||||||||||||||||||||||||||||||||||||||||||||||||||||||||||||||||||||||||||||||||||||||||||
| Stage IV | 26 | 2.086 (1.189–3.657) | 0.010 | ||||||||||||||||||||||||||||||||||||||||||||||||||||||||||||||||||||||||||||||||||||||||||||||||
| Gender | 526 | ||||||||||||||||||||||||||||||||||||||||||||||||||||||||||||||||||||||||||||||||||||||||||||||||||
| Female | 280 | Reference | |||||||||||||||||||||||||||||||||||||||||||||||||||||||||||||||||||||||||||||||||||||||||||||||||
| Male | 246 | 1.172 (0.901–1.526) | 0.236 | ||||||||||||||||||||||||||||||||||||||||||||||||||||||||||||||||||||||||||||||||||||||||||||||||
| Age | 516 | ||||||||||||||||||||||||||||||||||||||||||||||||||||||||||||||||||||||||||||||||||||||||||||||||||
| ≤65 | 255 | Reference | |||||||||||||||||||||||||||||||||||||||||||||||||||||||||||||||||||||||||||||||||||||||||||||||||
| >65 | 261 | 1.023 (0.784–1.335) | 0.867 | ||||||||||||||||||||||||||||||||||||||||||||||||||||||||||||||||||||||||||||||||||||||||||||||||
| Smoker | 512 | ||||||||||||||||||||||||||||||||||||||||||||||||||||||||||||||||||||||||||||||||||||||||||||||||||
| No | 72 | Reference | |||||||||||||||||||||||||||||||||||||||||||||||||||||||||||||||||||||||||||||||||||||||||||||||||
| Yes | 440 | 0.968 (0.658–1.426) | 0.870 | ||||||||||||||||||||||||||||||||||||||||||||||||||||||||||||||||||||||||||||||||||||||||||||||||
| MTFR1 | 526 | ||||||||||||||||||||||||||||||||||||||||||||||||||||||||||||||||||||||||||||||||||||||||||||||||||
| Low | 262 | Reference | |||||||||||||||||||||||||||||||||||||||||||||||||||||||||||||||||||||||||||||||||||||||||||||||||
| High | 264 | 1.364 (1.048–1.775) | 0.021 | ||||||||||||||||||||||||||||||||||||||||||||||||||||||||||||||||||||||||||||||||||||||||||||||||
| Abbreviations: LAC: lung adenocarcinoma; PFI: progress free interval. | |||||||||||||||||||||||||||||||||||||||||||||||||||||||||||||||||||||||||||||||||||||||||||||||||||
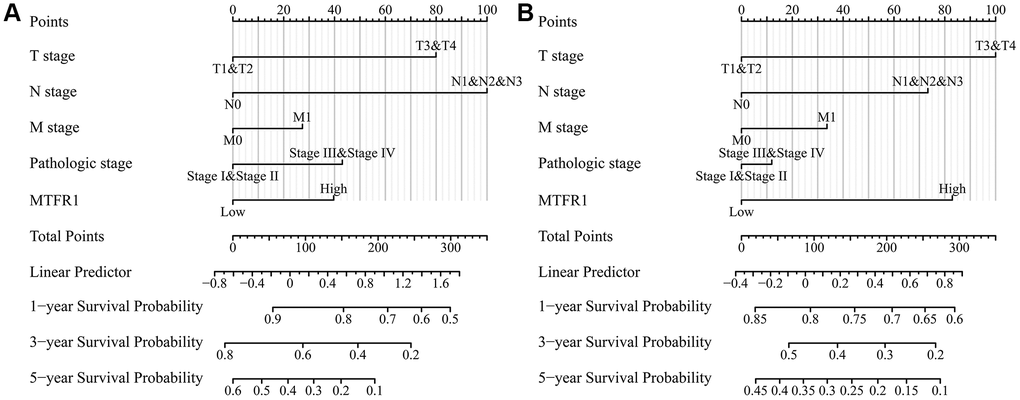
Figure 6. MTFR1-related prognosis nomograms. (A) Overall survival; (B) Progression-free interval.
Inhibition of MTFR1 expression reduces LAC cell growth and migration
A total of 391 MTFR1 co-expressed genes were positively related genes and 106 MTFR1 co-expressed genes were reversely related. Kyoto Encyclopedia of Genes and Genomes (KEGG) results showed that MTFR1 co-expressed genes were involved in the cell cycle, oocyte meiosis, DNA replication and other functions (Table 5). Figure 7A, 7B display the successfully constructed cell model. Additionally, the suppression of MTFR1 expression inhibited A549 cell proliferation, migration and invasion (Figure 7C–7E). Thus, these findings suggest that MTFR1 could reduce LAC cell growth and migration.
Table 5. The pathways of MTFR1 co-expressed genes.
| Term | Count | P |
| hsa04110: Cell cycle | 17 | 1.41E-07 |
| hsa03013: Nucleocytoplasmic transport | 12 | 1.07E-04 |
| hsa04114: Oocyte meiosis | 12 | 5.84E-04 |
| hsa04914: Progesterone-mediated oocyte maturation | 10 | 0.001291734 |
| hsa05166: Human T-cell leukemia virus 1 infection | 15 | 0.001904315 |
| hsa03030: DNA replication | 6 | 0.002212666 |
| hsa04218: Cellular senescence | 12 | 0.002431519 |
| hsa05170: Human immunodeficiency virus 1 infection | 13 | 0.009207311 |
| hsa03430: Mismatch repair | 4 | 0.020901599 |
| hsa03008: Ribosome biogenesis in eukaryotes | 8 | 0.02318999 |
| hsa04940: Type I diabetes mellitus | 5 | 0.024827891 |
| hsa05161: Hepatitis B | 10 | 0.025215676 |
| hsa05145: Toxoplasmosis | 8 | 0.026436598 |
| hsa05014: Amyotrophic lateral sclerosis | 17 | 0.027499011 |
| hsa04658: Th1 and Th2 cell differentiation | 7 | 0.032266665 |
| hsa03420: Nucleotide excision repair | 5 | 0.03313789 |
| hsa05323: Rheumatoid arthritis | 7 | 0.033774004 |
| hsa04672: Intestinal immune network for IgA production | 5 | 0.037832199 |
| hsa04640: Hematopoietic cell lineage | 7 | 0.043773992 |
| hsa05012: Parkinson disease | 13 | 0.044461525 |
| hsa05152: Tuberculosis | 10 | 0.045088011 |
| hsa05310: Asthma | 4 | 0.045634287 |
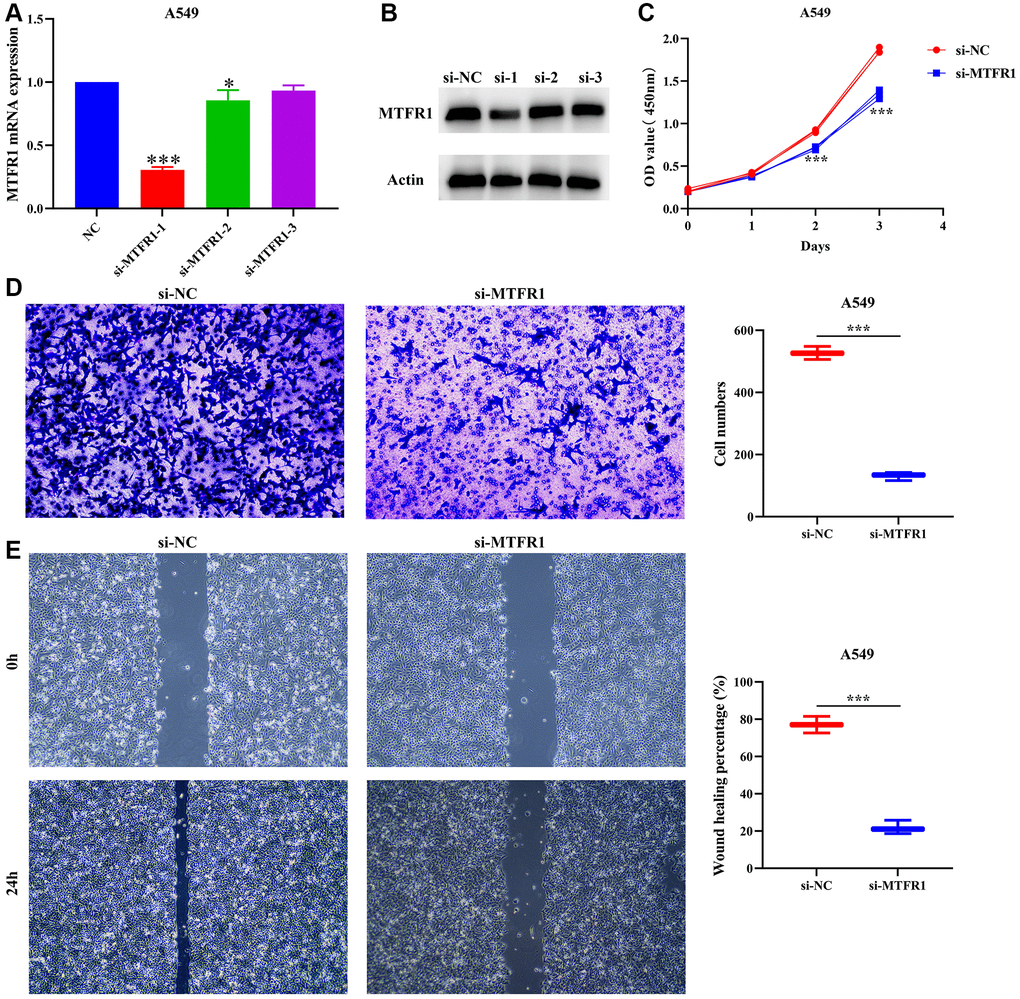
Figure 7. Inhibition of MTFR1 expression could delay the proliferation, migration and invasion of A549 cells. (A, B) Construction of cell model with downregulated MTFR1 expression; (C) Cell proliferation; (D) Cell invasion; (E) Cell migration. *P < 0.05; ***P < 0.001.
Inhibition of MTFR1 expression promotes the sensitivity of LAC cells to cisplatin through p-AKT and p-ERK/p38 mechanisms
In our cell model, cell Counting Kit-8 (CCK-8), migration and invasion assays revealed that the suppression of MTFR1 expression could inhibit A549/DDP cell proliferation, migration and invasion and promote the sensitivity of A549/DDP cells to cisplatin (Figure 8A–8F). Furthermore, the inhibition of MTFR1 expression downregulated the phosphorylation levels of extracellular regulated protein kinases (ERK), AKT serine/threonine kinase 1 (AKT) and P38 in A549 and A549/DDP cells, whereas the effects on the ERK, AKT and P38 were not significant, as shown using quantitative reverse transcription polymerase chain reaction (qRT-PCR) and western blotting (Figure 9). This suggests that MTFR1 expression promotes cell progression and the drug resistance of LAC cells to cisplatin through p-AKT and p-ERK/P38 mechanisms.
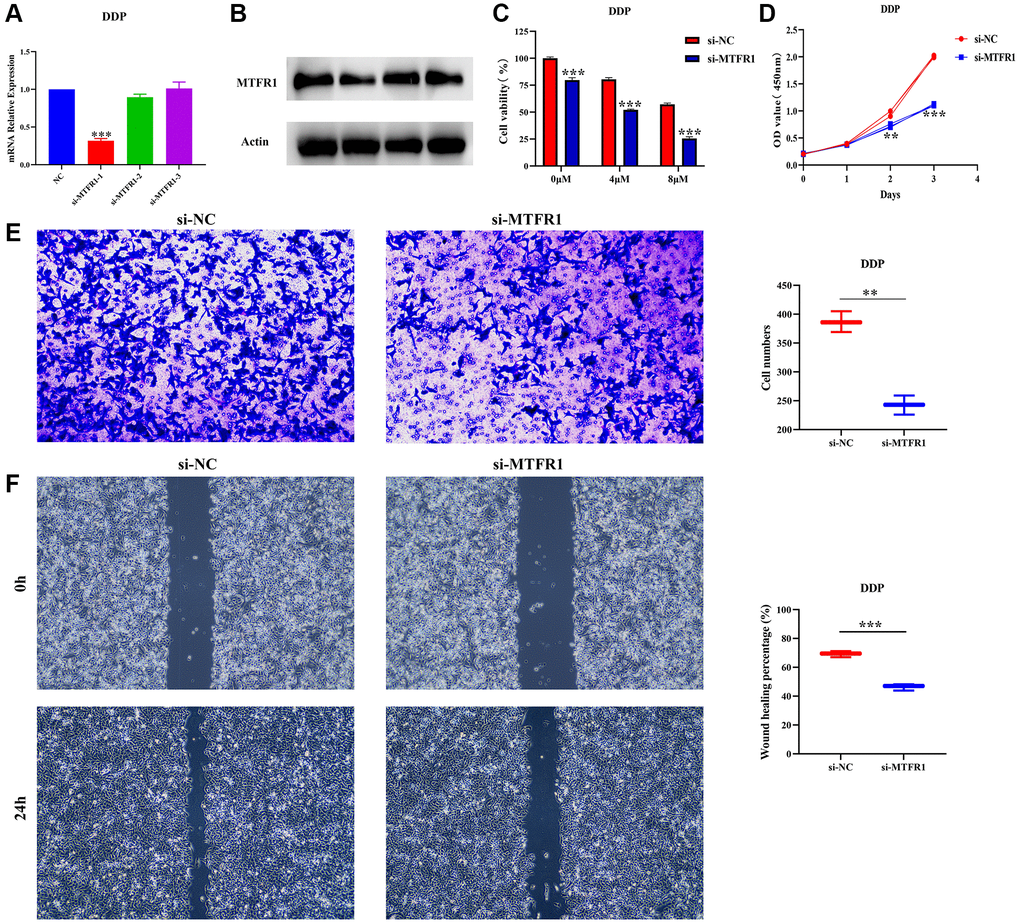
Figure 8. Inhibition of MTFR1 expression could delay the progression and promote the sensitivity to cisplatin of A549/DDP cells. (A, B) Construction of cell model with downregulated MTFR1 expression; (C) Cell viability; (D) Cell proliferation; (E) Cell invasion; (F) Cell migration. *P < 0.05; **P < 0.01; ***P < 0.001.
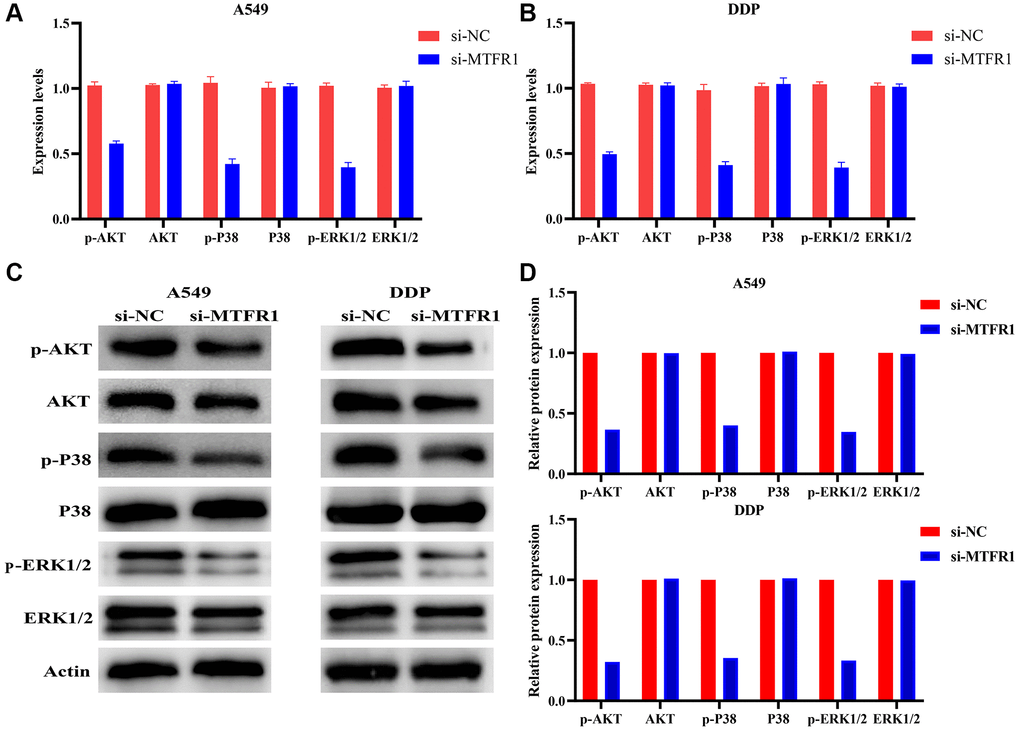
Figure 9. Inhibition of MTFR1 expression could promote the sensitivity to cisplatin of LAC cells via the p-AKT and p-ERK/P38 signalling pathways. (A) mRNA expression in A549 cells; (B) mRNA expression in A549/DDP cells; (C) Protein expression in A549 and A549/DDP cells; (D) Protein expression of statistics analysis. Abbreviation: LAC: lung adenocarcinoma.
MTFR1 expression was correlated with LAC immune infiltration
MTFR1 overexpression was negatively correlated with stromal score (r = −0.158), immune score (r = −0.275) and ESTIMATE score (r = −0.239) (Figure 10A–10C). Stromal score, immune score and ESTIMATE score were statistically significant in the high- and low-MTFR1 expression groups (Figure 10D–10F). Moreover, MTFR1 expression levels were also significantly correlated with natural killer (NK) cells, pDCs, IDC, Th2 cells, DCs, eosinophils, mast cells, TFH, Treg, Th1 cells, macrophages, CD56 bright NK cells, Tgd, aDC, CD8 T cells, neutrophils, cytotoxic cells, T cells, Th17 cells and B cells (Figure 11 and Supplementary Figure 2). Additionally, B cells, aDC, Th2 cells and other immune cells were statistically significant in the high- and low-MTFR1 expression groups (Supplementary Figure 3). MTFR1 overexpression significantly correlated with LAC immune cell markers (such as HLA-DPB1, HLA-DQB1, HLA-DPA1, STAT5A, ITGAM, HLA-DRA, PD-1 and others) (Figure 12 and Table 6).

Figure 10. MTFR1 expression correlated with the LAC immune microenvironment. (A) Immune score; (B) Stromal score; (C) ESTIMATE score (D–F) Stromal, immune and ESTIMATE scores were statistically significant in high- and low-MTFR1 groups. Abbreviation: LAC: lung adenocarcinoma.
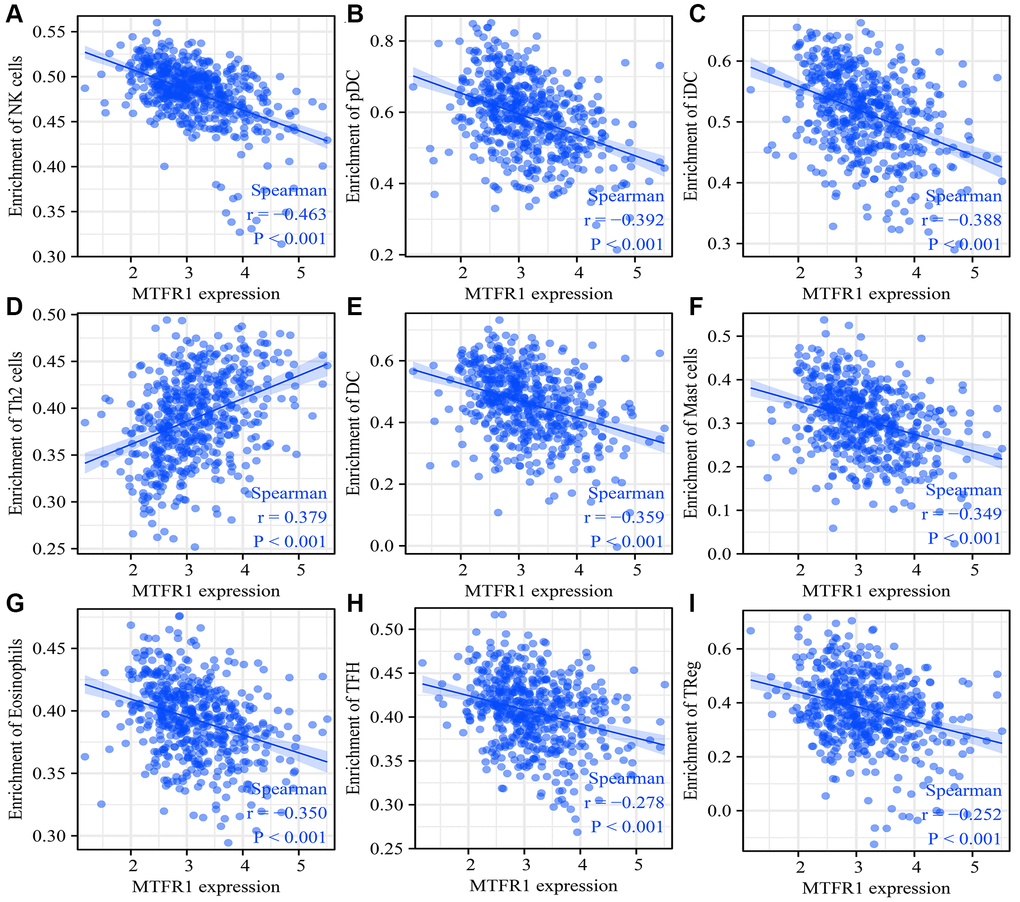
Figure 11. MTFR1 expression correlated with the LAC immune cells. (A) Natural killer cells; (B) pDCs; (C) IDC; (D) Th2 cells; (E) DCs; (F) Mast cells; (G) Eosinophils; (H)TFH; (I) Treg. Abbreviation: LAC: lung adenocarcinoma.
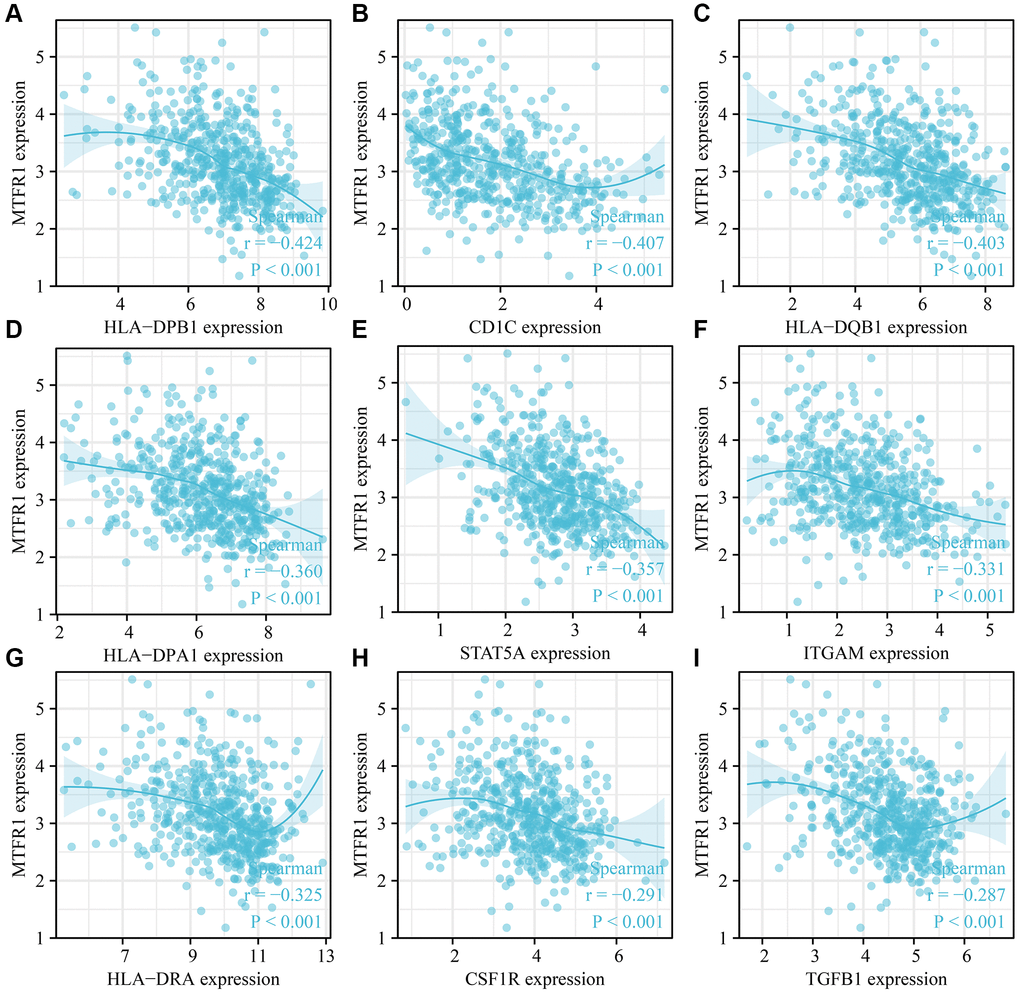
Figure 12. MTFR1 expression correlated with the LAC immune cell markers. (A) HLA-DPB1; (B) CD1C; (C) HLA-DQB1; (D) HLA-DPA1; (E) STAT5A; (F) ITGAM; (G) HLA-DRA; (H) CSF1R; (I) TGFB1. Abbreviation: LAC: lung adenocarcinoma.
Table 6. MTFR1 expression levels correlate with immune molecules of LAC.
| Gene | Cor | P | Gene | Cor | P | ||||||||||||||||||||||||||||||||||||||||||||||||||||||||||||||||||||||||||||||||||||||||||||||
| CD8A | 0.003 | 0.950 | HLA-DQB1 | −0.403 | <0.001 | ||||||||||||||||||||||||||||||||||||||||||||||||||||||||||||||||||||||||||||||||||||||||||||||
| CD8B | 0.024 | 0.578 | HLA-DRA | −0.325 | <0.001 | ||||||||||||||||||||||||||||||||||||||||||||||||||||||||||||||||||||||||||||||||||||||||||||||
| CD3D | −0.123 | 0.004 | HLA-DPA1 | −0.360 | <0.001 | ||||||||||||||||||||||||||||||||||||||||||||||||||||||||||||||||||||||||||||||||||||||||||||||
| CD3E | −0.223 | <0.001 | CD1C | −0.407 | <0.001 | ||||||||||||||||||||||||||||||||||||||||||||||||||||||||||||||||||||||||||||||||||||||||||||||
| CD2 | −0.167 | <0.001 | NRP1 | 0.068 | 0.118 | ||||||||||||||||||||||||||||||||||||||||||||||||||||||||||||||||||||||||||||||||||||||||||||||
| CD19 | −0.139 | 0.001 | ITGAX | −0.279 | <0.001 | ||||||||||||||||||||||||||||||||||||||||||||||||||||||||||||||||||||||||||||||||||||||||||||||
| CD79A | −0.118 | 0.006 | TBX21 | −0.201 | <0.001 | ||||||||||||||||||||||||||||||||||||||||||||||||||||||||||||||||||||||||||||||||||||||||||||||
| CD86 | −0.112 | 0.010 | STAT4 | −0.163 | <0.001 | ||||||||||||||||||||||||||||||||||||||||||||||||||||||||||||||||||||||||||||||||||||||||||||||
| CSF1R | −0.291 | <0.001 | STAT1 | 0.115 | 0.008 | ||||||||||||||||||||||||||||||||||||||||||||||||||||||||||||||||||||||||||||||||||||||||||||||
| CCL2 | −0.166 | <0.001 | IFNG | 0.113 | 0.009 | ||||||||||||||||||||||||||||||||||||||||||||||||||||||||||||||||||||||||||||||||||||||||||||||
| CD68 | −0.269 | <0.001 | TNF | −0.153 | <0.001 | ||||||||||||||||||||||||||||||||||||||||||||||||||||||||||||||||||||||||||||||||||||||||||||||
| IL10 | −0.013 | 0.770 | GATA3 | −0.187 | <0.001 | ||||||||||||||||||||||||||||||||||||||||||||||||||||||||||||||||||||||||||||||||||||||||||||||
| NOS2 | −0.064 | 0.137 | STAT6 | −0.275 | <0.001 | ||||||||||||||||||||||||||||||||||||||||||||||||||||||||||||||||||||||||||||||||||||||||||||||
| IRF5 | −0.231 | <0.001 | STAT5A | −0.357 | <0.001 | ||||||||||||||||||||||||||||||||||||||||||||||||||||||||||||||||||||||||||||||||||||||||||||||
| PTGS2 | 0.122 | 0.005 | IL13 | −0.099 | 0.022 | ||||||||||||||||||||||||||||||||||||||||||||||||||||||||||||||||||||||||||||||||||||||||||||||
| CD163 | −0.058 | 0.177 | BCL6 | −0.138 | 0.001 | ||||||||||||||||||||||||||||||||||||||||||||||||||||||||||||||||||||||||||||||||||||||||||||||
| VSIG4 | −0.115 | 0.008 | IL21 | 0.068 | 0.115 | ||||||||||||||||||||||||||||||||||||||||||||||||||||||||||||||||||||||||||||||||||||||||||||||
| MS4A4A | −0.079 | 0.068 | STAT3 | −0.039 | 0.362 | ||||||||||||||||||||||||||||||||||||||||||||||||||||||||||||||||||||||||||||||||||||||||||||||
| CEACAM8 | −0.235 | <0.001 | IL17A | 0.030 | 0.489 | ||||||||||||||||||||||||||||||||||||||||||||||||||||||||||||||||||||||||||||||||||||||||||||||
| ITGAM | −0.331 | <0.001 | FOXP3 | −0.267 | <0.001 | ||||||||||||||||||||||||||||||||||||||||||||||||||||||||||||||||||||||||||||||||||||||||||||||
| CCR7 | −0.269 | <0.001 | CCR8 | −0.063 | 0.143 | ||||||||||||||||||||||||||||||||||||||||||||||||||||||||||||||||||||||||||||||||||||||||||||||
| KIR2DL1 | −0.059 | 0.173 | STAT5B | −0.136 | 0.002 | ||||||||||||||||||||||||||||||||||||||||||||||||||||||||||||||||||||||||||||||||||||||||||||||
| KIR2DL3 | −0.029 | 0.497 | TGFB1 | −0.287 | <0.001 | ||||||||||||||||||||||||||||||||||||||||||||||||||||||||||||||||||||||||||||||||||||||||||||||
| KIR2DL4 | 0.138 | 0.001 | PDCD1 | −0.151 | <0.001 | ||||||||||||||||||||||||||||||||||||||||||||||||||||||||||||||||||||||||||||||||||||||||||||||
| KIR3DL1 | −0.001 | 0.989 | CTLA4 | −0.097 | 0.026 | ||||||||||||||||||||||||||||||||||||||||||||||||||||||||||||||||||||||||||||||||||||||||||||||
| KIR3DL2 | −0.023 | 0.603 | LAG3 | −0.155 | <0.001 | ||||||||||||||||||||||||||||||||||||||||||||||||||||||||||||||||||||||||||||||||||||||||||||||
| KIR3DL3 | 0.096 | 0.026 | HAVCR2 | −0.123 | 0.005 | ||||||||||||||||||||||||||||||||||||||||||||||||||||||||||||||||||||||||||||||||||||||||||||||
| KIR2DS4 | −0.080 | 0.064 | GZMB | 0.103 | 0.017 | ||||||||||||||||||||||||||||||||||||||||||||||||||||||||||||||||||||||||||||||||||||||||||||||
| HLA-DPB1 | −0.424 | <0.001 | |||||||||||||||||||||||||||||||||||||||||||||||||||||||||||||||||||||||||||||||||||||||||||||||||
| Abbreviations: LAC: lung adenocarcinoma. | |||||||||||||||||||||||||||||||||||||||||||||||||||||||||||||||||||||||||||||||||||||||||||||||||||
Discussion
Abnormal mitochondrial mitosis has been associated with tumour development [9, 17, 18]. For instance, Wang et al. reported that β-asarone, a natural compound with low toxicity, has anti-cancer activities that include mitochondria-linked apoptosis. β-asarone could inhibit the Wnt/β-catenin signalling transduction, reduce cell viability and facilitate mitochondria-related apoptosis in lung cancer cells. Moreover, β-asarone inhibited the viability of lung cancer cells in a dose-dependent manner and significantly inhibited the migration, invasion and adhesion of lung cancer cells [17]. Several studies have described various roles for MTFR1 in the mitochondrial division [11, 13, 16, 19, 20]. For instance, Wang et al. reported that, in oral squamous cell carcinoma extracapsular spread, MTFR1 could be regarded as an indicator of the prognosis of patients without lymph node metastasis [11]. However, to date, there have been no reports on the roles of MTFR1 in drug sensitivity and immunity in LAC. This study revealed that MTFR1 was significantly overexpressed in LAC tissues, and elevated MTFR1 expression was correlated with the sex, age, and T stage in patients with LAC. ROC results revealed that MTRF1 has significant diagnostic values in LAC. K-M survival analysis and meta-analysis revealed that MTFR1 overexpression was associated with OS, DSS, and progression-free interval (PFI) in patients with LAC. COX regression analysis revealed that MTFR1 overexpression was the risk factors for unfavourable OS and PFI. This indicated that MTFR1 overexpression was a prognostic risk factor for LAC patients.
Cell proliferation is associated with the mechanisms governing the cell cycle. Dysregulated cell cycling leads to the abnormal regulation of cell proliferation and can induce excessive increases in cell number, which leads to unfavourable prognosis in patients with tumours [12, 21, 22]. For example, mini-chromosome maintenance protein 10 (MCM10) strongly compensated for DNA replication pressure and promoted genome replication in S-phase cancer cells, which was more pronounced in cancer stem cell-like cells (CSC) [21]. FLAP endonuclease 1 (FEN1) was a structure-specific nuclease that plays a role in DNA replication and repair. Interference with FEN1 expression could kill defective human cells and induce DNA damage responses in sensitive and resistant cell lines [22]. These results indicate that cell cycle and DNA replication play an important role in cancer progression. Now, Wang et al. reported that MTFR1 could inhibit mitochondrial fission and induce apoptosis [11]. Similarly, Li et al. reported that MTFR1 was overexpressed in LAC and could promote LAC cell growth and migration [16]. Preliminary evidence suggested that MTFR1 was involved in cancer progression as a carcinogenic gene. In our study, MTFR1 co-expressed genes were involved in the cell cycle, DNA replication, cell differentiation and others, and interfering with MTFR1 expression could inhibit the proliferation, migration, and invasion of A549 and A549/DDP cells, and promote cell apoptosis and sensitivity to cisplatin through p-AKT and p-ERK/p38 mechanisms. These results were consistent with previously reported results, further validating that MTFR1 plays an important role in the drug resistance of LAC.
Cancer and the tumour microenvironment are inseparable [23–26]. Wang et al. observed a higher proportion of CD8 T cells in advanced ovarian cancer (OC) using immunohistochemistry. The degree of matrix CD8 T cell infiltration was the positive correlation between FoxP3 Treg cell infiltration and histological grade. Notably, the migration and invasion of OC cells and ascites-derived OC cells increased after co-culture with CD8 T cells [25]. Reches et al. reported that the binding of T cell immunoreceptor with Ig and ITIM domains (TIGIT) and nectin cell adhesion molecule 4 (Nectin4), a new ligand of TIGIT, inhibits the activity of NK cells. Furthermore, the blocked Nectin4 antibody can enhance tumour lethality in vitro and in vivo [26]. In keeping with the importance of tumour-associated immune cells, our data revealed that MTFR1 expression also correlated with LAC stromal cells and immune cells, as well as immune cell markers, indicating that MTFR1 might play a vital role in LAC progression and immune escape.
MTFR1 was identified to have the important biological roles in LAC progression using bioinformatics and cell experiments to provide a new candidate molecule for the treatment of patients with LAC. However, the present study has certain limitations. The proliferation, migration, invasion and drug sensitivity of each group of cancer cells after activating p-AKT or p-ERK expression in the cell models that interfered with MTFR1 expression were not examined and should be investigated, and the MTFR1 expression in A549 and A549/DDP cells would be detected in the future. In conclusion, MTFR1 overexpression correlated to the diagnostic value, sex, age, primary therapy outcome, smoking, T stage, prognosis and immune infiltration of patients with LAC. Moreover, MTFR1 participates in cell growth and migration and promotes the resistance of LAC cells to cisplatin via p-AKT and p-ERK/P38 signalling pathways. Thus, it can be considered a potential therapeutic target for the unfavourable prognosis of patients with LAC.
Materials and Methods
TCGA and XENA databases
In May 2022, the genomic data of 535 cases of LAC and 59 cases of normal lung tissues of FPKM and TPM types were acquired from TCGA database and, the genomic data of 347 cases of normal lung tissues and 515 cases of LAC tissues of TPM types from XENA database. The gene expression data of 57 normal lung and LAC tissue samples, wherein the data belonged to the same 57 patients, were obtained and MTFR1 expression levels were investigated. The clinical data of patients with LAC from TCGA were screened. Furthermore, MTFR1 expression data and clinical data were combined to investigate the potential of MTFR1 in the clinicopathological characterisation and prognosis of patients with LAC.
The expression levels and clinical values of MTFR1 in LAC
The diagnostic value of MTFR1 in normal lung tissues and cancer tissues derived from the TCGA and XENA databases was identified using ROC analysis [27]. The expression of MTFR1 in each group was investigated according to the clinical pathological characteristics of patients. Additionally, the relationship between MTFR1 expression level and survival time, disease-specific survival and PFI of patients with LAC were determined using survival analysis after grouping by MTFR1 expression median value. Moreover, in the LCE database, a meta-analysis was conducted using data from the TCGA and GEO databases to investigate the expression and prognostic value of MTFR1 in LAC [28]. The clinical data of patients from TCGA were collated, and the factors affecting the prognosis of patients with LAC were analysed using univariate COX regression analysis. Subsequently, the MTFR1-related nomograms were constructed.
MTFR1 co-expressed genes
Spearman correlation coefficient (r) has been used to predict the relationship between two genes [29]. MTFR1 co-expressed genes in LAC tissues were filtrated based on P < 0.001 and the absolute values of coefficient >0.4, resulting in identifying the strongly related genes.
Signalling mechanisms of MTFR1 co-expressed genes
KEGG analysed the biological functions and mechanisms of the genes involved [30]. The signalling pathways of MTFR1 co-expressed genes were authenticated using KEGG [31], with the cut-off criterion as P < 0.05, which denoted statistical significance.
Cell culture and construction of cell models
Lung cancer cells A549 and A549/DDP were cultured in 10% foetal bovine serum (Gibao, USA) and 1% penicillin and streptomycin RPMI-1640 medium (Gibao, USA) and incubated in 5% CO2 at 37°C. Additionally, appropriate concentrations of cisplatin were added to A549/DDP cells. The A549 and A549/DDP cells were plated in 6-well plates at a 5 × 10⁶ concentration. When cell density reached 70%, the media was changed to the serum-free medium with the siRNAs [32]. The siRNA interference sequences of MTFR1 were the GCUGGAUUAAGCGCCUAAUTT (siRNA-1), CACUGCAGGUGACUUAGAUTT (siRNA-2), and CUGCUUGAUGAUUAATT (siRNA-3). The expression of MTFR1 was verified using qRT-PCR and western blotting at 24 h.
qRT-PCR
Total RNAs were extracted from the 6-well plates after transfection using 1 ml Trizol (Takara, Japan) reagent. MTFR1 cDNA was synthesised using the SureScript™ First-Strand cDNA synthesis kit (Genecopoeia, China) after RNA quantification and amplified using blazetaqtmsybr® green qPCR mix 2.0 (Genecopoeia, China). Finally, the relative expression of MTFR1 was calculated using the 2−ΔΔCT method. Primers for β-actin, p-AKT, AKT, p-P38, P38, p-ERK1/2, ERK1/2 and MTFR1 were obtained from Genecopoeia. The experiment was repeated three times.
Western blotting
Total proteins were extracted using RIPA lysate and quantified using BCA protein quantification. Proteins were separated using 10% SDS-PAGE and transferred onto polyvinylidene fluoride (PALL, USA) membranes [33, 34]. After blocking with 5% non-fat dry milk, the membranes were incubated with 1:1000 MTFR1, p-AKT, AKT, p-P38, P38, p-ERK1/2 and ERK1/2 antibodies overnight at 4°C and followed by 1:1000 secondary antibodies for 1 h at room temperature. After TBST washing, the membranes were visualised. The experiment was repeated three times.
Cell counting kit-8 (CCK-8)
When the A549 and A549/DDP cells were at the logarithmic phase, 2500 cells/well were seeded in 96-well plates, placed in 5% CO2 and incubated at 37°C. Following this, 10 ul/well CCK-8 reagent was added into the 96-well plates at 0 h, 24 h, 48 h, 72 h and 96 h and incubated at 5% CO2, 37°C for 1 h to detect cell viability and drug sensitivity. The absorbance values of the cancer cells were detected at 450 nm using a microplate reader. The experiment was repeated thrice.
Cell migration and invasion
A549 and A549/DDP cells at approximately 90% confluence after transfection were scratched with 0.2 ml sterile pipette heads, and the medium in the 6-well plates was changed to serum-free medium after phosphate-buffered saline (PBS) washing. Subsequently, the cancer cells were photographed. The migration distances of the cells in the two groups were observed in real time and photographed under a microscope, and the degree of migration was subsequently calculated. The model cell concentration was adjusted as follows: 200 μl cell suspension was added into the upper chamber of the Transwell membrane and 600 μl complete medium was added into the lower chamber. The no migrated cancer cells on the Transwell membrane were washed thrice using PBS after 5% CO2 and 37°C incubation for 24 h. The cells were subsequently stained using a cell chamber Staining Kit (Biosharp, China) and photographed under a microscope. The experiment was repeated thrice.
Immune microenvironment analysis
ESTIMATE and single sample gene set enrichment analysis (ssGSEA) analysis were the bioinformatics algorithm that calculates the composition of immune cells, immune, ESTIMATE and stromal scores [35, 36]. The ratio of immune cells in LAC tissues was explored using ssGSEA analysis [35]. The immune, ESTIMATE and stromal scores were statistically analysed using the ESTIMATE algorithm [35, 36]. The relationship between MTFR1 expression and LAC immune infiltration was investigated using Spearman correlation analysis.
The relationship between MTFR1 expression and immune cell markers
The data of immune cell markers and MTFR1 expression were extracted from the data of the LAC tissues in TCGA using Perl. The data were then sorted out, and correlation analysis was used to investigate the relationship between MTFR1 expression level and CD8A, CD8B, PDCD1 and other immune cell markers.
Statistical analysis
The Wilcoxon signed-rank test and chi-square test were applied to investigate the relationship between MTFR1 expression and clinicopathological characteristics in LAC. K-M survival analysis was applied to authenticate the correlation between MTFR1 expression and poor prognosis in patients with LAC. The t-test (mean ± standard deviation) was used to identify whether the cell proliferation and migration experiments were statistically significant. P < 0.05 was considered statistically significant.
Data availability statement
The data is available from the databases and the experimental data could be obtained from the corresponding author.
Supplementary Materials
Author Contributions
Di Ke, Jun Zhang, Qiang Guo and Cheng-Yi Lin conceived the research topic, prepared the research plan and directed its implementation. Qian-Yun Li, Wei-Min Luo, Yan-Mei Ji, Feng Li, and Qiang Guo drafted the manuscript, performed experiments and processed the research data. Di Ke, Qiang Guo, Wei-Min Luo, Xiang-Yu Luo, Li-Qiang Xu, Rong-Shu Shi and Qian-Yun Li, assisted in collecting and analysing the data, and Xiang-Yu Luo and Jia-Long Guo reviewed the manuscript. All authors have read and approved the final manuscript.
Conflicts of Interest
The authors declare no conflicts of interest related to this study.
Funding
This study was supported by the Health Commission of Hubei Provincial (WJ2023M166), and Zunyi City Joint Fund (Zun Shi Ke He HZ Word (2021) No. 73), (Zun Shi Ke He HZ Word (2021) No. 43), (Zun Shi Ke He HZ Word (2022) No. 244), and (Zun Shi Ke He HZ Word (2022) No. 235).
References
- 1. Song Y, Chen D, Zhang X, Luo Y, Li S. Integrating genetic mutations and expression profiles for survival prediction of lung adenocarcinoma. Thorac Cancer. 2019; 10:1220–8. https://doi.org/10.1111/1759-7714.13072 [PubMed]
- 2. Zhou W, Liu Y, Gao Y, Cheng Y, Chang R, Li X, Zhou Y, Wang S, Liang L, Duan C, Zhang C. MICAL2 is a novel nucleocytoplasmic shuttling protein promoting cancer invasion and growth of lung adenocarcinoma. Cancer Lett. 2020; 483:75–86. https://doi.org/10.1016/j.canlet.2020.04.019 [PubMed]
- 3. Mizutani K, Guo X, Shioya A, Zhang J, Zheng J, Kurose N, Ishibashi H, Motono N, Uramoto H, Yamada S. The impact of PRDX4 and the EGFR mutation status on cellular proliferation in lung adenocarcinoma. Int J Med Sci. 2019; 16:1199–206. https://doi.org/10.7150/ijms.36071 [PubMed]
- 4. Okita R, Maeda A, Shimizu K, Nojima Y, Saisho S, Nakata M. PD-L1 overexpression is partially regulated by EGFR/HER2 signaling and associated with poor prognosis in patients with non-small-cell lung cancer. Cancer Immunol Immunother. 2017; 66:865–76. https://doi.org/10.1007/s00262-017-1986-y [PubMed]
- 5. Khunger M, Jain P, Rakshit S, Pasupuleti V, Hernandez AV, Stevenson J, Pennell NA, Velcheti V. Safety and Efficacy of PD-1/PD-L1 Inhibitors in Treatment-Naive and Chemotherapy-Refractory Patients With Non-Small-Cell Lung Cancer: A Systematic Review and Meta-Analysis. Clin Lung Cancer. 2018; 19:e335–48. https://doi.org/10.1016/j.cllc.2018.01.002 [PubMed]
- 6. Jan YH, Lai TC, Yang CJ, Huang MS, Hsiao M. A co-expressed gene status of adenylate kinase 1/4 reveals prognostic gene signature associated with prognosis and sensitivity to EGFR targeted therapy in lung adenocarcinoma. Sci Rep. 2019; 9:12329. https://doi.org/10.1038/s41598-019-48243-9 [PubMed]
- 7. Feng J, Ma Y, Chen Z, Hu J, Yang Q, Ding G. Mitochondrial pyruvate carrier 2 mediates mitochondrial dysfunction and apoptosis in high glucose-treated podocytes. Life Sci. 2019; 237:116941. https://doi.org/10.1016/j.lfs.2019.116941 [PubMed]
- 8. Wu Y, Chen M, Jiang J. Mitochondrial dysfunction in neurodegenerative diseases and drug targets via apoptotic signaling. Mitochondrion. 2019; 49:35–45. https://doi.org/10.1016/j.mito.2019.07.003 [PubMed]
- 9. Zhou Q, Li H, Li Y, Tan M, Fan S, Cao C, Meng F, Zhu L, Zhao L, Guan MX, Jin H, Sun Y. Inhibiting neddylation modification alters mitochondrial morphology and reprograms energy metabolism in cancer cells. JCI Insight. 2019; 4:121582. https://doi.org/10.1172/jci.insight.121582 [PubMed]
- 10. Zeng Y, Guo Z, Hu Z, Liu M, Chen Y, Chen S, Peng B, Zhang P, Wu Z, Luo H, Zhong F, Jiang K, Lu Y, et al. FGD1 exhibits oncogenic properties in hepatocellular carcinoma through regulating cell morphology, autophagy and mitochondrial function. Biomed Pharmacother. 2020; 125:110029. https://doi.org/10.1016/j.biopha.2020.110029 [PubMed]
- 11. Wang K, Zhang DL, Long B, An T, Zhang J, Zhou LY, Liu CY, Li PF. NFAT4-dependent miR-324-5p regulates mitochondrial morphology and cardiomyocyte cell death by targeting Mtfr1. Cell Death Dis. 2015; 6:e2007. https://doi.org/10.1038/cddis.2015.348 [PubMed]
- 12. Chen P, Zhong J, Ye J, He Y, Liang Z, Cheng Y, Zheng J, Chen H, Chen C. miR-324-5p protects against oxidative stress-induced endothelial progenitor cell injury by targeting Mtfr1. J Cell Physiol. 2019; 234:22082–92. https://doi.org/10.1002/jcp.28771 [PubMed]
- 13. Monticone M, Panfoli I, Ravera S, Puglisi R, Jiang MM, Morello R, Candiani S, Tonachini L, Biticchi R, Fabiano A, Cancedda R, Boitani C, Castagnola P. The nuclear genes Mtfr1 and Dufd1 regulate mitochondrial dynamic and cellular respiration. J Cell Physiol. 2010; 225:767–76. https://doi.org/10.1002/jcp.22279 [PubMed]
- 14. Huang L, Guo B, Liu S, Miao C, Li Y. Inhibition of the LncRNA Gpr19 attenuates ischemia-reperfusion injury after acute myocardial infarction by inhibiting apoptosis and oxidative stress via the miR-324-5p/Mtfr1 axis. IUBMB Life. 2020; 72:373–83. https://doi.org/10.1002/iub.2187 [PubMed]
- 15. Wang W, Lim WK, Leong HS, Chong FT, Lim TK, Tan DS, Teh BT, Iyer NG. An eleven gene molecular signature for extra-capsular spread in oral squamous cell carcinoma serves as a prognosticator of outcome in patients without nodal metastases. Oral Oncol. 2015; 51:355–62. https://doi.org/10.1016/j.oraloncology.2014.12.012 [PubMed]
- 16. Li Y, Liu Y, Jin K, Dong R, Gao C, Si L, Feng Z, Zhang H, Tian H. Negatively Regulated by miR-29c-3p, MTFR1 Promotes the Progression and Glycolysis in Lung Adenocarcinoma via the AMPK/mTOR Signalling Pathway. Front Cell Dev Biol. 2021; 9:771824. https://doi.org/10.3389/fcell.2021.771824 [PubMed]
- 17. Wang TL, Ouyang CS, Lin LZ. β-Asarone suppresses Wnt/β-catenin signaling to reduce viability, inhibit migration/invasion/adhesion and induce mitochondria-related apoptosis in lung cancer cells. Biomed Pharmacother. 2018; 106:821–30. https://doi.org/10.1016/j.biopha.2018.07.009 [PubMed]
- 18. Cheng MH, Huang HL, Lin YY, Tsui KH, Chen PC, Cheng SY, Chong IW, Sung PJ, Tai MH, Wen ZH, Chen NF, Kuo HM. BA6 Induces Apoptosis via Stimulation of Reactive Oxygen Species and Inhibition of Oxidative Phosphorylation in Human Lung Cancer Cells. Oxid Med Cell Longev. 2019; 2019:6342104. https://doi.org/10.1155/2019/6342104 [PubMed]
- 19. Lassiter K, Greene E, Piekarski A, Faulkner OB, Hargis BM, Bottje W, Dridi S. Orexin system is expressed in avian muscle cells and regulates mitochondrial dynamics. Am J Physiol Regul Integr Comp Physiol. 2015; 308:R173–87. https://doi.org/10.1152/ajpregu.00394.2014 [PubMed]
- 20. Monticone M, Tonachini L, Tavella S, Degan P, Biticchi R, Palombi F, Puglisi R, Boitani C, Cancedda R, Castagnola P. Impaired expression of genes coding for reactive oxygen species scavenging enzymes in testes of Mtfr1/Chppr-deficient mice. Reproduction. 2007; 134:483–92. https://doi.org/10.1530/REP-07-0199 [PubMed]
- 21. Murayama T, Takeuchi Y, Yamawaki K, Natsume T, Li M, Marcela RN, Nishimura T, Kogure Y, Nakata A, Tominaga K, Sasahara A, Yano M, Ishikawa S, et al. MCM10 compensates for Myc-induced DNA replication stress in breast cancer stem-like cells. Cancer Sci. 2021; 112:1209–24. https://doi.org/10.1111/cas.14776 [PubMed]
- 22. Guo E, Ishii Y, Mueller J, Srivatsan A, Gahman T, Putnam CD, Wang JYJ, Kolodner RD. FEN1 endonuclease as a therapeutic target for human cancers with defects in homologous recombination. Proc Natl Acad Sci U S A. 2020; 117:19415–24. https://doi.org/10.1073/pnas.2009237117 [PubMed]
- 23. Noman MZ, Hasmim M, Lequeux A, Xiao M, Duhem C, Chouaib S, Berchem G, Janji B. Improving Cancer Immunotherapy by Targeting the Hypoxic Tumor Microenvironment: New Opportunities and Challenges. Cells. 2019; 8:1083. https://doi.org/10.3390/cells8091083 [PubMed]
- 24. Xiang QM, Jiang N, Liu YF, Wang YB, Mu DA, Liu R, Sun LY, Zhang W, Guo Q, Li K. Overexpression of SH2D1A promotes cancer progression and is associated with immune cell infiltration in hepatocellular carcinoma via bioinformatics and in vitro study. BMC Cancer. 2023; 23:1005. https://doi.org/10.1186/s12885-023-11315-1 [PubMed]
- 25. Wang JJ, Siu MK, Jiang YX, Chan DW, Cheung AN, Ngan HY, Chan KK. Infiltration of T cells promotes the metastasis of ovarian cancer cells via the modulation of metastasis-related genes and PD-L1 expression. Cancer Immunol Immunother. 2020; 69:2275–89. https://doi.org/10.1007/s00262-020-02621-9 [PubMed]
- 26. Reches A, Ophir Y, Stein N, Kol I, Isaacson B, Charpak Amikam Y, Elnekave A, Tsukerman P, Kucan Brlic P, Lenac T, Seliger B, Jonjic S, Mandelboim O. Nectin4 is a novel TIGIT ligand which combines checkpoint inhibition and tumor specificity. J Immunother Cancer. 2020; 8:e000266. https://doi.org/10.1136/jitc-2019-000266 [PubMed]
- 27. Jiang N, Guo Q, Luo Q. Inhibition of ITGB1-DT expression delays the growth and migration of stomach adenocarcinoma and improves the prognosis of cancer patients using the bioinformatics and cell model analysis. J Gastrointest Oncol. 2022; 13:615–29. https://doi.org/10.21037/jgo-22-233 [PubMed]
- 28. Guo Q, Wang SH, Ji YM, Tong S, Li D, Ding XC, Wu CY. The Roles and Mechanisms of TRAT1 in the Progression of Non-Small Cell Lung Cancer. Curr Med Sci. 2022; 42:1186–200. https://doi.org/10.1007/s11596-022-2625-1 [PubMed]
- 29. Wang F, Chan LW, Tsui NB, Wong SC, Siu PM, Yip SP, Yung BY. Coexpression Pattern Analysis of NPM1-Associated Genes in Chronic Myelogenous Leukemia. Biomed Res Int. 2015; 2015:610595. https://doi.org/10.1155/2015/610595 [PubMed]
- 30. Guo Q, Liu XL, Jiang N, Zhang WJ, Guo SW, Yang H, Ji YM, Zhou J, Guo JL, Zhang J, Liu HS. Decreased APOC1 expression inhibited cancer progression and was associated with better prognosis and immune microenvironment in esophageal cancer. Am J Cancer Res. 2022; 12:4904–29. [PubMed]
- 31. Lv Z, Feng HY, Tao W, Li HZ, Zhang X. CD146 as a Prognostic-Related Biomarker in ccRCC Correlating With Immune Infiltrates. Front Oncol. 2021; 11:744107. https://doi.org/10.3389/fonc.2021.744107 [PubMed]
- 32. Zhang RS, Li ZK, Liu J, Deng YT, Jiang Y. WZB117 enhanced the anti-tumor effect of apatinib against melanoma via blocking STAT3/PKM2 axis. Front Pharmacol. 2022; 13:976117. https://doi.org/10.3389/fphar.2022.976117 [PubMed]
- 33. Liu HS, Guo Q, Yang H, Zeng M, Xu LQ, Zhang QX, Liu H, Guo JL, Zhang J. SPDL1 Overexpression Is Associated With the 18F-FDG PET/CT Metabolic Parameters, Prognosis, and Progression of Esophageal Cancer. Front Genet. 2022; 13:798020. https://doi.org/10.3389/fgene.2022.798020 [PubMed]
- 34. Li D, Liu X, Jiang N, Ke D, Guo Q, Zhai K, Han H, Xiao X, Fan T. Interfering with ITGB1-DT expression delays cancer progression and promotes cell sensitivity of NSCLC to cisplatin by inhibiting the MAPK/ERK pathway. Am J Cancer Res. 2022; 12:2966–88. [PubMed]
- 35. Zhao K, Ma Z, Zhang W. Comprehensive Analysis to Identify SPP1 as a Prognostic Biomarker in Cervical Cancer. Front Genet. 2022; 12:732822. https://doi.org/10.3389/fgene.2021.732822 [PubMed]
- 36. Yoshihara K, Shahmoradgoli M, Martínez E, Vegesna R, Kim H, Torres-Garcia W, Treviño V, Shen H, Laird PW, Levine DA, Carter SL, Getz G, Stemke-Hale K, et al. Inferring tumour purity and stromal and immune cell admixture from expression data. Nat Commun. 2013; 4:2612. https://doi.org/10.1038/ncomms3612 [PubMed]