


Introduction
Immunotherapy is one of the most promising cancer treatments and is often used in the advanced stages of most tumors [1]. One of the prerequisites for tumor immunotherapy is the recognition of tumor antigens, which will then trigger subsequent specific immune responses to control and removal tumors. Tumor antigens are divided into tumor-specific antigens and tumor-associated antigens. Cancer/testis antigens (CTAs) are a large family of tumor-associated antigens and only their expression is restricted to germline and tumor cells [2]. Among the CTAs families, MAGE-A, NY-ESO-1, LAGE1, and TTK are considered potential therapeutic targets due to their in vivo immunogenicity and specific expression patterns and have entered early stages of clinical trials [3–5].
Among cancer/testis antigens members, MAGE-A subfamily was the first identified gene family, which has also been deeply studied. MAGE-A (melanoma associated antigens-a) belongs to MAGE superfamily and its members include MAGE-A1-MAGE-A12 whose encoding gene are all located on X chromosome [6, 7]. Aberrant expression of MAGE-A family members has been identified in not just melanoma but also breast, bladder, lung, ovarian, and hepatic cancers [8–12]. Based on these findings and their expression characteristics, members of the MAGE-A family are considered good potential immunotherapeutic targets. However, the expression, function and prognosis of MAGE-A family members in GC are poorly understood. In this study, we analyzed the expression differences among family members in normal and tumor tissues, as well as their expression and prognostic value under different clinical characteristics. Immune cell infiltration and immunotherapy analyses were also performed which will provide theoretical basis for investigating the role of MAGE-A family members in immunotherapy of GC.
Materials and Methods
Expression and survival analysis of MAGE-A protein family genes
We downloaded expression data and corresponding clinical data from the UCSC Xena database and the TCGA database. The differential expression was then analyzed using the R packages limma and ggplot2. When drawing the survival curve, we utilized the online database Kaplan-Meier plotter (http://kmplot.com/analysis/index.php?p=background) and also utilized the R packages to process the corresponding clinical data and expression data of TCGA.
Screening for differentially expressed genes
The samples were divided into high expression group and low expression group of MAGE-A11 according to the mean expression level of MAGE-A11. The data were then processed with the R packages limma, ggplot2 and pheatmap to screen for differentially expressed genes and presented the results in the form of a heatmap [13, 14].
Analysis of independent prognostic factors
MAGE-A11 expression, age, gender, Grade and Stage were included in Cox regression analyses. Subsequent time-dependent ROC curves were used to judge the accuracy and specificity of univariate and multivariate Cox regression analysis results. Finally, we constructed a nomogram. The nomogram contains 8 factors which are: age, gender, M, N, T, Stage, Grade and MAGE-A11 expression.
Functional enrichment analysis
To study the biological function of differentially expressed genes, Gene Ontology enrichment analysis was performed using the R package “clusterProfiler. FDR ≤ 0.05 was considered statistically significant [15–17].
Tumor immune cell infiltration analysis
The CIBERSORT algorithm was used to complete the analysis of immune-infiltrating cells in each sample [18, 19].
EdU assay
Cells were cultured on a 14mm cell culture coverslide at 37° C with 5% CO2 overnight according to the EdU kit instructions (Thermo Fisher Scientific, USA). When the cells reached 70-80% confluence, the medium was eliminated, washed twice with PBS, and subsequently incubated in complete medium containing 50 mM EdU for 2 hours. Finally, reagents were added sequentially according to the instructions.
Cellular immunofluorescence
Ki67 as well as E-cadherin (Abclonal, China) were diluted according to the manufacturer’s instructions and incubated on cell slides overnight. Secondary antibodies were added and incubated for one hour, followed by observation and photography.
Transwell assay
Cell migration ability was tested using the Transwell assay under different treatment groups. Technical abbreviations are explained on first use. Cells undergoing logarithmic growth were treated. The cell suspension was adjusted to a density of 5×10⁵/mL and 100 μL was added into the Transwell chamber. Complete medium was added to 24-well plate, and incubation carried out for 24 hours. The results were observed after crystal violet staining.
Construction of xenograft tumor model
Three-week male nude mice purchased from Beijing Huafukang Experimental Animal Co., Ltd. 2 x10⁷ cells from the knockdown group and the control group were injected subcutaneously into the nude mouse. After 18 days of incubation, animal imaging was performed.
Statistical analysis
All data analyses in this study were performed with R software version 4.1.0. The Wilcoxon test was used to compare significant differences between the two groups of data. Kaplan-Meier analysis was used to examine survival curves. Construction of univariate and multivariate Cox analyses was based on proportional hazards models. The T-test was used to calculate whether there was a statistical difference between the two groups. p-values less than 0.05 were considered statistically significant.
Availability of supporting data
The data generated during this study are included in this article and its supplementary information files are available from the corresponding author on reasonable request.
Consent for publication
All authors have read this manuscript and approved for submission.
Results
Expression of MAGE-A family in gastric cancer
First, we downloaded sequencing data for 33 cancers from the UCSC Xena database (http://xena.ucsc.edu/). We then extracted the expression data of MAGE-A family members and plotted them as scatter plots (Figure 1A). These results showed that MAGE-A1, MAGE-A2, MAGE-A3, MAGE-A4, MAGE-A6, MAGE-A10 and MAGE-A11 were significantly highly expressed in cancer tissues, while the remaining family members had no significant difference in expression. Finally, we also downloaded the data of the TCGA database and performed differential expression analysis of MAGE-A family members in cancer and adjacent tissues (Figure 1B). We found that MAGE-A all family members were significantly highly expressed in cancer tissues.
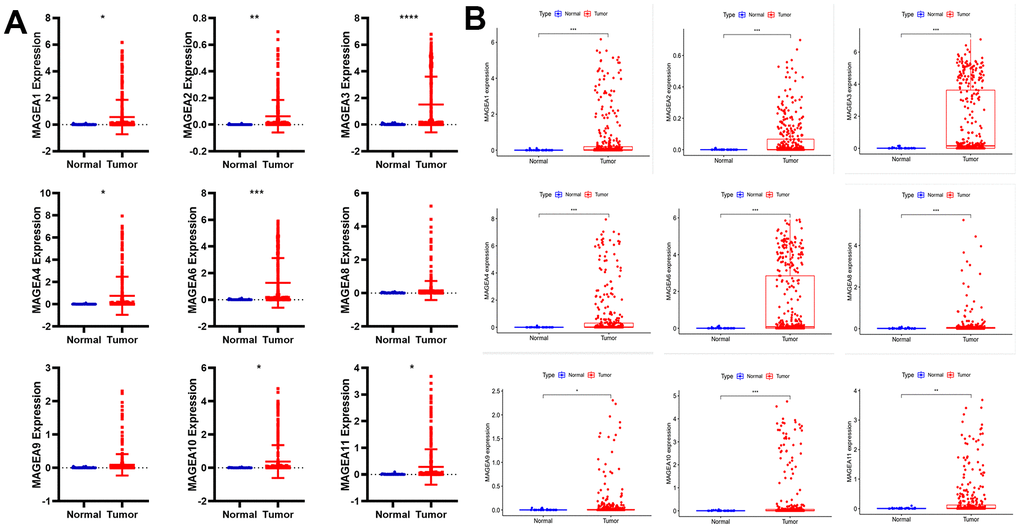
Figure 1. Differential expression analysis of MAGE-A family members between tumor and normal tissues. (A) Pan-cancer data analysis of MAGEA family members expression in gastric cancer. (B) Expression of MAGEA family members was analyzed from TCGA gastric cancer expression data.
Analysis of the prognostic role of the MAGE-A family
To verify the prognostic role of MAGE-A family members in GC. We first applied the online database Kaplan-Meier plotter (http://kmplot.com/analysis/index.php?p=background) to plot survival curves of members of the MAGE-A family. The results were shown in Figure 2A, the high expression group of family members showed poor prognosis of the patients. We then validated these results by applying Kaplan-Meier analysis to the expression data and clinical information downloaded from TCGA. We found that only the survival curve for MAGE-A11 was statistically significant (Figure 2B). Moreover, high expression of MAGE-A11 also represented a poor prognosis. Together with these findings, we selected MAGE-A11 as a follow-up study target.
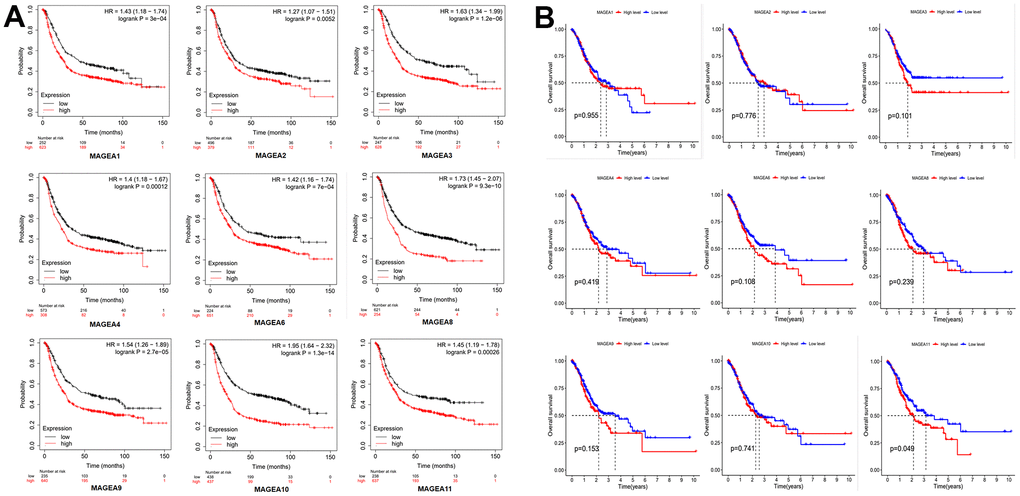
Figure 2. Prognostic role of MAGE-A family members. (A) Survival curve from the website Kaplan-Meier plotter. (B) Survival curves constructed by TCGA clinical and expression data.
Expression of MAGE-A11 in different clinical features
We plotted MAGE-A11 clinical heatmap using the limma and ComplexHeatmap R packages (Figure 3A). The findings indicated that there was a statistically significant difference in the expression of MAGE-A11 among Grade, but not in relation to M, N, T, gender, age, or tumor stage. To further determine the details of MAGE-A11 expression in the Grade classification, box plots were ploted based on clinical data. As shown in Figure 3B, MAGE-A11 was significantly differentially expressed in G2 and G3 while the other groups were not statistically different. These expression differences suggest that it is more accurate to employ Grade staging when using MAGE-A11 as a therapeutic target and prognostic factor.
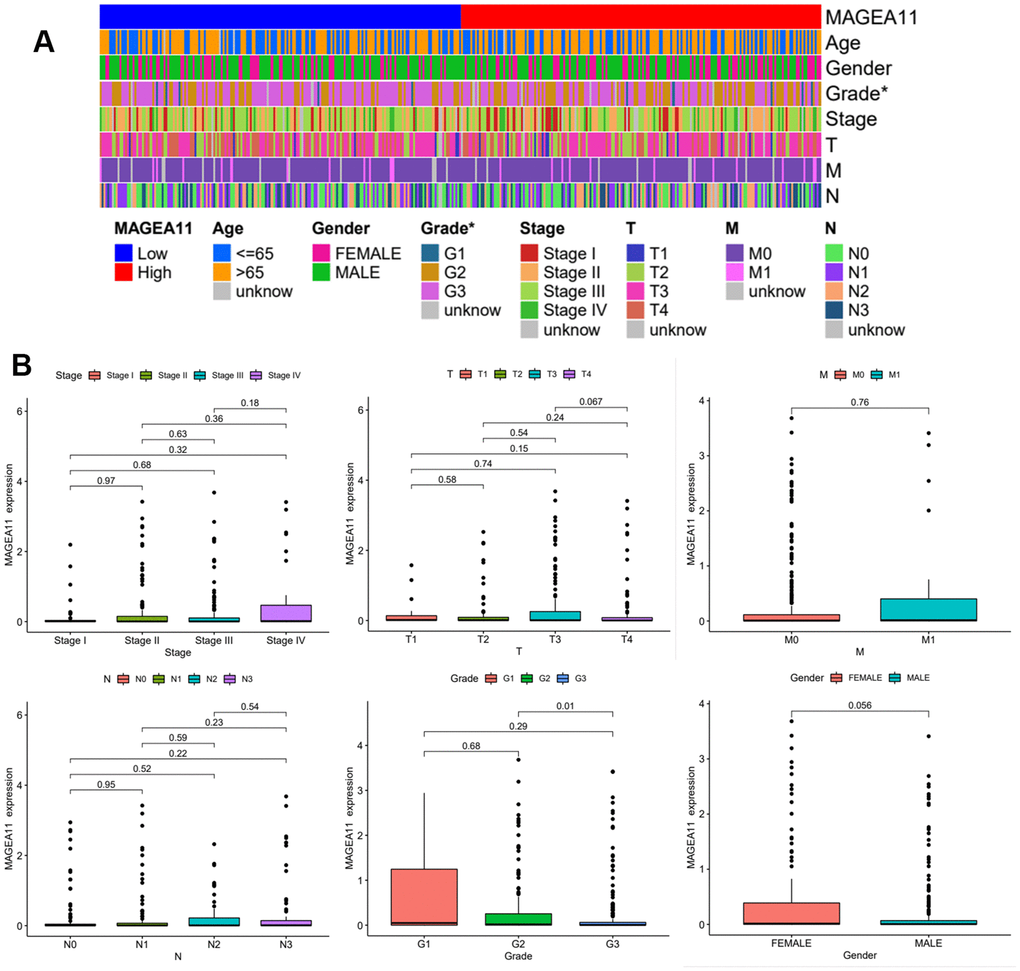
Figure 3. Expression of MAGE-A11 in different clinical features. (A) Clinical heat map of MAGE-A11 expression. (B) Box plot of MAGE-A11 expression under different clinical characteristics.
MAGE-A11 is an independent prognostic factor for gastric cancer
After determining the expression of MAGE-A11 under different clinical features, we continued to investigate its prognostic role in GC. We incorporated MAGE-A11 expression and clinical information into univariate and multivariate Cox regression analysis and found that MAGE-A11 expression, age and Stage were independent predictors of GC (Figure 4A, 4B and Table 1). We then applied time-dependent ROC curves to verify the accuracy of the above findings. The results were shown in Figure 4C, The AUC values all exceeded 0.5. These values indicated the accuracy and specificity of the results of the Cox regression analysis described above. We constructed a nomogram for its prognostic value (Figure 4D).
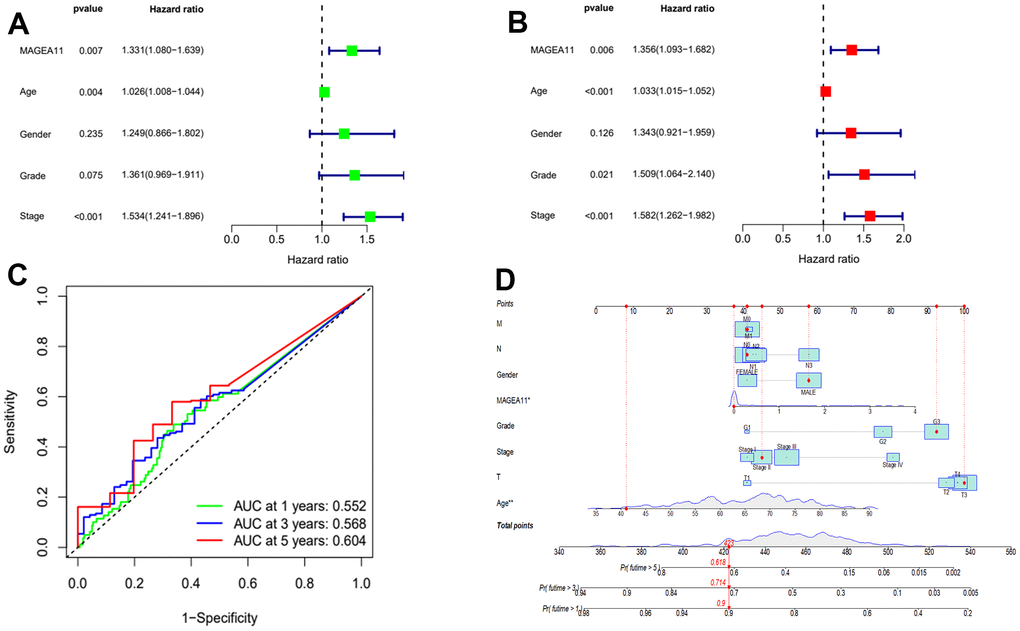
Figure 4. MAGE-A11 is an independent prognostic factor. (A) Univariate Cox regression analysis of the expression and clinical characteristics of MAGE-A11. (B) Multivariate Cox regression analysis of the expression and clinical characteristics of MAGE-A11. (C) Time-dependent ROC curves. (D) The nomogram is applied by adding up the points identified on the points scale for each variable. ROC: receiver operating characteristic curve. AUC: area under the curve.
Table 1. Results of the MAGE-A11 expression and clinical characteristics in the univariate and multivariate Cox regression analysis.
| ID | Univariate Cox regression analysis | Multivariate Cox regression analysis | |||||||||||||||||||||||||||||||||||||||||||||||||||||||||||||||||||||||||||||||||||||||||||||||||
| HR | HR.95L | HR.95H | P-value | HR | HR.95L | HR.95H | P-value | ||||||||||||||||||||||||||||||||||||||||||||||||||||||||||||||||||||||||||||||||||||||||||||
| MAGE-A11 | 1.330649 | 1.080051 | 1.639391 | 0.00729 | 1.355726 | 1.092814 | 1.681891 | 0.005659 | |||||||||||||||||||||||||||||||||||||||||||||||||||||||||||||||||||||||||||||||||||||||||||
| Age | 1.025793 | 1.008122 | 1.043774 | 0.004074 | 1.033345 | 1.014846 | 1.052183 | 0.000373 | |||||||||||||||||||||||||||||||||||||||||||||||||||||||||||||||||||||||||||||||||||||||||||
| Gender | 1.249052 | 0.865632 | 1.802303 | 0.234564 | 1.343008 | 0.920908 | 1.958579 | 0.125534 | |||||||||||||||||||||||||||||||||||||||||||||||||||||||||||||||||||||||||||||||||||||||||||
| Grade | 1.360868 | 0.969129 | 1.910957 | 0.075253 | 1.508955 | 1.064031 | 2.139923 | 0.02099 | |||||||||||||||||||||||||||||||||||||||||||||||||||||||||||||||||||||||||||||||||||||||||||
| Stage | 1.533532 | 1.240617 | 1.895606 | 7.70E-05 | 1.581805 | 1.262205 | 1.98233 | 6.83E-05 | |||||||||||||||||||||||||||||||||||||||||||||||||||||||||||||||||||||||||||||||||||||||||||
| Bold words mean P-value is less than 0.05; HR, hazard ratio; L, low; H, high. | |||||||||||||||||||||||||||||||||||||||||||||||||||||||||||||||||||||||||||||||||||||||||||||||||||
Identification of differentially expressed genes and functional enrichment analysis
According to the expression level of MAGE-A11, we divided the expression data of GC into MAGE-A11 high and low expression groups. And based on this as a basis for the screening of differential genes. We applied the limma and pheatmap R packages to process the data and plot the top 50 differentially expressed genes into a heatmap (Figure 5). Finally, we found 2075 differentially expressed genes, of which 27 were down-regulated and 2,048 genes were up-regulated. Then we carried out biological function analysis of these differential genes. The results of GO enrichment analysis showed that MAGE-A11 was involved in epidermis development and other functions (Figure 6A, 6B).
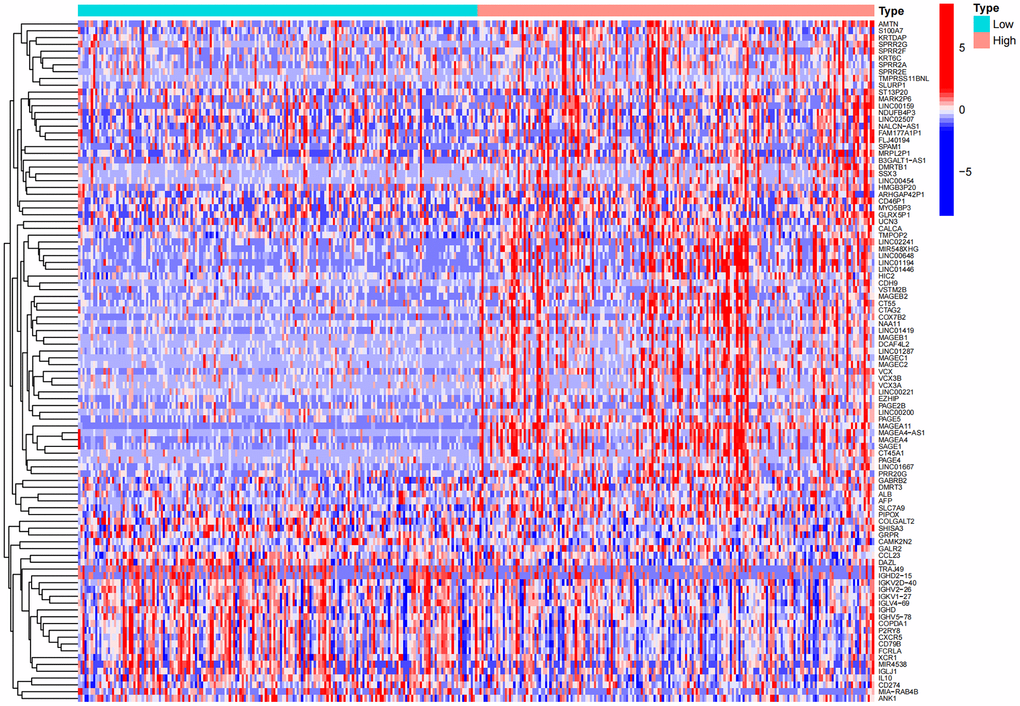
Figure 5. Heat map of differential genes in the high and low expression groups of MAGE-A11.
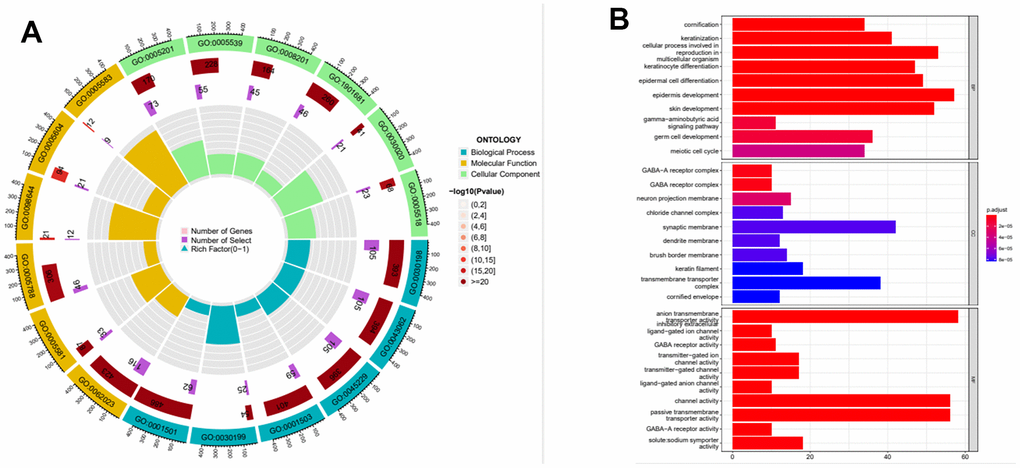
Figure 6. Functional enrichment analysis of the expression profile of MAGE-A11. (A) Functional enrichment analysis circle diagram. (B) Functional enrichment analysis histogram.
The relationship between the expression of MAGE-A11 and the tumor microenvironment
Next, we investigated the relationship between MAGE-A11 expression and the tumour microenvironment. Firstly, the samples were grouped based on their high and low MAGE-A11 expression levels, and subsequent analyses of Stromalscore, Immunescore, and ESTIMATE scores were conducted to determine the differences between the respective expression groups. As shown in Figure 7A, there were significant differences in the analysis results, and the score of the MAGE-A11 low expression group was significantly higher than that of the high expression group. This implied a strong relationship between the expression of MAGE-A11 and the tumor microenvironment. In order to explain the relationship between the expression of MAGE-A11 and the tumor microenvironment in more detail. We applied the CIBERSORT algorithm to calculate the proportions of 22 types of infiltrating cells in each tumor sample and plotted them as bar graphs (Figure 7B). Correlations between infiltrating cells were also analyzed and plotted as a heat map (Figure 7C). Then we analyzed the difference of immune infiltrating cells (Figure 8A) and the Pearson’s relationship between each infiltrating cell and MAGE-A11 expression (Figure 8B, 8C). The results of the analysis showed that a total of six infiltrating cells were associated with the expression of MAGE-A11. Among them, T cells follicular helper and B cells naive cells were positively correlated with its expression, and the rest were negatively correlated. Finally, we analyzed the relationship between the expression of MAGE-A11 and immunotherapy. As shown in Figure 9, in general, the MAGE-A11 low expression group had better effect when receiving immunotherapy than the high expression group, and the effect was the most obvious when receiving combined immunotherapy against PD1 and CTLA4 (Figure 9C), followed by PD1 or CTLA4 treatment alone (Figure 9A, 9B). There was no significant difference between the two groups without treatment (Figure 9D). This suggested that when MAGE-A11 was selected as a therapeutic target, the combination of immune checkpoint therapy may achieve better results.
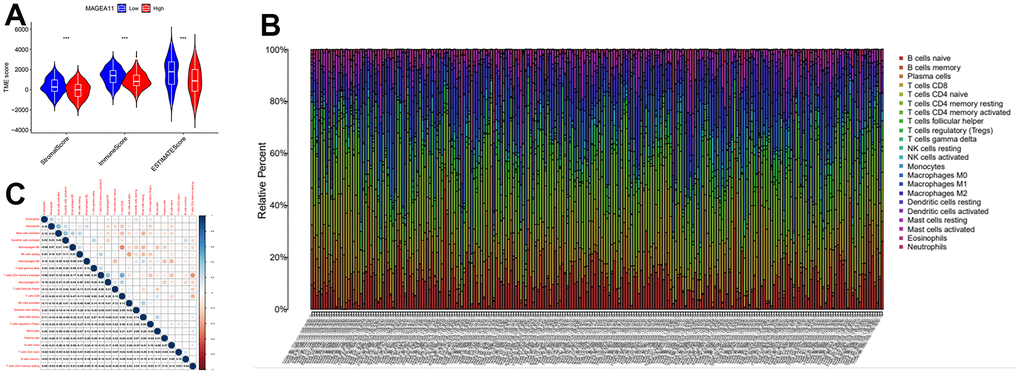
Figure 7. The relationship between MAGE-A11 expression and the tumour microenvironment. (A) Stromalscore, Immunescore and ESTIMATE score differences between MAGE-A11 high and low expression groups. (B) Proportion of tumor-infiltrating immune cells in each sample. (C) Relationship between tumor-infiltrating cells.
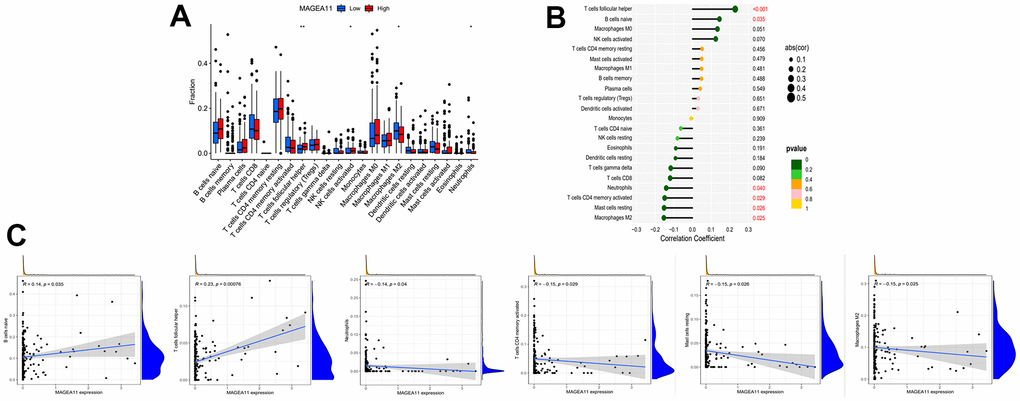
Figure 8. Relationship between tumor-infiltrating cells and MAGE-A11 expression. (A) Box plots of the proportions of tumor-infiltrating cell types in tumor tissues with low (blue) or high (red) MAGE-A11 expression. (B) Map of the proportional relationship between MAGE-A11 expression and tumor-infiltrating cells. (C) Scatter plots showing Pearson’s correlation between the proportions of the 6 most significant and MAGE-A11 expression.
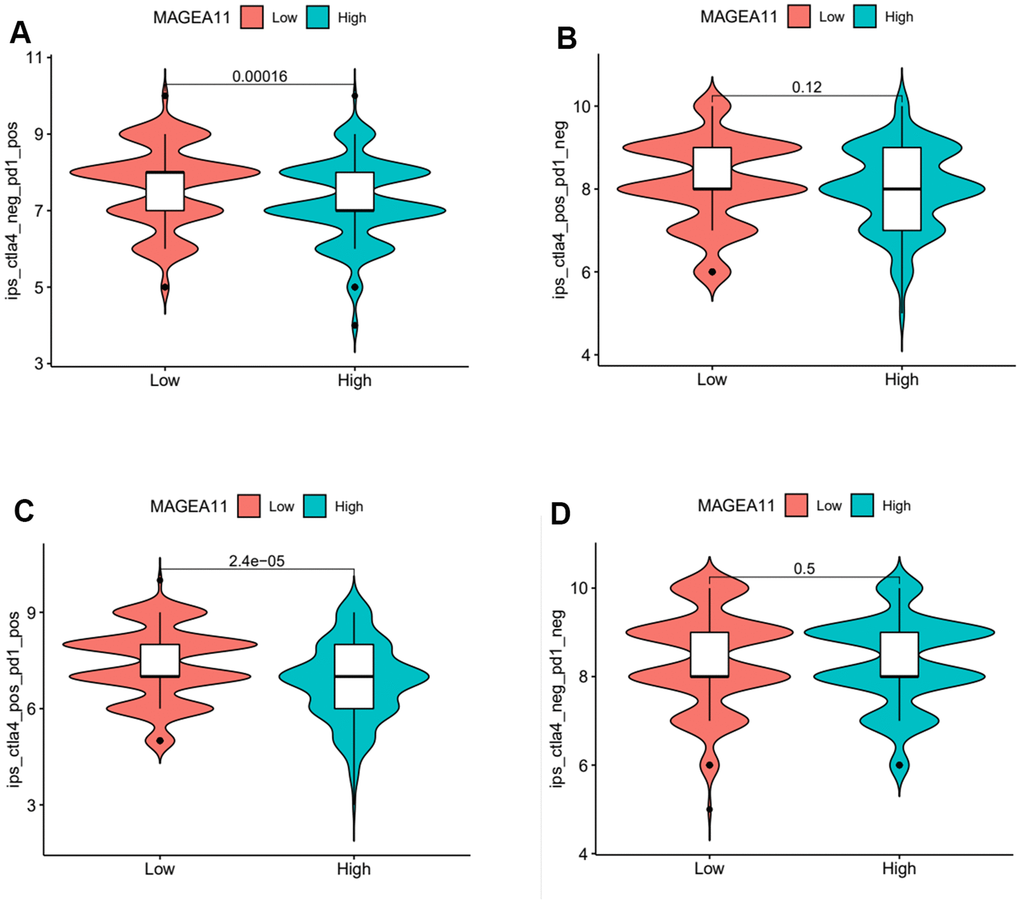
Figure 9. Violin plot of MAGE-A11 expression and sensitivity to immunotherapy. (A) Anti-PD1 immunotherapy. (B) Anti-CTLA4 immunotherapy. (C) Anti-PD1 and CTLA4 immunotherapy. (D) Non-immunotherapy.
MAGE-A11 regulates the proliferation and migration of GC cells
Firstly, we detected the expression of MAGE-A11 in GC cells and GC epithelial cell line by qPCR. As shown in Figure 10A, the expression level of MAGE-A11 in SGC-7901 cells was significantly higher than that of other GC cell lines. In order to study the biological function of MAGE-A11, a stable expression cell line of MAGE-A11 was constructed. Subsequently, we tested the effect of its knockout on cell proliferation by different methods respectively. CCK-8 cell activity assay detected that MAGE-A11 knockout reduced the activity of GC cells by about 24% (Figure 10B). The EdU assay detected the DNA synthesis ability and rate of cells during proliferation, and the positive rate of EdU decreased significantly in the knockdown group (18.4%) (Figure 10C). We also detected the expression of the Ki67. In accordance with the above results, the expression of Ki67 decreased significantly in the knockdown group (Figure 10D). Transwell assay and cellular immunofluorescence assay of N-cadherin and E-cadherin showed that MAGE-A11 also has the ability to regulate cell migration (Figure 11A–11C). Finally, we found that the protein markers of cell proliferation and migration changed significantly after the knockout of MAGE-A11 (Figure 11D).
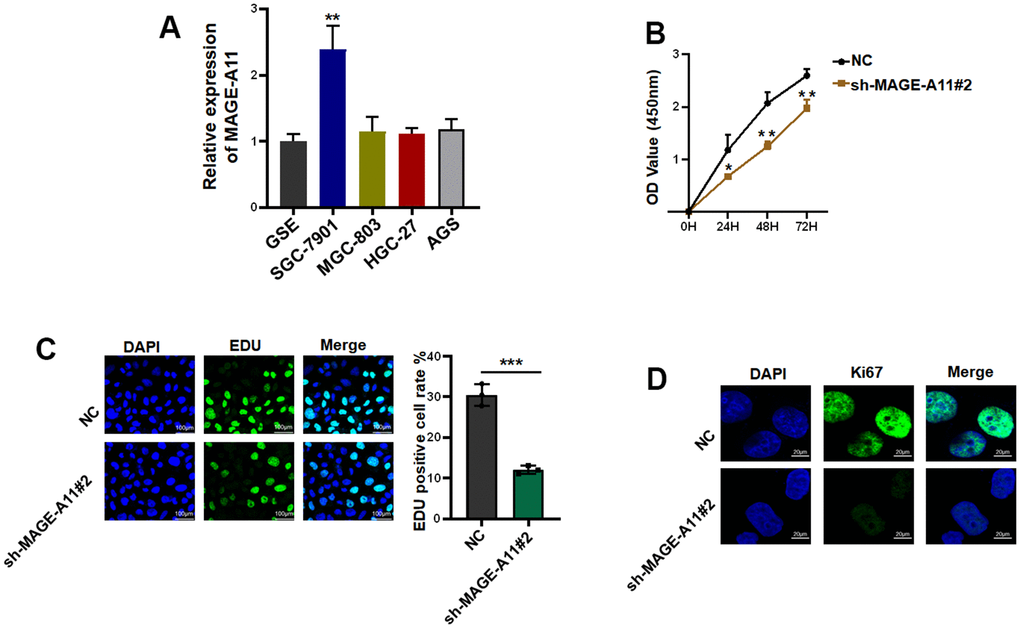
Figure 10. MAGE-A11 has the ability to regulate the proliferation of tumor cells. (A) The expression of MAGE-A11 was detected by QPCR in tumor cells and gastric epithelial cells. (B) CCK-8 assay was used to detect the effect of MAGE-A11 knockdown on cell viability. (C) EdU assay was used to detect the effect of MAGE-A11 knockdown on cell proliferation. (D) The expression of Ki67 was detected by cellular immunofluorescence.
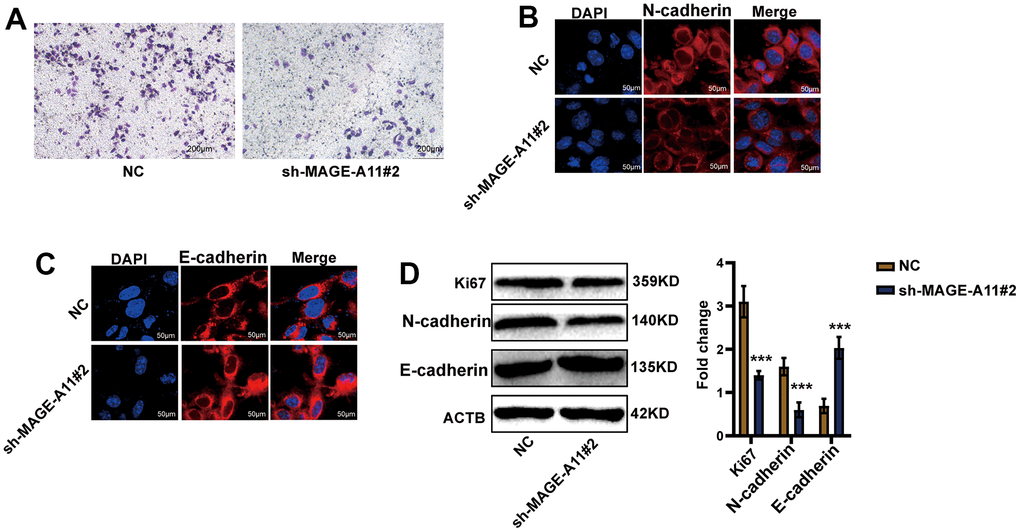
Figure 11. AGE-A11 has the ability to regulate tumor cell migration. (A) Transwell assay was used to detect the effect of MAGE-A11 knockout on cell migration ability. (B) Detection of N-cadherin by cellular immunofluorescence. (C) Detection of E-cadherin by cellular immunofluorescence. (D) The changes of cell proliferation and migration protein markers were detected by western blot.
Finally, the effect of MAGE-A11 on tumor in vivo was detected, so we established a tumor model in nude mice. Tumor volume records were measured at 6, 12, and 18 day. On the eighteenth day after subcutaneous injection of cells from the experimental group and the control group, the tumorous mice were subjected to animal imaging, and then the mice were killed, stripped of the tumors, photographed and weighed. As shown in Figure 12A, 12B, fluorescence values of tumors in the knockdown group decreased significantly. In Figure 12C, the picture of the dissected mouse tumor showed that the overall volume of the knockdown group was smaller. Tumor volume curves showed a reduction of 654mm3 in tumor volume and an average reduction of 0.9g in the knockdown group at day 18 of tumor inoculation (Figure 12D, 12E).
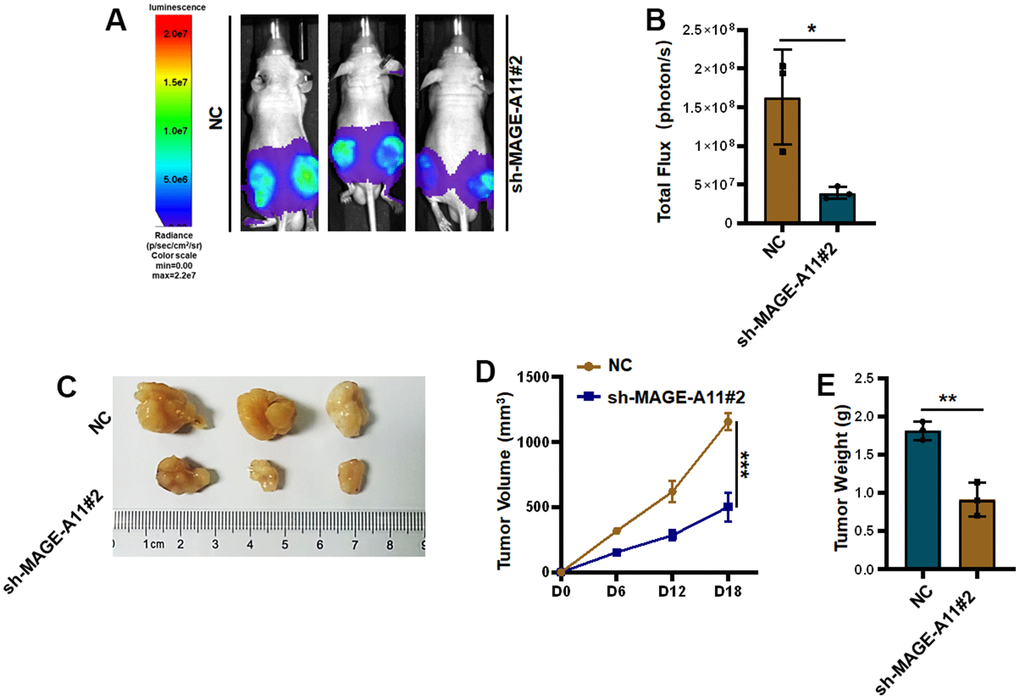
Figure 12. Knockout of MAGE-A11 affects tumor growth in vivo. (A) Animal imaging image. (B) Fluorescence value of animal imaging. (C) Image of tumor in experimental group and control group. (D) Tumor volume curve (E) tumor weight.
Discussion
GC remains one of the most prevalent cancers [20]. Due to the asymptomatic fact in the earlier stage, the five-year survival rate for patients after diagnosis remains poor and despite significant advances in antineoplastic treatment [21]. There is therefore an urgent need for an antineoplastic method that will improve patient survival rate and treatment outcomes.
Immunotherapy shows promise as an effective treatment [22]. The MAGE-A subfamily, which is the most extensively researched group among the cancer/testis antigens, is viewed as a possible target for immunotherapy and is therefore incorporated into clinical studies. Tumour vaccines that contain MAGE- A3 have been developed and analysed in clinical trials for melanoma and non-small cell lung cancer patients [23, 24]. Meanwhile, MAGE-A1, MAGE-A3, MAGE-A4, and MAGE-A10 have been identified as targets for TCR-T cell immunotherapy [25].
Members of the MAGE-A subfamily are also involved in the process of tumour development. Zhao and his colleagues discovered that MAGE-A1 can impact the proliferation and migration of tumors in breast and ovarian cancers by influencing the NOTCH signaling pathway. This was achieved by decreasing the stability of NCID through affecting its ubiquitination modifications [26]. MAGE-A2 was highly expressed in cancers such as glioma, lung cancer and embryonal carcinoma and is closely associated with poor patient prognosis [27–29]. Hideki Uj and colleagues found that MAGE-A2 played a prognostic role in lung cancer and may promote tumor by regulating the p53 signaling pathway [28]. Studies have reported that MAGE-A3 was highly expressed in tumours such as gastric, bladder, prostate, colon and melanoma [30]. This suggested that MAGE-A3 played a vital role in tumourigenesis and progression. MAGE-A11 was highly expressed in esophageal squamous cell carcinoma, head and neck squamous cell carcinoma and retinoblastoma and was involved in tumour resistance, proliferation, migration and apoptosis [31–34]. However, this study provided the initial suggestion that MAGE-A11 was an autonomous prognostic aspect in GC, and its manifestation associated closely with the tumor immune microenvironment.
The study identified that MAGE-A11 had an autonomous prognostic effect and regulated tumour cell proliferation and migration. However, the research has some limitations that should be scrutinized for further study and exploration. For instance, the regulation of the molecular mechanisms of cell proliferation, migration and cellular immunity is attributed to MAGE- A11. It remains to be investigated whether MAGE-A11’s ability to regulate the tumor microenvironment will have an impact on the condition of tumor stem cells. Additionally, the question of whether MAGE-A11 exerts similar influence in other types of tumours merits further investigation.
Overall, the results of our study indicated that MAGE-A11 may be an independent prognostic factor for GC patients. Additionally, we observed that MAGE-A11 was capable of promoting tumour cell proliferation and migration. These findings suggested that MAGE-A11 could be a valuable target for therapeutic intervention in GC.
Author Contributions
J P L., and X H L. designed research; Z W W. performed research. Z W W. and C Y Z. analyzed data. Z W W. and YQY wrote the paper. Z W W., YQY. and M J X. participated in the revision of the manuscript. All authors read and approved the final manuscript. Z W W and Y Q Y contributed equally to this study. J P L and X H L are the corresponding authors of this study.
Conflicts of Interest
The authors declare that they have no conflicts of interest.
Ethical Statement
All mouse experimental procedures and procedures were evaluated and authorized in strict accordance with the guiding principles of the Animal Protection and Use Committee of Wuhan University of Science and Technology and in accordance with the “Hubei Province Experimental Animal Management Regulations.” The animal ethics number for this study is D3321.
Funding
This work was financially supported by National Natural Science Foundation of China (No. 82203497), Hubei Natural Science Foundation (2022CFB026), “The 14th Five Year Plan” Hubei Provincial Advantaged Characteristic Disciplines (Groups) Project of Wuhan University of Science and Technology (2023C0303), China Postdoctoral Science Foundation (2021M702538), Department of Education of Hubei Province (B2021023), and 2023 Natural Science Foundation Project of Hunan Province (2023JJ50310).
References
- 1. Taefehshokr N, Baradaran B, Baghbanzadeh A, Taefehshokr S. Promising approaches in cancer immunotherapy. Immunobiology. 2020; 225:151875. https://doi.org/10.1016/j.imbio.2019.11.010 [PubMed]
- 2. Sang M, Lian Y, Zhou X, Shan B. MAGE-A family: attractive targets for cancer immunotherapy. Vaccine. 2011; 29:8496–500. https://doi.org/10.1016/j.vaccine.2011.09.014 [PubMed]
- 3. Thomas R, Al-Khadairi G, Roelands J, Hendrickx W, Dermime S, Bedognetti D, Decock J. NY-ESO-1 Based Immunotherapy of Cancer: Current Perspectives. Front Immunol. 2018; 9:947. https://doi.org/10.3389/fimmu.2018.00947 [PubMed]
- 4. Forghanifard MM, Gholamin M, Farshchian M, Moaven O, Memar B, Forghani MN, Dadkhah E, Naseh H, Moghbeli M, Raeisossadati R, Abbaszadegan MR. Cancer-testis gene expression profiling in esophageal squamous cell carcinoma: identification of specific tumor marker and potential targets for immunotherapy. Cancer Biol Ther. 2011; 12:191–7. https://doi.org/10.4161/cbt.12.3.15949 [PubMed]
- 5. Bolli M, Schultz-Thater E, Zajac P, Guller U, Feder C, Sanguedolce F, Carafa V, Terracciano L, Hudolin T, Spagnoli GC, Tornillo L. NY-ESO-1/LAGE-1 coexpression with MAGE-A cancer/testis antigens: a tissue microarray study. Int J Cancer. 2005; 115:960–6. https://doi.org/10.1002/ijc.20953 [PubMed]
- 6. Zhang Y, Zhang Y, Zhang L. Expression of cancer-testis antigens in esophageal cancer and their progress in immunotherapy. J Cancer Res Clin Oncol. 2019; 145:281–91. https://doi.org/10.1007/s00432-019-02840-3 [PubMed]
- 7. Meek DW, Marcar L. MAGE-A antigens as targets in tumour therapy. Cancer Lett. 2012; 324:126–32. https://doi.org/10.1016/j.canlet.2012.05.011 [PubMed]
- 8. Craig AJ, Garcia-Lezana T, Ruiz de Galarreta M, Villacorta-Martin C, Kozlova EG, Martins-Filho SN, von Felden J, Ahsen ME, Bresnahan E, Hernandez-Meza G, Labgaa I, D’Avola D, Schwartz M, et al. Transcriptomic characterization of cancer-testis antigens identifies MAGEA3 as a driver of tumor progression in hepatocellular carcinoma. PLoS Genet. 2021; 17:e1009589. https://doi.org/10.1371/journal.pgen.1009589 [PubMed]
- 9. Hou SY, Sang MX, Geng CZ, Liu WH, Lü WH, Xu YY, Shan BE. Expressions of MAGE-A9 and MAGE-A11 in breast cancer and their expression mechanism. Arch Med Res. 2014; 45:44–51. https://doi.org/10.1016/j.arcmed.2013.10.005 [PubMed]
- 10. Mengus C, Schultz-Thater E, Coulot J, Kastelan Z, Goluza E, Coric M, Spagnoli GC, Hudolin T. MAGE-A10 cancer/testis antigen is highly expressed in high-grade non-muscle-invasive bladder carcinomas. Int J Cancer. 2013; 132:2459–63. https://doi.org/10.1002/ijc.27914 [PubMed]
- 11. Picard V, Bergeron A, Larue H, Fradet Y. MAGE-A9 mRNA and protein expression in bladder cancer. Int J Cancer. 2007; 120:2170–7. https://doi.org/10.1002/ijc.22282 [PubMed]
- 12. Ayyoub M, Memeo L, Alvarez-Fernández E, Colarossi C, Costanzo R, Aiello E, Martinetti D, Valmori D. Assessment of MAGE-A expression in resected non-small cell lung cancer in relation to clinicopathologic features and mutational status of EGFR and KRAS. Cancer Immunol Res. 2014; 2:943–8. https://doi.org/10.1158/2326-6066.CIR-13-0211 [PubMed]
- 13. Ritchie ME, Phipson B, Wu D, Hu Y, Law CW, Shi W, Smyth GK. limma powers differential expression analyses for RNA-sequencing and microarray studies. Nucleic Acids Res. 2015; 43:e47. https://doi.org/10.1093/nar/gkv007 [PubMed]
- 14. Ito K, Murphy D. Application of ggplot2 to Pharmacometric Graphics. CPT Pharmacometrics Syst Pharmacol. 2013; 2:e79. https://doi.org/10.1038/psp.2013.56 [PubMed]
- 15. Yu G, He QY. ReactomePA: an R/Bioconductor package for reactome pathway analysis and visualization. Mol Biosyst. 2016; 12:477–9. https://doi.org/10.1039/c5mb00663e [PubMed]
- 16. Yu G, Wang LG, Han Y, He QY. clusterProfiler: an R package for comparing biological themes among gene clusters. OMICS. 2012; 16:284–7. https://doi.org/10.1089/omi.2011.0118 [PubMed]
- 17. Yu G, Wang LG, Yan GR, He QY. DOSE: an R/Bioconductor package for disease ontology semantic and enrichment analysis. Bioinformatics. 2015; 31:608–9. https://doi.org/10.1093/bioinformatics/btu684 [PubMed]
- 18. Chen B, Khodadoust MS, Liu CL, Newman AM, Alizadeh AA. Profiling Tumor Infiltrating Immune Cells with CIBERSORT. Methods Mol Biol. 2018; 1711:243–59. https://doi.org/10.1007/978-1-4939-7493-1_12 [PubMed]
- 19. Wang Y, Guo S, Chen Z, Bai B, Wang S, Gao Y. Re-Clustering and Profiling of Digestive System Tumors According to Microenvironment Components. Front Oncol. 2021; 10:607742. https://doi.org/10.3389/fonc.2020.607742 [PubMed]
- 20. Sung H, Ferlay J, Siegel RL, Laversanne M, Soerjomataram I, Jemal A, Bray F. Global Cancer Statistics 2020: GLOBOCAN Estimates of Incidence and Mortality Worldwide for 36 Cancers in 185 Countries. CA Cancer J Clin. 2021; 71:209–49. https://doi.org/10.3322/caac.21660 [PubMed]
- 21. Lian Y, Sang M, Gu L, Liu F, Yin D, Liu S, Huang W, Wu Y, Shan B. MAGE-A family is involved in gastric cancer progression and indicates poor prognosis of gastric cancer patients. Pathol Res Pract. 2017; 213:943–8. https://doi.org/10.1016/j.prp.2017.05.007 [PubMed]
- 22. Peled N, Oton AB, Hirsch FR, Bunn P. MAGE A3 antigen-specific cancer immunotherapeutic. Immunotherapy. 2009; 1:19–25. https://doi.org/10.2217/1750743X.1.1.19 [PubMed]
- 23. Pujol JL, Vansteenkiste JF, De Pas TM, Atanackovic D, Reck M, Thomeer M, Douillard JY, Fasola G, Potter V, Taylor P, Bosquée L, Scheubel R, Jarnjak S, et al. Safety and Immunogenicity of MAGE-A3 Cancer Immunotherapeutic with or without Adjuvant Chemotherapy in Patients with Resected Stage IB to III MAGE-A3-Positive Non-Small-Cell Lung Cancer. J Thorac Oncol. 2015; 10:1458–67. https://doi.org/10.1097/JTO.0000000000000653 [PubMed]
- 24. Vansteenkiste J, Zielinski M, Linder A, Dahabreh J, Gonzalez EE, Malinowski W, Lopez-Brea M, Vanakesa T, Jassem J, Kalofonos H, Perdeus J, Bonnet R, Basko J, et al. Adjuvant MAGE-A3 immunotherapy in resected non-small-cell lung cancer: phase II randomized study results. J Clin Oncol. 2013; 31:2396–403. https://doi.org/10.1200/JCO.2012.43.7103 [PubMed]
- 25. Meng X, Sun X, Liu Z, He Y. A novel era of cancer/testis antigen in cancer immunotherapy. Int Immunopharmacol. 2021; 98:107889. https://doi.org/10.1016/j.intimp.2021.107889 [PubMed]
- 26. Zhao J, Wang Y, Mu C, Xu Y, Sang J. MAGEA1 interacts with FBXW7 and regulates ubiquitin ligase-mediated turnover of NICD1 in breast and ovarian cancer cells. Oncogene. 2017; 36:5023–34. https://doi.org/10.1038/onc.2017.131 [PubMed]
- 27. Meng Q, Luo G, Liu B, Sun Y, Yan Z. Melanoma-associated antigen A2 is overexpressed in glioma and associated with poor prognosis in glioma patients. Neoplasma. 2018; 65:604–9. https://doi.org/10.4149/neo_2018_170625N440 [PubMed]
- 28. Ujiie H, Kato T, Lee D, Hu HP, Fujino K, Kaji M, Kaga K, Matsui Y, Yasufuku K. Overexpression of MAGEA2 has a prognostic significance and is a potential therapeutic target for patients with lung cancer. Int J Oncol. 2017; 50:2154–70. https://doi.org/10.3892/ijo.2017.3984 [PubMed]
- 29. Saeednejad Zanjani L, Razmi M, Fattahi F, Kalantari E, Abolhasani M, Saki S, Madjd Z, Mohsenzadegan M. Overexpression of melanoma-associated antigen A2 has a clinical significance in embryonal carcinoma and is associated with tumor progression. J Cancer Res Clin Oncol. 2022; 148:609–31. https://doi.org/10.1007/s00432-021-03859-1 [PubMed]
- 30. Xie C, Subhash VV, Datta A, Liem N, Tan SH, Yeo MS, Tan WL, Koh V, Yan FL, Wong FY, Wong WK, So J, Tan IB, et al. Melanoma associated antigen (MAGE)-A3 promotes cell proliferation and chemotherapeutic drug resistance in gastric cancer. Cell Oncol (Dordr). 2016; 39:175–86. https://doi.org/10.1007/s13402-015-0261-5 [PubMed]
- 31. Hartmann S, Zwick L, Scheurer MJJ, Fuchs AR, Brands RC, Seher A, Böhm H, Kübler AC, Müller-Richter UDA. MAGE-A11 expression contributes to cisplatin resistance in head and neck cancer. Clin Oral Investig. 2018; 22:1477–86. https://doi.org/10.1007/s00784-017-2242-8 [PubMed]
- 32. Sang M, Gu L, Liu F, Lian Y, Yin D, Fan X, Ding C, Huang W, Liu S, Shan B. Prognostic Significance of MAGE-A11 in Esophageal Squamous Cell Carcinoma and Identification of Related Genes Based on DNA Microarray. Arch Med Res. 2016; 47:151–61. https://doi.org/10.1016/j.arcmed.2016.06.001 [PubMed]
- 33. Su S, Minges JT, Grossman G, Blackwelder AJ, Mohler JL, Wilson EM. Proto-oncogene activity of melanoma antigen-A11 (MAGE-A11) regulates retinoblastoma-related p107 and E2F1 proteins. J Biol Chem. 2013; 288:24809–24. https://doi.org/10.1074/jbc.M113.468579 [PubMed]
- 34. Jia S, Zhang M, Li Y, Zhang L, Dai W. MAGE-A11 Expression Predicts Patient Prognosis in Head and Neck Squamous Cell Carcinoma. Cancer Manag Res. 2020; 12:1427–35. https://doi.org/10.2147/CMAR.S237867 [PubMed]