Association of expression of IAP family members with immune infiltration in HNSCC
The Tumour Immune Estimation Resource (TIMER) was employed to determine the link between immune cell infiltration and the IAP gene family (Figure 6). The results illustrated that NAIP expression was substantially linked to B-cell (cor = 0.314, P < 0.05), CD8+ T-cell (cor = 0.445, P < 0.05), CD4+ T-cell (cor = 0.657, P < 0.05), macrophage (cor = 0.576, P < 0.05), neutrophil (cor = 0.717, P < 0.05), and dendritic cell (cor = 0.675, P < 0.05) infiltration. There was a strong link between BIRC2 mRNA expression and the infiltrating levels of CD4+ T-cells (cor = 0.271, P < 0.05), macrophages (cor = 0.119, P < 0.05), neutrophils (cor = 0.235, P < 0.05), and dendritic cells (DCs) (cor = 0.199, P < 0.05). Significant associations were observed between BIRC3 expression and B-cell (cor = 0.356, P < 0.05), CD8+ T-cell (cor = 0.326, P < 0.05), CD4+ T-cell (cor = 0.432, P < 0.05), macrophage (cor = 0.342, P < 0.05), neutrophil (cor = 0.451, P < 0.05), and DCs (cor = 0.479, P < 0.05) infiltrates. Significant associations were observed between the levels of B-cells (cor = 0.116, P < 0.05), CD8+ T-cells (cor = 0.099, P < 0.05), CD4+ T-cells (cor = 0.422, P < 0.05), macrophages (cor = 0.188, P < 0.05), neutrophils (cor = 0.197, P < 0.05), and DCs (cor = 0.270, P < 0.05). There was a strong link between BIRC6 mRNA expression and the infiltrating levels of B-cells (cor = 0.169, P < 0.05), CD8+ T-cells (cor = 0.153, P < 0.05), CD4+ T-cells (cor = 0.474, P < 0.05), macrophages (cor = 0.287, P < 0.05), neutrophils (cor = 0.252, P < 0.05), and DCs (cor = 0.365, P < 0.05). Considerable associations were observed between BIRC7 expression and B-cell (cor = 0.225, P < 0.05), CD8+ T-cell (cor = 0.186, P < 0.05), CD4+ T-cell (cor = 0.280, P < 0.05), macrophage (cor = 0.426, P < 0.05), neutrophil (cor = 0.249, P < 0.05), and DCs (cor = 0.348, P < 0.05) infiltrates. The level of BIRC8 mRNA was substantially linked to B-cell (cor = 0.135, P < 0.05), CD8+ T-cell (cor = 0.183, P < 0.05), CD4+ T-cell (cor = 0.127, P < 0.05), macrophage (cor = 0.140, P < 0.05), neutrophil (cor = 0.118, P < 0.05), and DC (cor = 0.125, P < 0.05) infiltrates. However, immune cell infiltration did not exhibit a link to BIRC5 expression. In the HNSCC tumour microenvironment (TME), our data indicate that the IAP family members, including BIRC2, may affect immune response.
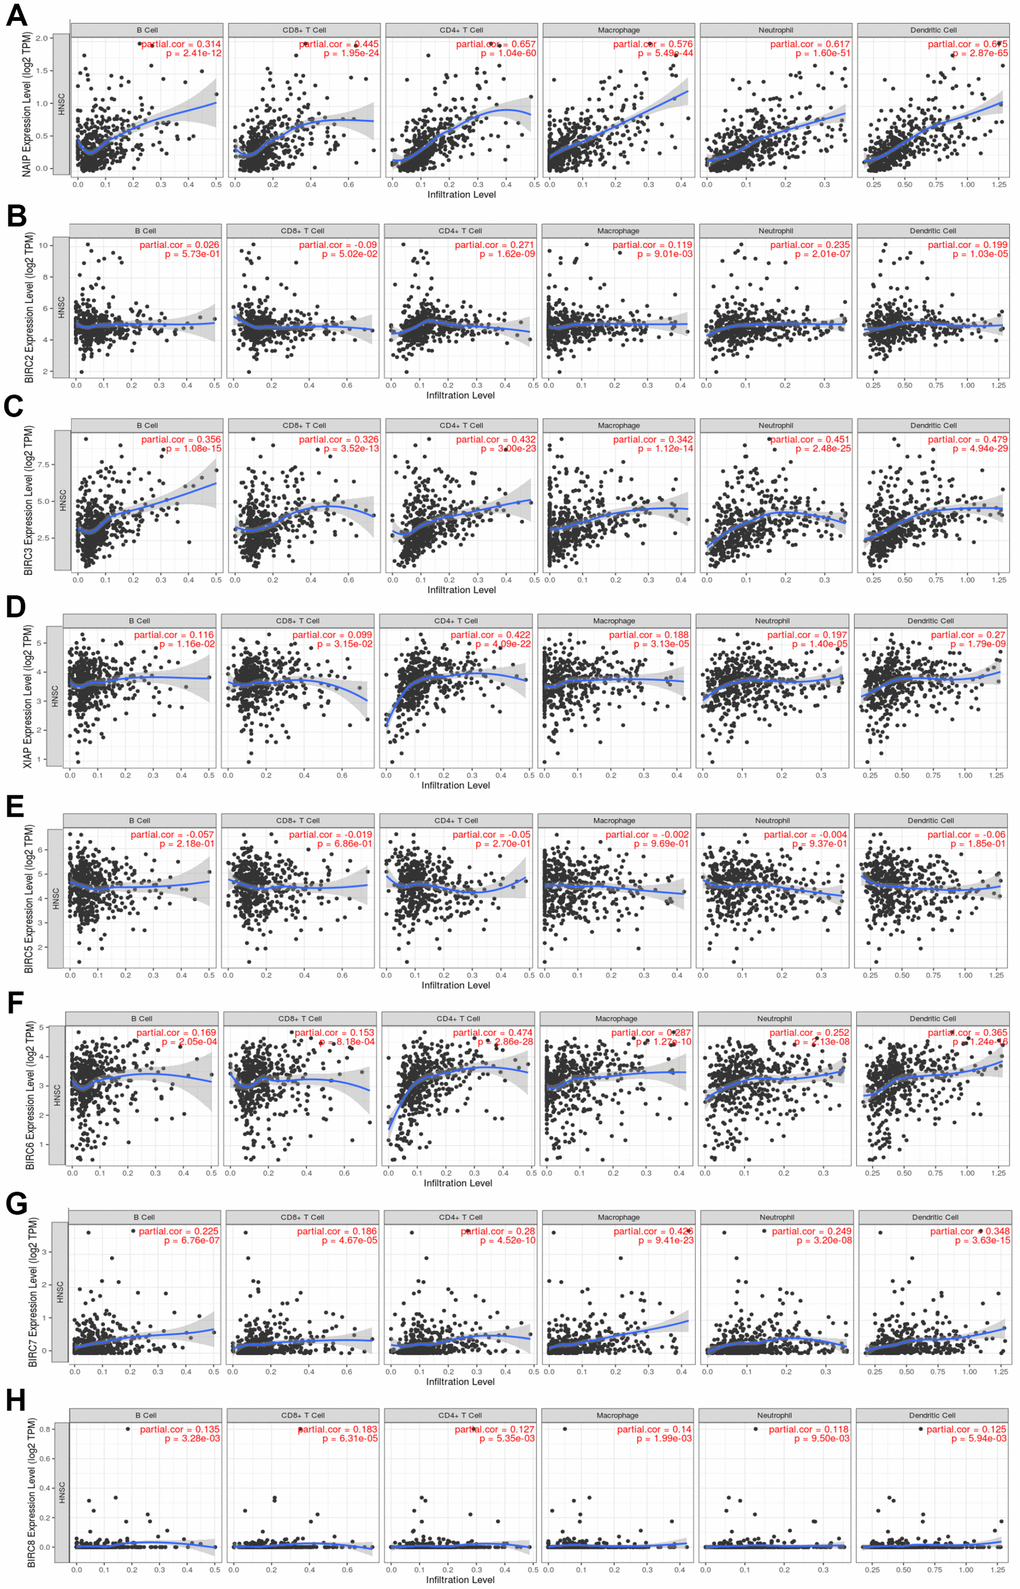
Figure 6. Association between the level of IAP mRNA expressed and the infiltration of immune cells. (A–H) Immune cell infiltration was assessed by examining the relationships between IAP family members and the TIMER database.
The marker types present in HNSCC were examined by the TIMER database, including DCs, CD8+ T lymphocytes, neutrophils, T helper 1 (Th1) cells, and tumour-associated macrophages (TAM). This study aimed to examine immune cell-IAP family expression relationships (Table 1). A strong association exists between the levels of immune cells and members of the IAP family, except for BIRC5. Moreover, NAIP was shown to be strongly linked to CD8+ T lymphocytes, B, and TAMs, M2 macrophages, neutrophils, DCs, natural killer cells (NK), Th1, Th2, Tfh, Th17, regulatory T cells (Tregs), exhausted T cells, and monocytes. Additionally, BIRC2 exhibited a good correlation with TAMs, Tregs, M2 macrophages, DCs, Th1, Th2, and monocytes. BIRC3 demonstrated a robust correlation with CD8+ T lymphocytes, B cells, TAM, M1/M2 macrophages, monocytes, DCs, NK cells, exhausted T cells, Th1 cells, regulatory T cells, Th2 cells, T follicular helper cells, Th17 cells, and neutrophils. XIAP exhibited a significant association with B cells, T cells, TAM, M1/M2 macrophages, neutrophils, DCs, NK cells, Th1 cells, Th2 cells, T follicular helper cells, Th17 cells, regulatory T cells, exhausted T cells, and monocytes. Moreover, BIRC6 demonstrated a positive relationship with TAMs, M1/M2 macrophages, neutrophils, DCs, NK cells, Th1 cells, Th2 cells, monocytes, exhausted T cells, Th17 cells, regulatory T cells, and T follicular helper cells. There is a significant connection between BIRC7 and CD8+ T lymphocytes, T cells, TAMs, exhausted T cells, neutrophils, DCs, B cells, NK, Th1, Th2, Tfh, Th17, Tregs, M1/M2 macrophages, and monocytes. Additionally, BIRC8 displays a strong correlation with T cells, CD8+ T lymphocytes, B cells, TAMs, DC, NK, and Th1 cells. These observations indicate that the IAP family members may have contributed to the immune infiltration in HNSCC.
Table 1. The correlations between the expression of IAP family members and the markers of immune cells.
| | NAIP | BIRC2 | BIRC3 | XIAP | BIRC5 | BIRC6 | BIRC7 | BIRC8 |
| Cor | P | Cor | P | Cor | P | Cor | P | Cor | P | Cor | P | Cor | P | Cor | P |
| CD8+ Tcell | CD8A | 0.557 | *** | -0.029 | 0.527 | 0.386 | *** | 0.141 | ** | -0.024 | 0.600 | 0.202 | *** | 0.236 | *** | 0.194 | *** |
| CD8B | 0.529 | *** | -0.072 | 0.11 | 0.385 | *** | 0.066 | 0.147 | 0.012 | 0.789 | 0.129 | ** | 0.265 | *** | 0.206 | *** |
| GZMA | 0.411 | *** | 0.018 | 0.696 | 0.303 | *** | 0.023 | 0.615 | 0.054 | 0.234 | 0.052 | 0.252 | 0.251 | *** | 0.148 | ** |
| B cell | CD19 | 0.451 | *** | -0.016 | 0.722 | 0.445 | *** | 0.205 | *** | 0.052 | 0.251 | 0.255 | *** | 0.191 | *** | 0.202 | *** |
| CD79A | 0.439 | *** | -0.011 | 0.807 | 0.419 | *** | 0.226 | *** | 0.024 | 0.593 | 0.318 | *** | 0.107 | * | 0.180 | *** |
| MS4A1 | 0.501 | *** | 0.004 | 0.924 | 0.440 | *** | 0.258 | *** | -0.033 | 0.463 | 0.308 | *** | 0.150 | ** | 0.154 | ** |
| T cell | CD3D | 0.485 | *** | -0.041 | 0.36 | 0.416 | *** | 0.049 | 0.282 | 0.050 | 0.267 | 0.081 | 0.074 | 0.286 | *** | 0.198 | *** |
| CD3E | 0.611 | *** | 0.013 | 0.772 | 0.466 | *** | 0.201 | *** | -0.033 | 0.462 | 0.257 | *** | 0.289 | *** | 0.199 | *** |
| CD2 | 0.603 | *** | 0.001 | 0.988 | 0.435 | *** | 0.171 | *** | -0.014 | 0.750 | 0.21 | *** | 0.324 | *** | 0.194 | *** |
| TAM | CCL2 | 0.524 | *** | 0.179 | *** | 0.301 | *** | 0.292 | *** | -0.003 | 0.941 | 0.359 | *** | 0.233 | *** | 0.101 | * |
| CD68 | 0.391 | *** | 0.048 | 0.291 | 0.189 | *** | 0.315 | *** | -0.068 | 0.135 | 0.356 | *** | 0.187 | *** | 0.031 | 0.495 |
| IL10 | 0.546 | *** | 0.252 | *** | 0.335 | *** | 0.309 | *** | -0.057 | 0.208 | 0.321 | *** | 0.172 | *** | 0.028 | 0.542 |
| M1 | IRF5 | 0.351 | *** | -0.039 | 0.389 | 0.280 | *** | 0.239 | *** | -0.083 | 0.065 | 0.309 | *** | 0.196 | *** | 0.113 | * |
| PTGS2 | 0.005 | 0.912 | 0.278 | *** | 0.144 | ** | 0.236 | *** | 0.036 | 0.421 | 0.217 | *** | -0.250 | *** | 0.014 | 0.759 |
| NOS2 | 0.365 | *** | 0.044 | 0.329 | 0.348 | *** | 0.278 | *** | 0.067 | 0.136 | 0.353 | *** | 0.088 | 0.051 | 0.138 | ** |
| M2 | MS4A4A | 0.604 | *** | 0.181 | *** | 0.344 | *** | 0.163 | *** | 0.037 | 0.409 | 0.299 | *** | 0.383 | *** | 0.072 | 0.109 |
| CD163 | 0.645 | *** | 0.220 | *** | 0.369 | *** | 0.244 | *** | 0.026 | 0.568 | 0.403 | *** | 0.279 | *** | 0.042 | 0.351 |
| VSIG4 | 0.567 | *** | 0.172 | *** | 0.316 | *** | 0.172 | *** | 0.031 | 0.489 | 0.304 | *** | 0.344 | *** | 0.063 | 0.161 |
| Neutrophils | ITGAM | 0.594 | *** | 0.149 | ** | 0.459 | *** | 0.310 | *** | -0.021 | 0.638 | 0.421 | *** | 0.266 | *** | 0.155 | ** |
| CCR7 | 0.603 | *** | 0.059 | 0.192 | 0.500 | *** | 0.289 | *** | -0.046 | 0.311 | 0.340 | *** | 0.218 | *** | 0.161 | *** |
| SIGLEC5 | 0.735 | *** | 0.219 | *** | 0.501 | *** | 0.371 | *** | 0.067 | 0.135 | 0.511 | *** | 0.225 | *** | 0.148 | ** |
| DC | HLA-DQB1 | 0.435 | *** | 0.077 | 0.090 | 0.357 | *** | 0.105 | * | -0.004 | 0.927 | 0.158 | *** | 0.324 | *** | 0.139 | ** |
| HLA-DPB1 | 0.578 | *** | 0.045 | 0.318 | 0.414 | *** | 0.124 | ** | -0.047 | 0.302 | 0.193 | *** | 0.355 | *** | 0.151 | ** |
| HLA-DRA | 0.610 | *** | 0.125 | ** | 0.455 | *** | 0.181 | *** | -0.063 | 0.161 | 0.258 | *** | 0.276 | *** | 0.132 | ** |
| HLA-DPA1 | 0.621 | *** | 0.114 | * | 0.434 | *** | 0.194 | *** | -0.077 | 0.088 | 0.286 | *** | 0.289 | *** | 0.135 | ** |
| ITGAX | 0.647 | *** | 0.179 | *** | 0.430 | *** | 0.291 | *** | 0.032 | 0.475 | 0.396 | *** | 0.412 | *** | 0.166 | *** |
| CD1C | 0.454 | *** | 0.059 | 0.192 | 0.302 | *** | 0.267 | *** | -0.220 | *** | 0.272 | *** | 0.258 | *** | 0.102 | * |
| NRP1 | 0.523 | *** | 0.345 | *** | 0.193 | *** | 0.354 | *** | -0.079 | 0.082 | 0.503 | *** | 0.155 | ** | -0.035 | 0.437 |
| NK cell | KIR2DL1 | 0.237 | *** | 0.080 | 0.075 | 0.267 | *** | 0.022 | 0.626 | -0.025 | 0.586 | 0.104 | * | 0.059 | 0.192 | 0.067 | 0.140 |
| KIR2DL3 | 0.357 | *** | -0.013 | 0.780 | 0.269 | *** | 0.067 | 0.137 | 0.002 | 0.959 | 0.116 | * | 0.134 | ** | 0.089 | * |
| KIR2DL4 | 0.372 | *** | 0.004 | 0.937 | 0.282 | *** | 0.098 | * | 0.002 | 0.973 | 0.162 | *** | 0.138 | ** | 0.160 | *** |
| KIR3DL1 | 0.390 | *** | -0.067 | 0.136 | 0.240 | *** | 0.113 | * | -0.016 | 0.723 | 0.190 | *** | 0.084 | 0.063 | 0.163 | *** |
| KIR3DL2 | 0.441 | *** | 0.033 | 0.466 | 0.378 | *** | 0.178 | *** | -0.048 | 0.287 | 0.233 | *** | 0.166 | *** | 0.168 | *** |
| KIR3DL3 | 0.154 | ** | -0.054 | 0.229 | 0.158 | *** | 0.066 | 0.143 | 0.050 | 0.270 | 0.052 | 0.252 | 0.135 | ** | 0.211 | *** |
| KIR2DS4 | 0.224 | *** | -0.080 | 0.075 | 0.158 | *** | 0.043 | 0.340 | -0.013 | 0.778 | 0.081 | 0.071 | 0.096 | * | 0.045 | 0.318 |
| Th1 | TBX21 | 0.567 | *** | -0.028 | 0.538 | 0.379 | *** | 0.147 | ** | 0.024 | 0.599 | 0.206 | *** | 0.309 | *** | 0.200 | *** |
| STAT1 | 0.445 | *** | 0.220 | *** | 0.266 | *** | 0.229 | *** | -0.068 | 0.134 | 0.280 | *** | 0.099 | * | 0.028 | 0.538 |
| STAT4 | 0.549 | *** | 0.246 | *** | 0.486 | *** | 0.216 | *** | 0.024 | 0.588 | 0.262 | *** | 0.329 | *** | 0.116 | * |
| IFNG | 0.411 | *** | -0.030 | 0.511 | 0.282 | *** | 0.037 | 0.418 | 0.030 | 0.514 | 0.037 | 0.412 | 0.222 | *** | 0.156 | *** |
| Th2 | STAT6 | 0.419 | *** | 0.217 | *** | 0.290 | *** | 0.524 | *** | 0.017 | 0.705 | 0.561 | *** | 0.011 | 0.813 | 0.074 | 0.103 |
| GATA3 | 0.348 | *** | 0.095 | * | 0.173 | *** | 0.147 | ** | -0.179 | *** | 0.179 | *** | 0.220 | *** | 0.064 | 0.160 |
| STAT5A | 0.567 | *** | 0.157 | *** | 0.564 | *** | 0.235 | *** | 0.074 | 0.100 | 0.319 | *** | 0.240 | *** | 0.137 | ** |
| Tfh | BCL6 | 0.378 | *** | 0.124 | ** | 0.221 | *** | 0.480 | *** | -0.115 | * | 0.568 | *** | 0.105 | * | 0.084 | 0.063 |
| IL21 | 0.456 | *** | 0.055 | 0.225 | 0.330 | *** | 0.258 | *** | -0.051 | 0.257 | 0.308 | *** | 0.106 | * | 0.162 | *** |
| Th17 | STAT3 | 0.501 | *** | 0.235 | *** | 0.425 | *** | 0.534 | *** | -0.097 | * | 0.681 | *** | -0.005 | 0.915 | 0.072 | 0.112 |
| IL17A | 0.299 | *** | -0.064 | 0.157 | 0.198 | *** | 0.213 | *** | -0.019 | 0.667 | 0.180 | *** | 0.009 | 0.837 | 0.016 | 0.729 |
| Treg | FOXP3 | 0.714 | *** | 0.154 | ** | 0.470 | *** | 0.396 | *** | -0.088 | 0.050 | 0.471 | *** | 0.245 | *** | 0.144 | ** |
| STAT5B | 0.570 | *** | 0.273 | *** | 0.336 | *** | 0.496 | *** | -0.019 | 0.675 | 0.633 | *** | 0.174 | *** | 0.064 | 0.155 |
| CCR8 | 0.735 | *** | 0.264 | *** | 0.453 | *** | 0.516 | *** | -0.107 | * | 0.639 | *** | 0.156 | ** | 0.120 | ** |
| T exhaustion-cell | PDCD1 | 0.556 | *** | -0.011 | 0.816 | 0.425 | *** | 0.121 | ** | 0.023 | 0.612 | 0.167 | *** | 0.295 | *** | 0.212 | *** |
| CTLA4 | 0.560 | *** | 0.121 | ** | 0.477 | *** | 0.136 | ** | 0.074 | 0.103 | 0.156 | *** | 0.329 | *** | 0.152 | ** |
| HAVCR2 | 0.663 | *** | 0.160 | *** | 0.428 | *** | 0.217 | *** | 0.035 | 0.444 | 0.308 | *** | 0.411 | *** | 0.156 | ** |
| LAG3 | 0.480 | *** | 0.023 | 0.606 | 0.354 | *** | 0.018 | 0.685 | 0.116 | * | 0.070 | 0.122 | 0.280 | *** | 0.182 | *** |
| Monocyte | CD86 | 0.606 | *** | 0.252 | *** | 0.454 | *** | 0.223 | *** | 0.018 | 0.695 | 0.330 | *** | 0.345 | *** | 0.086 | 0.057 |
| C3AR1 | 0.680 | *** | 0.213 | *** | 0.406 | *** | 0.238 | *** | 0.021 | 0.635 | 0.343 | *** | 0.351 | *** | 0.088 | 0.052 |
| CSF1R | 0.705 | *** | 0.207 | *** | 0.425 | *** | 0.261 | *** | -0.063 | 0.163 | 0.383 | *** | 0.349 | *** | 0.110 | * |
| *P < 0.05. |
| **P < 0.01. |
| ***P < 0.001. |
The investigation revealed that BIRC2 might have a key role in promoting HNSCC progression. Additional experiments were carried out to validate the BIRC2 differential expression and its relationship with molecules linked to immune cells to elucidate its involvement in HNSCC. The BIRC2 expression in HNSCC samples was studied by qRT-PCR, and 12 HNSCC tissue specimens exhibited a much higher relative expression level of BIRC2 than corresponding nearby non-tumour tissue samples, according to the findings (P < 0.05; Figure 7A). Furthermore, we found a correlation between STAT1 and BIRC2, which is a marker gene for Th1 cells [19]. Relative to adjoining normal tissues, 12 HNSCC samples had a substantially higher relative expression level of STAT1, according to the qRT-PCR data (P < 0.05; Figure 7B). Lastly, we observed a strong positive correlation (R = 0.7086, P < 0.05; Figure 7C) after comparing the expression of BIRC2 and STAT1 in the 12 HNSCC samples.
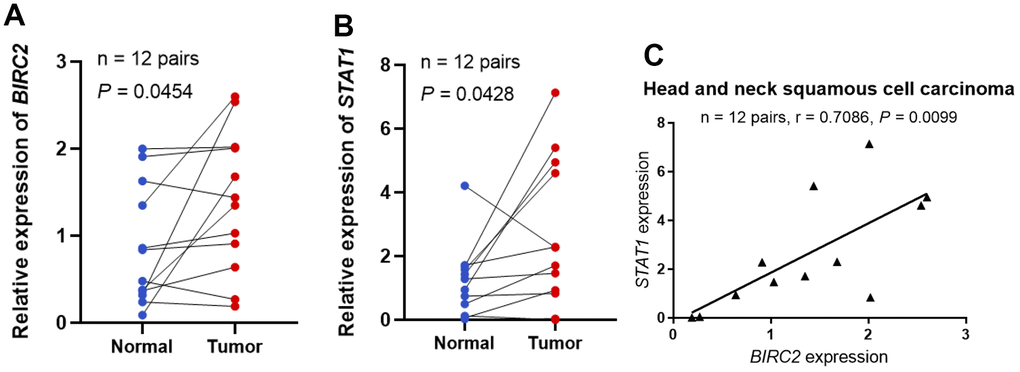
Figure 7. STAT1 and BIRC2 expression levels in HNSCC. (A) The BIRC2 mRNA expression levels in HNSCC. (B) The levels of STAT1 mRNA expression in HNSCC. (C) The correlations between the levels of STAT1 and BIRC2 mRNA expression.
The TME is the internal environment upon which tumour cells depend for survival. It comprises tumour cells, immune cells, chemokines, cytokines, and various other factors. TME is intimately linked with tumour growth, metastasis, immune evasion, and other behaviors. The main functions of Th1 cells are cellular immunity and inflammation. This includes activating other immune cells, like macrophages, B cells, and cytotoxic CD8+ T lymphocytes (CTL), promoting the targeted killing of infected cells, tumour cells, and abnormal cells, as well as inducing cell lysis and other effector functions. The IAP family may regulate macrophage polarisation in HNSCC patients, as certain members have a significant association with M2 macrophage markers. Consequently, the prognostic relevance of IAP family members in HNSCC patients with macrophage enrichment was explored. The findings indicate that in HNSCC patients, increased expression of BIRC2/5 negatively impacted the OS when there was macrophage enrichment (Figure 8A). In HNSCC patients with macrophage enrichment, higher expression of NAIP and BIRC2 was associated with poorer RFS (Figure 8B). These findings suggest that BIRC2 has a vital function in the infiltrating levels of the immune cells and the TME in HNSCC.
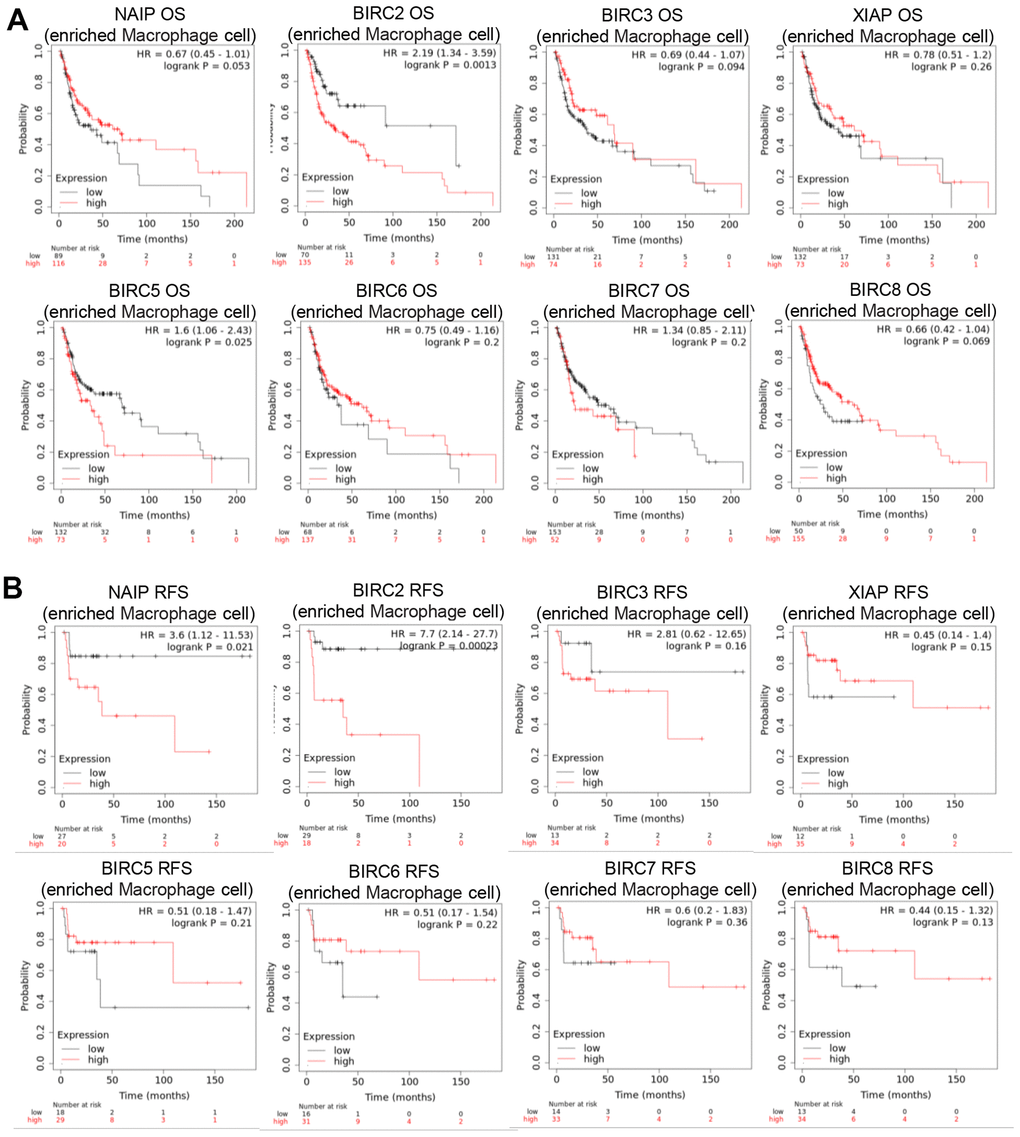
Figure 8. Prognostic significance of IAP family member mRNA expression levels in HNSCC patients. (A, B) Prognostic value of the IAP family in terms of macrophage cell enrichment in HNSCC.
It was further determined whether aberrant IAP family expression affects immunotherapy response in HNSCC. As shown in Figure 9A, BIRC2 expression increased in anti-PD-1/CTLA-4 non-responders in the Riaz cohort (P = 0.021). The Riaz cohort’s area under the receiver operating characteristic curve (AUC) was 0.658, implying that BIRC2 may effectively distinguish between individuals who respond to anti-PD-1/CTLA-4 and those who do not (Figure 9B). This study established BIRC2 as a promising immunotherapeutic target for HNSCC treatment.
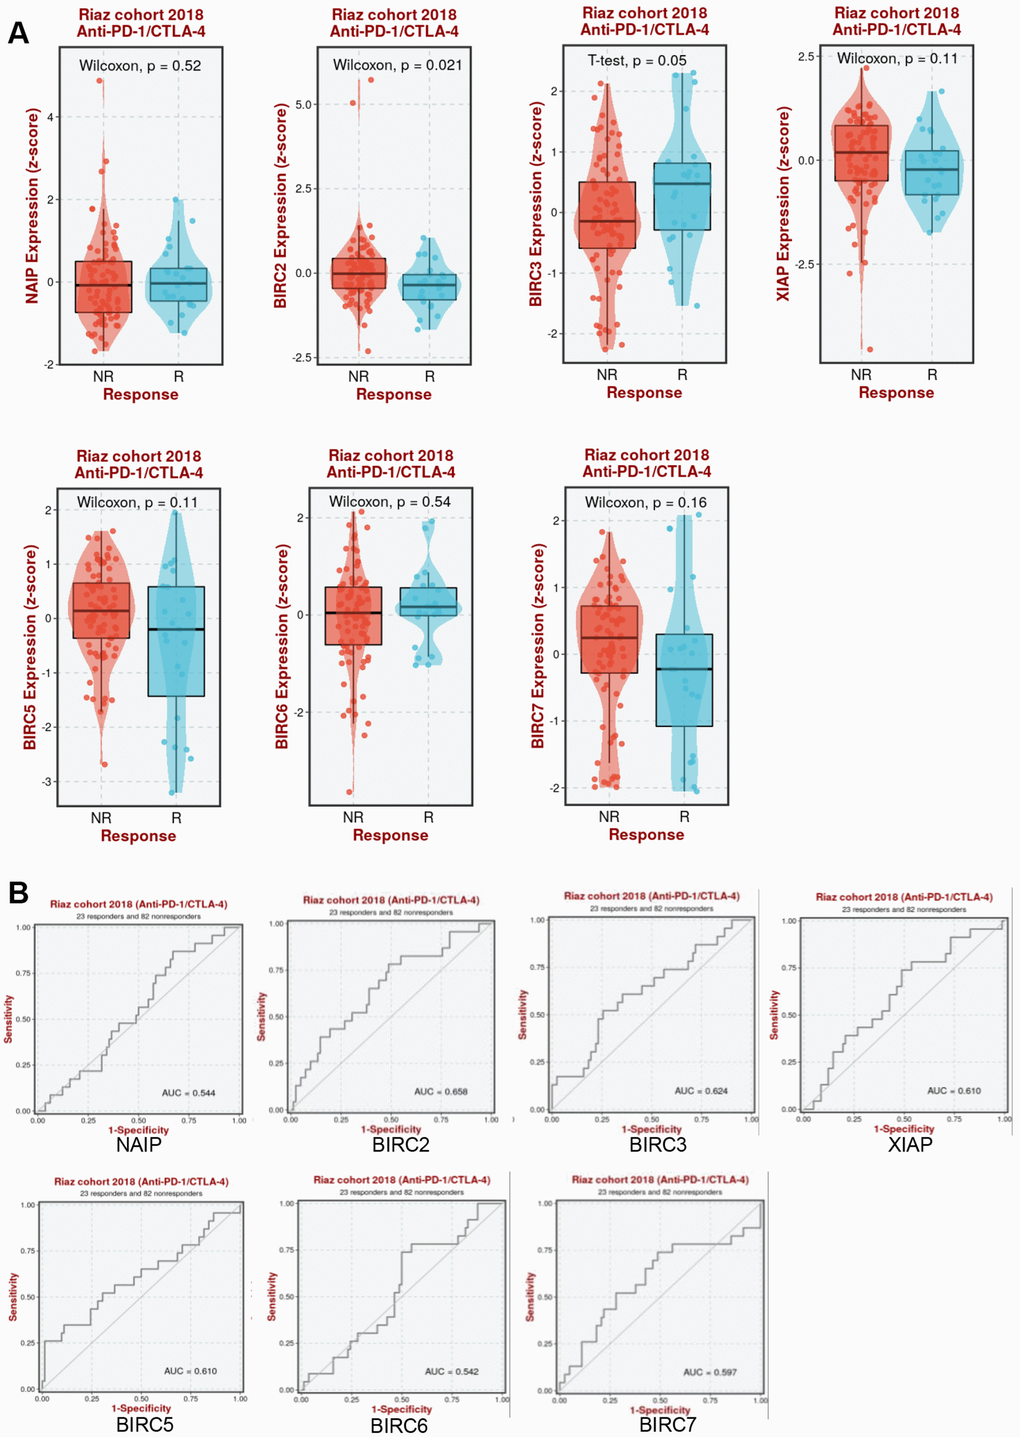
Figure 9. Association between IAP family members and immunotherapy efficacy. (A) Comparative analysis of the IAP family members levels in Riaz cohorts of anti-PD-1/CTLA-4 responders and non-responders. (B) Patients in the Riaz cohorts’ ROC curve for the IAP family.