Submit an Article
Navigate
Home
Editorial Board
Editorial Policies
Current Volume
Archive
Scientific Integrity
Publication Ethics Statements
Interviews with Outstanding Authors
Newsroom
Sponsored Conferences
Podcast
Contact
Special Collections
Submit an Article
Online ISSN: 1945-4589
Research Paper
|
Volume 16, Issue 4
|
pp. 3674–3693
Prognostic value and therapeutic potential of IAP family in head and neck squamous cell carcinoma
Back to article
Figure 2
(2 of 9)
−
100%
+
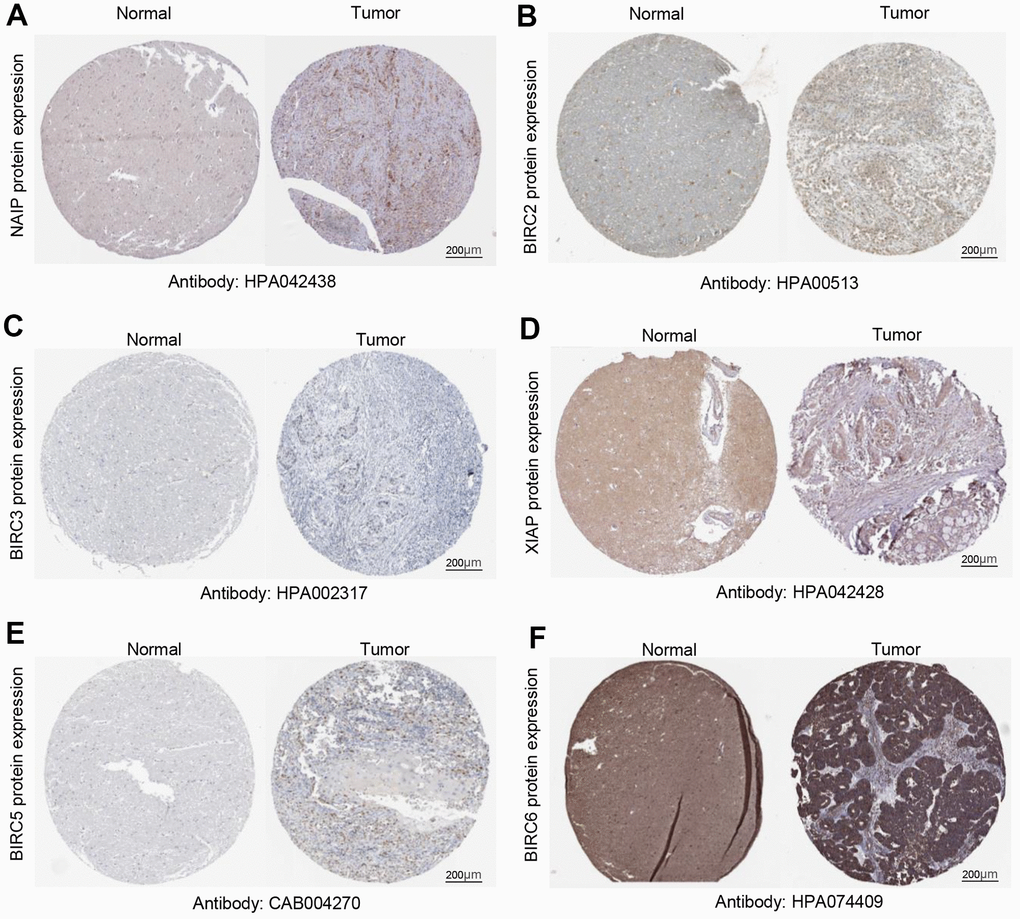
Figure 2.
Quantification of IAP family protein expression in HNSCC.
(
A
–
F
) Protein expression levels of BIRC6, BIRC3, BIRC2, XIAP, BIRC5, and NAIP in HNSCC relative to those of non-cancerous tissues.