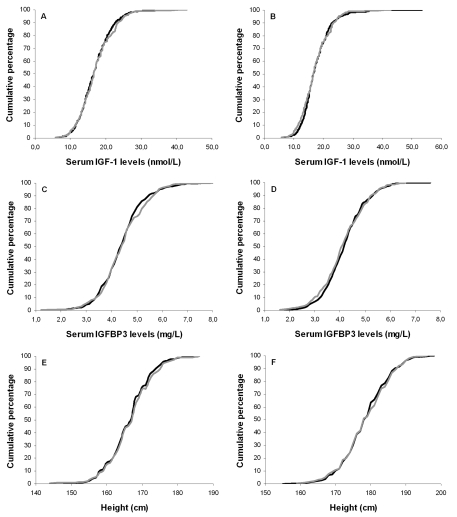
Figure 1.Cumulative distribution curves of serum IGF-1 levels, serum IGFBP3 levels and height.
Cumulative distribution curves of IGF-1 levels for offspring and partners
among females (A) and males (B); Cumulative distribution
curves of IGFBP3 levels for offspring and partners among females (C)
and males (D); Cumulative distribution curves of height for
offspring and partners among females (E) and males (F). Black
lines represent offspring, gray lines represent partners.