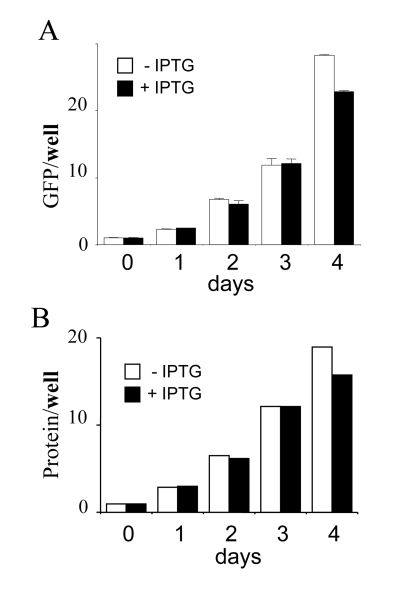
Figure 2.Total cellular mass growth during senescence induction.
HT-p21 cells were grown in 60 mm wells and soluble protein and GFP were
measured daily. Closed bars: HT-p21 cells were treated with IPTG (+IPTG).
Open bars: Untreated HT-p21 cells (-IPTG). In both proliferating (-IPTG)
and non-proliferating (+IPTG) conditions, protein per well
and GFP per well
were increasing. In panel B, protein was measured in duplicate and shown
without standard deviations, therefore statistical difference between
–IPTG and + IPTG should not be considered. The panel simply illustrates
exponential growth in both conditions.