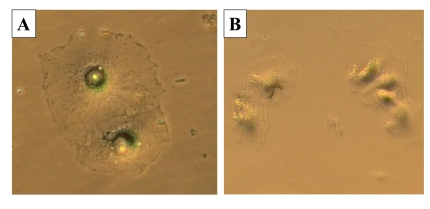
Figure 9.The morphology of cells during recovery. 500 HT-p21 cells
were plated in 12 well plates. The next day, IPTG (A) or IPTG plus
rapamycin (B) was added. After 3 days, plates were washed and
microphotographs were taken after additional 3 days. Cells were stained for
beta-Gal. A: I/w; B: I+R/w.