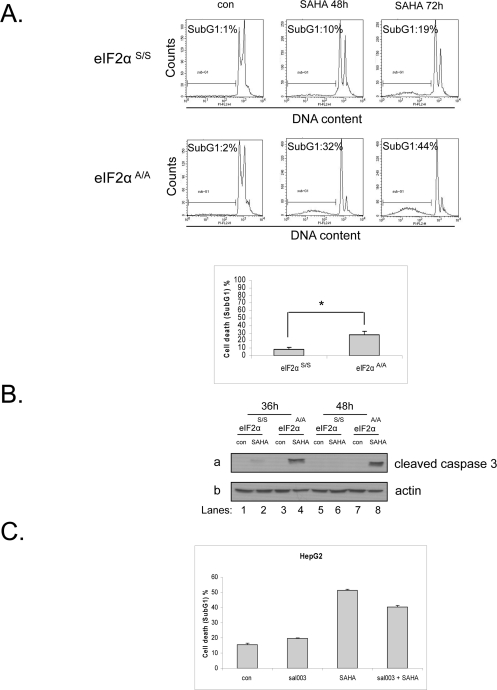
Figure 3.Phosphorylation of eIF2α protects against vorinostat-induced cell death.(A) eIF2αS/S and eIF2αA/A MEFs were treated with DMSO (con) or 10 μM vorinostat (SAHA) for 48h and 72h and were subjected to FACS analysis after propidium iodide staining. Cell death is represented by the percentage (%) of cells in SubG1. Histograms represent the mean cell death from three independent experiments for 48h of treatment (N=3, treated minus untreated). Bars denote S.E.M.. Statistical significance of the difference as calculated by Student's t-test is with *P<0.02. (B) The indicated MEFs were treated with DMSO (con) or 10 μM vorinostat for the indicated time periods. Protein extracts (50 μg) were subjected to western blot analysis for cleaved caspase 3 (panel a) and actin (panel b). A representative blot is shown. (C) HepG2 cells were treated with DMSO (con), 20 μΜ sal003, 10 μM vorinostat (SAHA) or both drugs for 24h and subjected to FACS analysis after propidium iodide staining. Cell death is represented by the percentage (%) of cells in SubG1. Histograms represent the mean cell death from three independent experiments for 24h of treatment (N=3). Bars denote S.E.M.. Statistical significance of the group difference as calculated by ANOVA is with *P<0.0001.