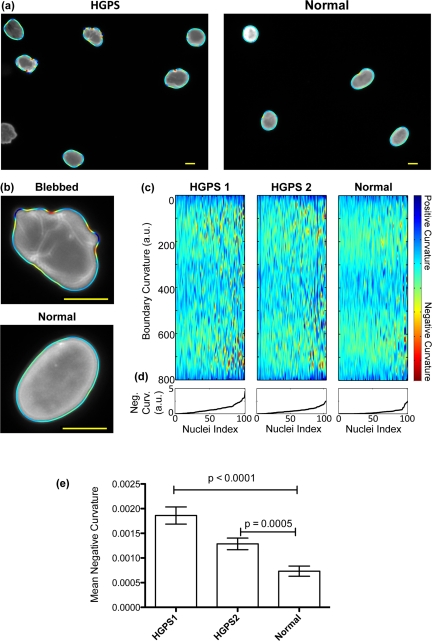
Figure 1.The boundary curvature of HGPS and normal nuclei(a) The curvature of nuclei is automatically extracted from fluorescence images of anti-laminA/C immunostaining. Here, the curvature of HGPS and normal nuclei is shown as a colored outline, where blue represents regions of large positive curvature, and red regions of large negative curvature (scale bar: 10 μm). Blebbed nuclei have more regions of negative curvature, and so have more red signals. (b) High magnification examples of the extracted boundary curvature of a blebbed, HGPS nucleus, and a more oval, normal nucleus (scale bar: 10 μm). (c) The boundary curvature of hundreds of nuclei can be represented in a single heat map. In these heat maps, which here correspond to two HGPS cell lines (HGPS1 and HGPS2, respectively) and one control cell line (Normal), each vertical line is the stretched, colored outline of a single nucleus. Regions of large negative curvature are colored blue while regions of large negative curvature are colored red. (d) The nuclei are ordered from left to right by increasing mean negative curvature (MNC), which is shown in the line plots. (e) The MNC of populations from both HGPS cell lines is statistically different from the population from the normal control, as illustrated in this histogram.