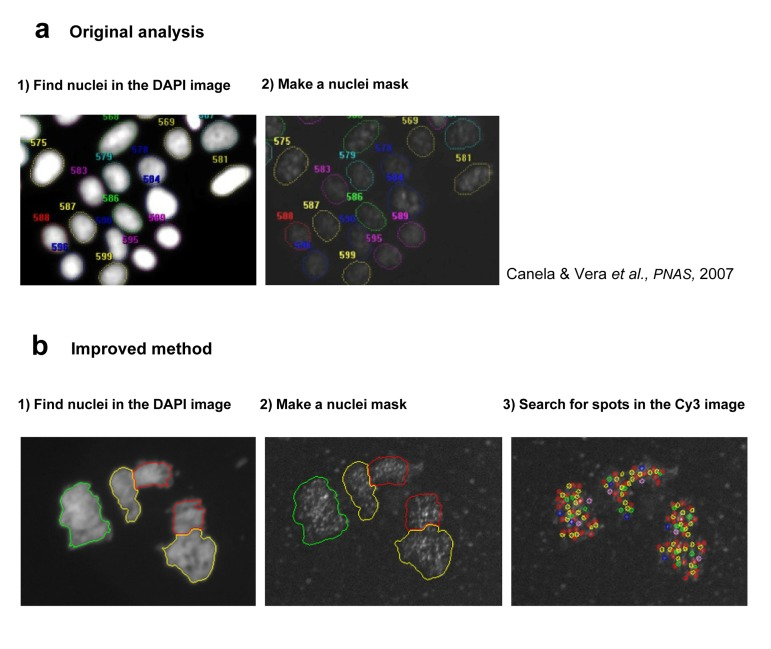
Figure 3.Description of the Image analysis process in original (a) and improved (b) HQ Q-FISH method(a) In the original analysis, the DAPI image was used to create a nuclei mask, and all the CY3 inside this mask is quantified obtaining a mean TL per nucleus (b) The next step was to search for telomeric spots within the nucleus, and to measure, not the mean TL per nucleus but the TL of each individual spot, solving the main difference with the original QFISH on metaphase spreads.