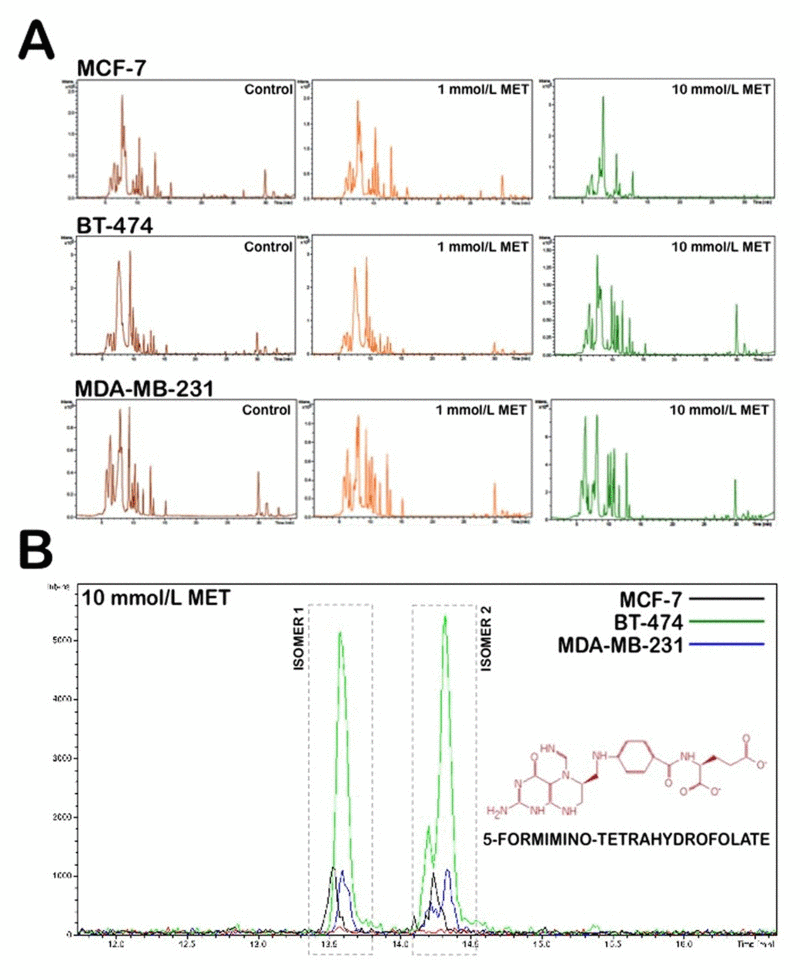
Figure 1.Application of nano-HPLC-ESI-QTOF-MS for the metabolomic analysis of metformin-treated breast cancer cells(A) (-)-nano-HPLC/ESI QTOF mass spectra derived from MCF-7, BT-474, and MDA-MB-231 breast cancer cell lines treated with 1 mmol/L and 10 mmol/L metformin. (B) Accumulation of 5-formimino-tetrahydrofolate following treatment with metformin in breast cancer cells. Figure shows an enlarged section of the spectra acquired on aqueous extracts of breast cancer cells following 48 h of treatment with either solvent control or 10 mmol/L metformin.